
 ?Mathematical formulae have been encoded as MathML and are displayed in this HTML version using MathJax in order to improve their display. Uncheck the box to turn MathJax off. This feature requires Javascript. Click on a formula to zoom.
Abstract
Purpose
Missing data are a potential source of bias in the results of RCTs, but are often unavoidable in clinical research, particularly in patient-reported outcome measures (PROMs). Maximum likelihood (ML), multiple imputation (MI), and inverse probability weighting (IPW) can be used to handle incomplete longitudinal data. This paper compares their performance when analyzing PROMs, using a simulation study based on an RCT data set.
Methods
Realistic missing-at-random data were simulated based on patterns observed during the follow-up of the knee arthroscopy trial (ISRCTN45837371). Simulation scenarios covered different sample sizes, with missing PROM data in 10%–60% of participants. Monotone and nonmonotone missing data patterns were considered. Missing data were addressed by using ML, MI, and IPW and analyzed via multilevel mixed-effects linear regression models. Root mean square errors in the treatment effects were used as performance parameters across 1,000 simulations.
Results
Nonconvergence issues were observed for IPW at small sample sizes. The performance of all three approaches worsened with decreasing sample size and increasing proportions of missing data. MI and ML performed similarly when the MI model was restricted to baseline variables, but MI performed better when using postrandomization data in the imputation model and also in nonmonotone versus monotone missing data scenarios. IPW performed worse than ML and MI in all simulation scenarios.
Conclusion
When additional postrandomization information is available, MI can be beneficial over ML for handling incomplete longitudinal PROM data. IPW is not recommended for handling missing PROM data in the simulated scenarios.
Introduction
Repeated follow-up assessments are common in randomized controlled trials (RCTs).Citation1,Citation2 The multiple observations obtained from each participant are likely to be more correlated with one another than with the values between different individuals. Appropriate statistical analyses, such as mixed-effects linear regression, are needed to handle this aspect of longitudinal data.Citation3–Citation5
Although longitudinal data analysis is an important tool in medical research, the robustness of its results can be affected by missing data. Longitudinal follow-up data can be subject to monotone missingness, where no observations are available for a participant after a specific follow-up time point, such as when a patient drops out or withdraws from the trial. They can also be affected by intermittent missingness, where missing data points are followed by observed data at later follow-ups.Citation6 Often only a small subset of participants from a longitudinal data set have follow-up data available at all time points.
Patient-reported outcome measures (PROMs) are instruments, often in questionnaire form, which include “any report coming directly from patients, without interpretation by physicians or others, about how they [the patients] function or feel in relation to a health condition and its therapy.”Citation7 Before they are used in research, PROMs undergo rigorous testing for validity, reliability, and robustness, to ensure that even small relevant changes in health-related quality of life can be measured and that measurement differences are not due to error or noise.Citation8–Citation11 These characteristics make PROMs an important addition to objective measures, which may not fully capture the patient experience of a specific treatment or disease burden,Citation12 and they are increasingly used in medical research. However, PROMs are susceptible to being missing, particularly in longitudinal follow-up.Citation6,Citation13,Citation14 Missing data patterns and mechanisms for PROMs may differ from those of clinical and more objective outcomes.
The literature provides numerous overviews of statistical methods to handle longitudinal data with missing observations.Citation1,Citation6,Citation15–Citation19 Ad hoc missing data methods include deletion methods, which discard observations with missing data, and single imputation methods, which carry the last observation forward.Citation6,Citation16,Citation20,Citation21 These methods are likely to cause bias and generate overly precise standard errors (SEs). Although their use is generally discouraged, they are commonly used in the analysis of all RCTs, including those with longitudinal follow-up data.Citation1,Citation2,Citation16,Citation19,Citation22–Citation24
The use of model-based approaches, including maximum likelihood (ML) estimation,Citation25 multiple imputation (MI), and inverse probability weighting (IPW),Citation26,Citation27 is encouraged. Their use is supported by their robust underlying methodology, easy implementation in standard statistical software, and use in RCT analyses to date.Citation1,Citation2,Citation23
The literature offers few direct comparisons between the ML, MI, and IPW approaches for missing data. Guidance on best practice is limited, particularly for analyzing PROMs. It is important to understand which statistical approaches are most appropriate for the analysis of longitudinal RCT data, particularly with a focus on PROMs.
Missing data mechanisms
The literature distinguishes between three missing data mechanisms. When missing completely at random (MCAR), the probability of a value being missing is independent of both the observed and unobserved data for this participant. When missing at random (MAR), the probability of data being missing depends on the values of other observed data, but is independent of the values of the missing data. When missing not at random (MNAR), the probability that data are missing is related to the underlying value of these data, and this dependence remains to some extent even when the observed data are taken into account.
Any analysis of MCAR data will produce unbiased results. Unbiased results can be obtained for MAR data if the analysis approach takes into account the variables related to the missing data mechanism. Analyses under an MNAR scenario are always biased if based on conventional statistical techniques which make MAR assumptions.
It is impossible to determine the underlying missing data mechanism using only observed data. Most approaches for handling missing data assume an MAR mechanism, and MAR data are used here. However, possible MNAR mechanisms should always be investigated in supporting sensitivity analyses, as emphasized later.
Statistical methods considered in this simulation study
The methodology and implementation of ML, MI, and IPW are explained briefly here and in detail elsewhere.Citation6,Citation16,Citation24,Citation26–Citation28,Citation30–Citation32 The ML approach “implicitly impute[s] the unobserved data”Citation6 to estimate model parameters.Citation16,Citation28,Citation30 It uses all of the observed data for the relevant outcome collected within the relevant follow-up, provided that baseline covariate data are also available where applicable. Parameter estimates are obtained through an iterative process to maximize the likelihood of producing the sample data.Citation16 The observed data points are used to make inferences about any missing data.
MI is a common simulation-based technique for handling and analyzing missing data. It is generally described as a three-step process.Citation24,Citation32 First, an “imputation model” is created, which regresses the variable to be imputed on a set of variables that are predictive of the missing outcome. Imputations are drawn at random from the posterior distribution of this model. This process is repeated to generate multiple complete data sets. Second, each data set is analyzed separately using an identical prespecified statistical method. The results of these analyses differ only because the imputed observations differ. Third, the results are pooled using Rubin’s rule.Citation33 Including the variation across the imputed data sets reflects the uncertainty around the imputed values.Citation6,Citation24,Citation34,Citation35 MI uses all of the observed outcome data for the relevant variable and assumes that the data are MAR.
MI can be used in cross-sectional settings and to impute missing baseline or follow-up data in RCTs and observational studies. If several variables include missing observations, MI can be applied separately or using an approach such as MI by chained equation (MICE), which facilitates the simultaneous imputation of several incompletely observed variables. In this simulation study, we use MICE to handle missing longitudinal data.
IPW is traditionally used in survey studies. Observations with a low probability of being included in the survey are given a higher weight in the analysis model to mitigate against bias introduced by the sampling design.Citation36,Citation37 However, the technique has also gained popularity in the handling of missing data.Citation26,Citation27,Citation31 The rationale for using IPW in the presence of missing data is that the subset of participants with complete data for all covariates and follow-up time points, called the complete-cases subset, may not be representative of the full data set. The complete-cases data subset is analyzed under IPW, but the cases are weighted differentially to adjust for the bias that would be introduced by a conventional complete-cases analysis.Citation28 Complete cases that have a low probability of being observed due to missing data in comparable participants are given a higher weight in the analysis compared with those with a high probability of being observed. This accounts for the participants who cannot be included in the analysis model due to missing data. However, IPW may produce biased results if a small subgroup of participants has a very low probability of having missing data.Citation18
Hypotheses for this work
The three statistical approaches discussed in this paper (ML, MI, and IPW) all assume an MAR mechanism, but differ in important aspects. Under ML, inferences about missing data are restricted to variables contained in the analysis model. In contrast, the IPW missingness model and MI imputation model are independent from the analysis models and can use information from other variables in the data set, including postrandomization information. This can make the MAR mechanism more plausibleCitation38 and may produce less biased estimates.Citation37
ML and MI use all of the available follow-up data collected within the relevant time frame for a particular outcome, provided that any relevant covariate data are also nonmissing. In contrast, some observed data are discarded in IPW, which may increase bias and decrease precision around the results.
We hypothesized that MI would produce the best (ie, least biased) results when other variables outside the analysis model are available to predict missing values. MI and ML were expected to perform similarly if the imputation model was unable to include variables outside the analysis model that were predictive of the missing outcomes. As IPW can potentially discard large amounts of available information, it was expected to produce inferior results than those of its comparators when analyzing RCTs with no more than 1,000 participants.
Aims of this research
This research aimed at directly comparing the performances of ML, MI, and IPW when handling missing longitudinal PROM data in RCT analyses, using simulations based on the data from an RCT. The three approaches are all well established and can be routinely implemented in standard statistical software. The simulation study also aimed at generating guidance on the most appropriate analysis approach for a range of sample sizes, missing data prevalence, and auxiliary data availability.
Methods
Case study
This simulation study was based on data collected within the knee arthroscopy trial (KAT).Citation40,Citation41 KAT is a large multicenter RCT considering the clinical and cost-effectiveness of new developments in knee replacements. KAT was designed as a partial factorial pragmatic trial. Participants were randomized to at least one of four comparisons: patellar resurfacing versus no patellar resurfacing; mobile versus fixed bearing; all-polyethylene versus metal-backed tibial components; and unicompartmental versus total knee replacements. This simulation study used data from only the patellar resurfacing versus no patellar resurfacing comparison.
Long-term follow-up of >10 years is ongoing for KAT. This simulation study used data over the initial 5-year follow-up and included only participants with fully observed baseline and outcome data. Outcome assessments were performed at 3 months, 1 year, and yearly thereafter. In total, 983 participants had completely observed data for the relevant PROM.
Design of the simulation exercise
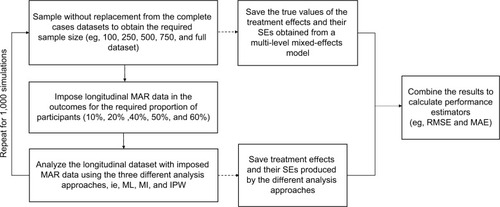
provides the overview of the simulation study. Simulations started with a complete data set (no missing data) of the relevant sample size, from which estimates of the treatment effects and corresponding SEs were obtained. A prespecified proportion of MAR data was then introduced in the PROM follow-up data. The different analysis approaches were applied to the data set with simulated incomplete follow-up. Treatment effects and corresponding SEs were estimated from the imputed data sets and compared with the “true” estimates obtained from the complete data sets. Here, we define “true” estimates as those calculated by using the multilevel mixed-effects model before the introduction of missing data, ie, the estimates that the various approaches for handling missing data aim at replicating. The simulation scenarios considered combinations of sample sizes (100, 250, 500, 750, and 983 participants) and proportions of participants with missing follow-up data (10%, 20%, 40%, 50%, and 60%).
Figure 1 Design of the simulation study.
This simulation study aimed at obtaining 1,000 valid imputation results for each scenario. The performance of the three approaches was measured by the root mean square error (RMSE) and mean absolute error (MAE) between the “true” and imputed treatment effect estimates, which is defined as follows:
where N denotes the number of simulations run (1,000 where feasible), θ the true value for the estimate of interest, and
the estimate of interest obtained from the ith simulation. The simulation work was performed in Stata/SE Version 14.Citation39
Instruments
The 5-year follow-up data for a PROM, the Oxford Knee Score (OKS), are considered. The OKS assesses pain and functional outcomes following knee replacement.Citation42,Citation43 Its 12 items are combined into a composite score ranging from 0 to 48, with higher scores indicating higher levels of function and less pain. shows the mean OKS values observed for the participants in each trial arm at each relevant assessment time point.
Table 1 Mean OKSs across the follow-up in the subset of participants with completely observed outcome data
Missing data simulation
Missing data were introduced into data sets with fully observed OKS data of the relevant sample size. For the majority of simulations, mixtures of monotone and intermittently missing data, based on the eight most commonly observed missing data patterns in the KAT (), were imposed for the relevant proportion of participants. Additional simulations explored monotone missing data patterns, in which participants were equally likely to drop out at any of the follow-up time points.
Table 2 Longitudinal missing data pattern observed in the case study and imposed on the complete data set
MAR data were simulated using an algorithm proposed by van Buuren et alCitation44 and outlined by Yu et alCitation45 and Simons et al.Citation46 This algorithm allows researchers to vary the missing data patterns and the percentage of participants with missing data. outlines the steps the implementation followed. Missing data were generated for 5%, 10%, 20%, 30%, 40%, 50%, and 60% of participants. Sample sizes of 100, 250, 500, and 750 and the maximum sample available were considered. Smaller sample sizes were obtained by sampling the required number of participants from the full data set without replacement before simulating the missing data.
Figure 2 Depiction of the algorithm used for each iteration of the simulation of missing PROMs data within the complete-cases data set.
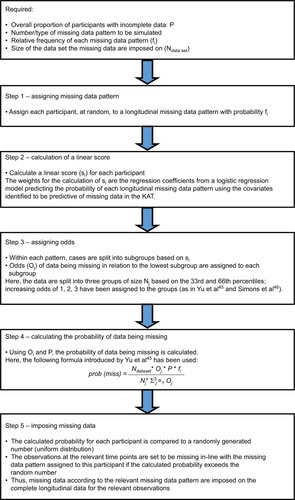
The MAR mechanism was based on logistic regression models using baseline variables and follow-up PROM information, where relevant, to predict whether participants fell into a specific missing data pattern. Explanatory variables were randomization allocation, OKS (baseline and follow-up where appropriate), age, gender, body mass index, American Society of Anesthesiologists’ physical status classification, randomizing center size (small/medium/large), postoperative complications, and adherence to the randomized procedure. The coefficient estimates for each covariate were used in the algorithm to generate missing data.
The effects of a different MAR mechanism were also investigated in a “stronger MAR” scenario. The coefficient estimates used in the logistic regression model for determining the probability of participants having missing data were changed. The coefficients of covariates outside the analysis model were increased threefold, while the coefficients included in the analysis model were halved.
Analysis approaches
The longitudinal PROM data were analyzed using a multilevel mixed-effects regression model to compare the PROM over time between the two randomization allocations. The statistical model was based on the analysis prespecified for the KAT study. It was adjusted for randomization allocation, baseline OKS, gender, age, and follow-up time point (implemented as a dummy variable for each year, using the 1-year follow-up as the reference category). Nonlinear terms or interactions were not used. Although the KAT analysis included interactions between treatment and time,Citation41 they were excluded from this simulation because the main focus was estimating the overall treatment effect using the three approaches. The model included a random intercept and random slope, was fitted using an ML approach, and used an unstructured covariance.
The MI and IPW missingness models included all of the variables in the analysis model, as well as those used to generate the missing data. For exploratory simulations, two more PROMs collected in the trial, the EuroQol 5 Dimension 3 Level questionnaire (EQ-5D-3L)Citation47 and 12-Item Short Form Health Survey (SF-12) physical component score,Citation48,Citation49 were also included. Both were assumed to be fully observed. Missing composite scores were replaced with values obtained from a single imputation. Imputations for each time point were based on relevant baseline data and available OKS, SF-12, and EQ-5D follow-up data. The IPW missingness model included the composite PROM scores at baseline and 5-year follow-up. The MI model used all of the baseline and follow-up PROM scores.
Imputations were run separately by treatment arm.Citation24,Citation50 MI used MICE and a predictive mean matching approach. For the IPW approach, the missingness model was used to estimate the probability of missing follow-up data for each participant, using a logistic regression model with the outcome variable indicating if any follow-up data were missing. The inverse of this probability was used as the weight in the IPW analysis model (subject-specific weight), which used only cases with completely observed OKS outcome data.
The MI and IPW approaches were analyzed by using the same multilevel mixed-effects regression model described above, except that the MI approach analyzed the imputed data, and the IPW approach analyzed the complete-cases subset using subject-specific weights to account for missing data.
The Stata commands “mixed” and “mi impute” were used to implement the statistical models.
Ethics approval
Approval for the KAT study was obtained from the Multi-Research Ethics Committee for Scotland (research protocol MREC/98/0/100 – November 1998, ISRCTN45837371) and from the Local Research Ethics Committees at each study site recruiting participants. All the participants gave written informed consent prior to being included in the study. No additional ethics approval was required for the performance of this simulation study.
Results
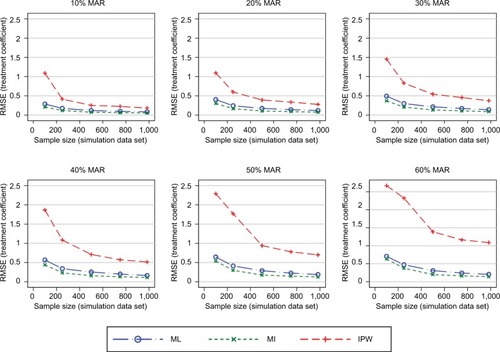
In general, the results consistently showed that the RMSE (and MAE) increased with increasing proportions of missing data and decreasing sample sizes (–). The graphs presented in these figures show the RMSE and SE results, while the MAE results are presented in the Supplementary materials. For clarity, separate plots are provided for the different proportions of missing data.
Figure 3 RMSE of the estimated treatment coefficient using the observed missing data pattern.
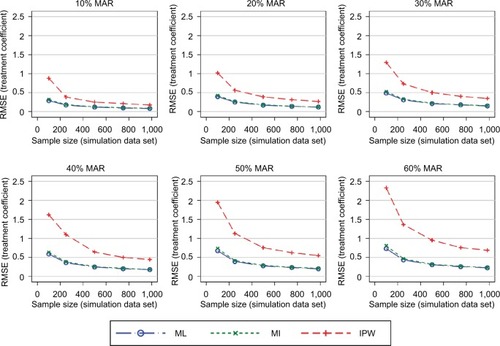
Figure 4 RMSE of the estimated treatment coefficient adding the SF-12 and EQ-5D-3L to the MI and IPW models.
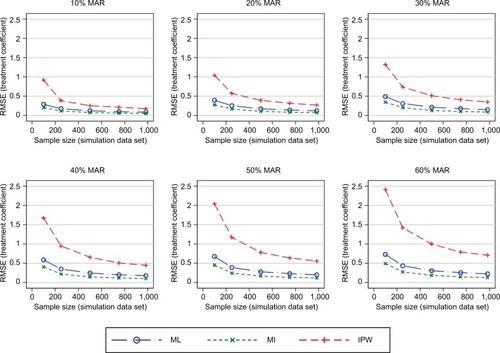
Figure 5 RMSE of the estimated treatment coefficient – considering dropouts only while also using the SF-12 and EQ-5D-3L as auxiliary variables in the MI and IPW models.
Feasibility of the analysis approaches
The ML approach could obtain valid results in all simulation scenarios. A negligible proportion of the MI models did not converge. Valid results could not be obtained for ~20% of the IPW simulations for a sample size of 100 with 10% missing data, ~3% for a sample size of 100 with 20% missing data, and ~1% for a sample size of 250 with 10% missing data. Very low proportions of invalid results were observed for the remaining simulations for a sample size of 100.
Performance of the different analysis approaches
The first simulation scenario considered the observed patterns of missing data. shows the RMSEs introduced into the treatment effects. The ML and MI approaches performed very similarly, irrespective of the sample size or proportion of missing data. The IPW approach consistently resulted in worse RMSEs compared with the ML and MI approaches. The difference between the performance of the IPW approach and of the ML and MI approaches was more pronounced for smaller sample sizes. The same patterns were observed when using the MAE as a performance measure (see the Supplementary materials).
presents the SEs for the treatment effects. The ML and MI approaches produced SEs that were very similar to the true SEs. The IPW approach produced elevated SEs, particularly under scenarios with both higher proportions of missing data and smaller sample sizes.
Figure 6 SE of the estimated treatment coefficient using the observed missing data pattern.
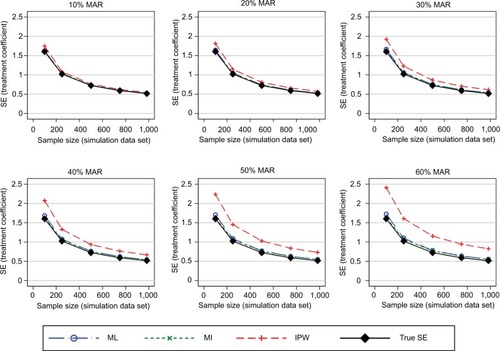
Similar patterns for all three performance measures were observed for the three approaches for handling missing data under the “stronger MAR” scenario (see the Supplementary materials).
Further simulations added more PROM follow-up data (SF-12 and EQ-5D-3L) into the MI and IPW models. The MI approach introduced smaller RMSEs into the treatment effects compared with the ML approach when the original missing data pattern (a mixture of intermittent and monotone missingness) was maintained. The IPW approach introduced similar RMSEs in this and the previous simulations (). When considering a scenario with only monotone missingness, the differences in the RMSEs introduced by the MI approach decreased marginally, particularly for large proportions of participants with missing follow-up data (), compared with intermittent missing data patterns. IPW produced greater errors than the other approaches.
The MAE in the estimated treatment effects was also used to measure the performance of the three approaches when handling missing data. The results for the MAE (shown in the Supplementary materials) were consistent with those presented above for the RMSE. Estimates of the SE of the treatment effects remained consistent across the simulation scenarios considered.
Discussion
This paper aimed at comparing the performance of the three approaches for analyzing longitudinal PROMs with some missing data: ML, MI, and IPW. These approaches are all well established and straightforward to implement using standard statistical software.
The simulation results obtained from ML and MI were very similar under MAR, when the MI model took into account baseline data, data collected early in the trial, and the relevant outcome scores. These results agree with the existing literature.Citation34,Citation50 However, when the MI model included additional auxiliary variables collected over the follow-up period of the study, MI performed better than ML. This is an important finding as RCTs commonly collect information on a number of different PROMs, as well as clinical information such as clinical assessments, readmissions, and complications. This information should be used in MI models, where appropriate. Using auxiliary variables can also make the MAR assumption, on which all these three approaches rely, more plausible,Citation38 particularly when some missing data are related to a change in health states.Citation51 In such scenarios, MI should be favored over ML.
The MI model including auxiliary variables performed slightly worse with monotone missing data than with intermittently missing data. This finding emphasizes the importance of continued data collection and including all collected data in the analysis.
IPW performed notably worse than its comparators, in terms of both bias and variability around the estimates of the treatment effects. IPW potentially uses only a small subset of the observed outcome data. In line with the current literature, we do not recommend using IPW as implemented here to handle missing longitudinal PROM data in RCTs.Citation52 Some convergence issues were observed for the IPW models for small sample sizes, as the same statistical models were used across all simulation scenarios. Outside the context of a simulation study, models should be tailored to the data available and simplified for smaller sample sizes, as appropriate.
The differences in the performance measures for the three approaches are relatively small. They lie within the measurement error of the PROM and do not exceed its minimal important difference, which have been estimated at 4 and 5 points, respectively.Citation10 These differences are unlikely to be clinically meaningful. However, many trials are powered to detect small differences between treatment arms. For example, the KAT study was powered to detect a 1.5 point difference in the OKS for the patella resurfacing comparison.Citation40 Thus, even these moderate differences can affect trial conclusions; they can be used to derive guidance on which approach for handling missing data to be used.
Limitations
A limited number of missing data scenarios were considered, and the maximum sample sizes were restricted by the number of complete cases in the trial that this simulation study is based on. However, sample sizes ranging from 100 to almost 1,000 participants were deemed representative of the vast majority of RCTs.
Most of the simulations considered the same missing data pattern, a mixture of intermittent and monotone missingness. Missing data patterns are likely to vary between trials and, to a smaller extent, between PROMs. Other patterns of missingness could have been investigated here. However, monotone and intermittently missing data are commonly observed in RCTs, and we believe that the patterns used, as well as the conclusions drawn, are generalizable to a large proportion of RCTs.
The simulation scenarios that added auxiliary PROM data in the MI and IPW approaches assumed that these PROMs were completely observed, which may not have been realistic. However, most RCTs collect information on several PROMs, which are likely to have different completion rates. More resources may be spent on ensuring high completion rates for the primary or key secondary outcome measures, eg, through follow-ups by telephone. It is also possible that RCT participants are more inclined to complete shorter questionnaires or those they consider more relevant to themselves. Different follow-up schedules may be used for different PROMs, and those collected more frequently can be used to make inferences about missing data in other questionnaires. Information on clinical assessments, readmissions, additional treatment, or complications may be less prone to missing data and could be used in imputation models. In short, any available additional postrandomization information should be included in imputation models if deemed appropriate to reduce bias.
The ML, MI, and IPW approaches were implemented as described in the “Methods” section. These specifications were included in this simulation study as they are well established, commonly used by the statistical community, and easily implementable using standard statistical software. Other specifications of these models are possible, but were not considered here. IPW performed worse than ML and MI here, possibly because the IPW approach implemented did not use data from participants with any missing follow-up data. Other implementations of IPW have been suggested, including a stratification approach to account for different missing data patterns, which may be due to differences in patient characteristics; however, this approach is only thought to be appropriate if the number of missing data patterns is small.Citation26 Doubly robust IPW approaches,Citation37 or IPW incorporating some imputations,Citation27,Citation31 have also been suggested as alternatives. However, as the implementations for these approaches are complex and not routinely available in standard statistical software, they did not match the criteria for methods compared here.
The simulation studies presented here are restricted to the KAT study and the OKS. Validation in other PROMs could be beneficial. However, the OKS shares characteristics with many composite-score PROMs: it is used as a continuous score, baseline variables have some predictive ability for the OKS at follow-up, and there is moderate correlation between the OKS and other PROMs collected at follow-up. The results of the simulations using the OKS are thus likely to be generalizable to many other PROMs.
This work did not consider the effect of MNAR mechanisms or misspecifications of the analysis model on the performance of the three approaches. As misspecification and MNAR can occur in a number of ways, the effect of different misspecifications or different MNAR mechanisms may have very different effects on the performance of the three approaches for handling missing data in longitudinal data sets. We therefore avoided general statements about the performance of the investigated analysis approaches that may not be applicable to all MNAR and misspecification scenarios, which could lead to underestimating the bias introduced through missing data. The effects of MNAR scenarios should be investigated for all analyses on incomplete data in appropriate sensitivity analyses, as recommended in the literature.Citation29,Citation51,Citation53–Citation55
Conclusion
This simulation study directly compared the performances of ML, MI, and IPW in handling incomplete PROM data in a longitudinally collected data set from an RCT. The IPW model performed worse than the ML and MI approaches, introducing greater RMSE and MAE. It should therefore not be used for the analysis of similar small RCT data sets, especially when some missing outcome data are observed for ≥30% of participants.
ML and MI perform similarly under MAR when no additional follow-up data are available. However, if auxiliary PROMs have been more completely observed during followup than the PROM of primary interest, or other postrandomization data are available, then MI performs better and should be favored over non-imputation-based ML approaches. As both approaches assume an MAR mechanism, additional sensitivity analyses considering MNAR scenarios should be conducted to supplement the primary analysis.
Availability of data and materials
The data used for this simulation work were collected as part of the KAT study. As the authors obtained permission to use the data for prespecified analyses and simulation studies performed as part of Ines Rombach’s doctoral thesis, the data set cannot be made publicly available. Data requests should be directed to the trial coordinating office, the Health Services Research Unit at the University of Aberdeen. The simulation work was performed in Stata and is available from the corresponding author upon request.
Acknowledgments
We are very grateful to the KAT study group for providing data for this methodological work. We recognize the contributions of all of the KAT investigators, collaborators, and those who coordinated the KAT study. We also thank all of the trial participants and the National Institute for Health Research – Health Technology Assessment who funded the KAT. We acknowledge English language editing by Jennifer A de Beyer.
This research is part of Ines Rombach’s doctoral thesis, and financial support was provided entirely by a Medical Sciences Graduate School Studentship from the Medical Research Council and the Department of Population Health, University of Oxford (Grant Number: MR/J500501/1).
This work was previously presented in the following conferences: 1) Rombach I, Gray AM, Jenkinson C, Rivero-Arias O. To impute or not to impute? A comparison of statistical approaches for analyzing missing longitudinal patient reported outcome data in randomized controlled trials. PROMs Research Conference; June 2017; Oxford, UK. 2) Rombach I, Gray AM, Jenkinson C, Rivero-Arias O. A comparison of statistical approaches for analyzing missing longitudinal patient reported outcome data in RCTs. 4th International Clinical Trials Methodology Conference (ICTMC) and the 38th Annual Meeting of the Society for Clinical Trials (SCT); May 2017; Liverpool, UK.
Disclosure
All authors are employed by the University of Oxford. The funding agreement ensured the authors’ independence in designing the study, interpreting the data, and writing and publishing the report. The authors report no other conflicts of interest in this work.
References
- BellMLFieroMHortonNJHsuCHHandling missing data in RCTs; a review of the top medical journalsBMC Med Res Methodol20141411825407057
- RombachIRivero-AriasOGrayAMJenkinsonCBurkeOThe current practice of handling and reporting missing outcome data in eight widely used PROMs in RCT publications: a review of the current literatureQual Life Res20162571613162326821918
- BeunckensCMolenberghsGKenwardMGDirect likelihood analysis versus simple forms of imputation for missing data in randomized clinical trialsClin Trials20052537938616315646
- MallinckrodtCHClarkSWCarrollRJMolenberghGAssessing response profiles from incomplete longitudinal clinical trial data under regulatory considerationsJ Biopharm Stat200313217919012729388
- WhiteIRMoodieEThompsonSGCroudaceTA modelling strategy for the analysis of clinical trials with partly missing longitudinal dataInt J Methods Psychiatr Res200312313915012953141
- BellMLFaircloughDLPractical and statistical issues in missing data for longitudinal patient-reported outcomesStat Methods Med Res201423544045923427225
- PatrickDLBurkeLBPowersJHPatient-reported outcomes to support medical product labeling claims: FDA perspectiveValue Health200710Suppl 2S125S13717995471
- JenkinsonCMorleyDPatient reported outcomesEur J Cardiovasc Nurs201615211211326678271
- KaziAMKhalidWQuestionnaire designing and validationJ Pak Med Assoc201262551451622755326
- BeardDJHarrisKDawsonJMeaningful changes for the Oxford hip and knee scores after joint replacement surgeryJ Clin Epidemiol2015681737925441700
- DawsonJRogersKFitzpatrickRCarrAThe Oxford shoulder score revisitedArch Orthop Trauma Surg2009129111912318183410
- LohrKNZebrackBJUsing patient-reported outcomes in clinical practice: challenges and opportunitiesQual Life Res20091819910719034690
- FieldingSMaclennanGCookJARamsayCRA review of RCTs in four medical journals to assess the use of imputation to overcome missing data in quality of life outcomesTrials200895118694492
- GomesMGutackerNBojkeCStreetAAddressing missing data in patient-reported outcome measures (PROMS): implications for the use of PROMS for comparing provider performanceHealth Econ201625551552825740592
- IbrahimJGMolenberghsGMissing data methods in longitudinal studies: a reviewTest (Madr)200918114321218187
- EndersCKAnalyzing longitudinal data with missing valuesRehabil Psychol201156426728821967118
- VerbekeGFieuwsSMolenberghsGDavidianMThe analysis of multivariate longitudinal data: a reviewStat Methods Med Res2014231425922523185
- FariaRGomesMEpsteinDWhiteIRA guide to handling missing data in cost-effectiveness analysis conducted within randomised controlled trialsPharmacoeconomics201432121157117025069632
- PowneyMWilliamsonPKirkhamJKolamunnage-DonaRA review of the handling of missing longitudinal outcome data in clinical trialsTrials20141523724947664
- MallinckrodtCHSangerTMDubeSAssessing and interpreting treatment effects in longitudinal clinical trials with missing dataBiol Psychiatry200353875476012706959
- LachinJMFallacies of last observation carried forward analysesClin Trials201613216116826400875
- EekhoutIde BoerRMTwiskJWde VetHCHeymansMWMissing data: a systematic review of how they are reported and handledEpidemiology201223572973222584299
- LangKMLittleTDPrincipled missing data treatmentsPrev Sci201819328429427040106
- WhiteIRRoystonPWoodAMMultiple imputation using chained equations: issues and guidance for practiceStat Med201130437739921225900
- KenwardMGLesaffreEMolenberghsGAn application of maximum likelihood and generalized estimating equations to the analysis of ordinal data from a longitudinal study with cases missing at randomBiometrics19945049459537787007
- DoidgeJCResponsiveness-informed multiple imputation and inverse probability-weighting in cohort studies with missing data that are non-monotone or not missing at randomStat Methods Med Res201827235236326984909
- SeamanSRWhiteIRReview of inverse probability weighting for dealing with missing dataStat Methods Med Res201322327829521220355
- LittleRJARubinDBStatistical Analysis with Missing Data2nd edHoboken, NJJohn Wiley & Sons2002
- MallinckrodtCHLanePWSchnellDPengYMancusoJPRecommendations for the primary analysis of continuous endpoints in longitudinal clinical trialsDrug Inf J2008424303319
- CarpenterJRKenwardMGMultiple Imputation and Its Application1st edChichesterJohn Wiley & Sons2013
- SeamanSRWhiteIRCopasAJLiLCombining multiple imputation and inverse-probability weightingBiometrics201268112913722050039
- van BuurenSMultiple imputation of discrete and continuous data by fully conditional specificationStat Methods Med Res200716321924217621469
- RubinDMultiple Imputation for Nonresponse in SurveysNew York, NYWiley & Sons1987
- KenwardMGCarpenterJMultiple imputation: current perspectivesStat Methods Med Res200716319921817621468
- FieldingSFayersPRamsayCRAnalysing randomised controlled trials with missing data: choice of approach affects conclusionsContemp Clin Trials201233346146922265924
- MansourniaMAAltmanDGInverse probability weightingBMJ2016352i18926773001
- CarpenterJRKenwardMGVansteelandtSA comparison of multiple imputation and doubly robust estimation for analyses with missing dataJ R Stat Soc Ser A Stat Soc20061693571584
- WhiteIRKalaitzakiEThompsonSGAllowing for missing outcome data and incomplete uptake of randomised interventions, with application to an Internet-based alcohol trialStat Med201130273192320721948462
- StataCorpStata Statistical Software: Release 14College StationTX: StataCorp LP2015
- KAT Trial GroupJohnstonLMacLennanGMcCormackKRamsayCWalkerAThe Knee Arthroplasty Trial (KAT) design features, baseline characteristics, and two-year functional outcomes after alternative approaches to knee replacementJ Bone Joint Surg Am2009911134141
- MurrayDWMacLennanGSBreemanSA randomised controlled trial of the clinical effectiveness and cost-effectiveness of different knee prostheses: the Knee Arthroplasty Trial (KAT)Health Technol Assess201418191235viiviii
- DawsonJFitzpatrickRMurrayDCarrAQuestionnaire on the perceptions of patients about total knee replacementJ Bone Joint Surg Br199880163699460955
- MurrayDWFitzpatrickRRogersKThe use of the Oxford hip and knee scoresJ Bone Joint Surg Br20078981010101417785736
- Van BuurenSBrandJPLGroothuis-OudshoornCGRubinDBFully conditional specification in multivariate imputationJ Stat Comput Simul2006761210491064
- YuLMBurtonARivero-AriasOEvaluation of software for multiple imputation of semi-continuous dataStat Methods Med Res200716324325817621470
- SimonsCLRivero-AriasOYuLMSimonJMultiple imputation to deal with missing EQ-5D-3L data: Should we impute individual domains or the actual index?Qual Life Res201524480581525471286
- OemarMOppeMEQ-5D-3L User Guide – basic information on how to use the EQ-5D-3L instrument, Version 5.02013 Available from: http://www.euroqol.org/fileadmin/user_upload/Documenten/PDF/Folders_Flyers/EQ-5D-3L_UserGuide_2013_v5.0_October_2013.pdfAccessed October 1, 2014
- JenkinsonCLayteRDevelopment and testing of the UK SF-12 (short form health survey)J Health Serv Res Policy199721141810180648
- JenkinsonCLayteRJenkinsonDA shorter form health survey: can the SF-12 replicate results from the SF-36 in longitudinal studies?J Public Health Med19971921791869243433
- SullivanTRWhiteIRSalterABRyanPLeeKJShould multiple imputation be the method of choice for handling missing data in randomized trials?Stat Methods Med Res Epub2016 11
- GrahamJWMissing data analysis: making it work in the real worldAnn Rev Psychol20096054957618652544
- HortonNJKleinmanKPMuch ado about nothing: a comparison of missing data methods and software to fit incomplete data regression modelsAm Stat2007611799017401454
- EekhoutIEndersCKTwiskJWde BoerMRde VetHCHeymansMWIncluding auxiliary item information in longitudinal data analyses improved handling missing questionnaire outcome dataJ Clin Epidemiol201568663764525724894
- CornishRPTillingKBoydADaviesAMacleodJUsing linked educational attainment data to reduce bias due to missing outcome data in estimates of the association between the duration of breastfeeding and IQ at 15 yearsInt J Epidemiol201544393794525855709
- PermuttTSensitivity analysis for missing data in regulatory submissionsStat Med201635172876287926567763