
Abstract
Aim: Surface tension of biological fluids can be influenced by changes in oligomerization or aggregation of surfactant peptides or proteins. Amphiphilic peptides of amyloid-β or other amyloidogenic peptides/proteins display properties of surfactants, oligomerization and aggregation increase also their fluorescence intensity compared with native structures. Results/methodology: We estimated surface tension and native/ThioflavinT-based/intrinsic amyloid fluorescence intensity in serum and cerebrospinal fluid samples for their evalution as diagnostic biomarkers for Alzheimer´s disease (AD). Discussion/conclusion: Our results indicate that values of surface tension are not a suitable biomarker for AD. However, the ratio of ThioflavinT-based fluorescence to intrinsic amyloid fluorescence in cerebrospinal fluid appears to be an acceptable supportive diagnostic biomarker for AD (its sensitivity was 61.1%, and the specificity 70.8% when compared with aged controls).
Human biological fluids, such as blood plasma, serum or cerebrospinal fluid (CSF), serve as the major biological samples for laboratory and clinical diagnostics. Plasma is the liquid portion of the blood without any blood cells, and serum is the plasma from which clotting proteins, including fibrinogen, have been removed. Serum contains dissolved proteins (albumins, various globulins), electrolytes (Na+, Ca2+, Cl-) and other biologically active compounds (glucose, lipids, hormones) [Citation1]. The chemical composition of CSF is regulated by the peripheral blood circulation, and therefore is similar to that of blood serum. CSF consists of 90% water, 10% solid residues and traces of inorganic and organic compounds; nevertheless, the protein content of CSF is 200–400-times lower than that of serum [Citation2,Citation3]. Since CSF is in direct contact with the environment of the CNS, any changes in biochemical composition of the brain are predominantly reflected in CSF [Citation2,Citation4]. Therefore, it is reasonable to suggest that diagnosis of diseases involving impairments of the CNS should be based on the analysis of CSF rather than plasma or serum.
Biological fluids are comprised of various proteins and lipids that are capable of adsorption at fluid interfaces. These low- and high-molecular weight surfactants control surface tension (ST), which is defined as the energy of the surface at any interface. ST of biological fluids is dependent on many variables, such as their composition, temperature, time of measurement or material of the apparatus. When a new surface is being formed, surface active chemicals diffuse to the surface and align. During this process, the ST is changing rapidly and continuously, which can be tracked by dynamic ST measurements. When the process reaches equilibrium, static ST is obtained by measuring the maximum force at an interface on a particular sample [Citation3,Citation5]. With regard to peptides and proteins, accessible experimental data can be summarized as follows: small spacers (natural amino acid sequences with a coiled structure acting as linkers between domains) show negligible effects on the dynamic and static properties of the surface. However, spacers play an important role in the aggregation properties of surfactants. Longer hydrophobic chains improve the equilibrium surface activities but tend to take longer to reach meso-equlibrium. Longer hydrophilic chain lengths increase the solubility of the surfactant and provide more free molecules in solution, which lead to a more rapid interfacial adsorption but limits the efficiency of the surfactant. iii) Polydispersed hydrophilic groups provide better packing at the interface and improve the static surface activites. An increased number of hydrophilic chains on a single core decreases the static surface activity, but increases the dynamic behavior. The inclusion of hydrophilic groups, which bind to the aqueous phase by hydrogen bonding, such as with sugars, helps to disrupt water at the interface, causing higher static surface activity but also slowing the dynamics [Citation6–8].
It has been suggested that changes in the ST of biological fluids are characteristic for some diseases, including neurological disorders [Citation2,Citation3,Citation5]. The brains of individuals with neurodegenerative Alzheimer´s disease (AD) are characterized by the presence of extracellular plaques containing predominantly aggregated amyloid-β (Aβ) peptides and intracellular tanglets containing aggregated protein τ [Citation9–11]. Aggregation and/or brain accumulation of Aβ 1–42 is reflected in CSF and also partly in serum [Citation4]. It is known that amphiphilic Aβ peptides display surfactant properties [Citation9,Citation10] and that the ST of biological fluids can be influenced by either concentrations of peptides or proteins [Citation3,Citation12] or by their ability to change conformations and oligomerize or aggregate [Citation9,Citation10]. Namely, for example, Aβ 1–42 contains the hydrophilic N-terminal domain (residues 1 to 28) and the hydrophobic C-terminal domain (residues 29 to 42) [Citation11]. This amphipathic organization affects the biochemical properties of peptide and leads to a number of properties associated with surfactants. A classical property of surfactants is the ability to lower the ST of water due largely to the ordering of the amphiphile at the air–water interface with the hydrophobic moiety oriented away from the aqueous phase. Any changes in physicochemical factors (e.g., peptide or protein concentration, pH, temperature and salt ions), which affect structural stability and conformation can alter the ST of solutions at the air/water interface [Citation3,Citation9–12]. During oligomerization and subsequent fibrillization, the more hydrophobic structures are formed which also results in lowering of ST of water. Several authors suggest that the structure of Aβ peptides or of other amyloidogenic peptides of proteins (e.g., insulin or lysozyme) have the same type of amphipatic organization as detergent molecules and that the similar principles that govern micelle formation may also apply to proteins aggregation and amyloid fibril self-assembly. It has been shown that amyloid aggregation of peptides and proteins is correlated with the formation of hydrophobic environment that excludes water. During fibrillization process the hydrophobic areas of proteins are exposed to the environment and therefore the hydrophobicity of protein aggregates is much higher that one observed for native protein [Citation9,Citation10,Citation13–15].
Fluorescent substances occur naturally in the body, such as aromatic amino acids within proteins, which can influence native fluorescence (NF) signals from biological fluids. Aβ contains four aromatic amino acids (Phe4, Phe19, Phe20 and Tyr10); however, intrinsic fluorescence signals are very low, especially in its momomeric form. But under suitable experimental conditions, ThioflavinT-based fluorescence (ThTF) [Citation16,Citation17] is used to monitor misfolded peptide or protein aggregates of β-sheet-rich structures called amyloids. When dye binds to amyloids, it displays enhanced fluorescence with a characteristic emission spectrum (λ emission from 450 to 550 nm, with a maximum at approximately 485 nm) upon excitation at 440 nm. However, dye binding is not fully specific for amyloids, since the dye can also bind to small oligomers, unaggregated substances with a high β-sheet content or substances containing non-β-sheet cavities, and not all β-sheet-rich structures are able to induce fluorescence [Citation18]. Oligomers of Aβ 1–42 contain nanomolar-affinity binding sites for ThT, with a binding capacity similar to fibrils [Citation19]. Our previous experiments revealed significant positive correlations between age and levels of natural fluorescent substances characterized by NF signals or ThTF signals in CSF samples of non-demented controls. Although both signals were increased in AD patients, statistical significance was reached only in comparison with young controls; therefore, these were deemed unsuitable biomarkers for AD [Citation20,Citation21]. Conversely, other studies have reported significantly increased fluorescence signals from amyloidogenic peptides and proteins without extrinsic labelling, when extensive β-sheets are formed or specific experimental conditions are applied (λ excitation near 355 nm and λ emission near 440 nm, [Citation17]). It is suggested that this so-called intrinsic amyloid fluorescence (IAF) could be based on the formation of intermolecular di- and tri-tyrosine cross-links [Citation22]. IAF has not yet been evaluated as a possible biomarker for AD.
The aims of the present study are to estimate the ST values and NF/ThTF/IAF signals in the serum and CSF of patients with AD and corresponding controls in order to elucidate novel diagnostic biomarkers for AD.
Materials & methods
Participants & serum/CSF sampling
Participants were enrolled at the Department of Neurology, Charles University, Prague. One group of 66 patients provided serum samples and another group of 94 patients underwent lumbar puncture as part of their routine diagnostic work-up, and CSF was collected. The basic characteristics of all participants are shown in . Patients were divided into four groups; nondemented neurological patients presenting with non-inflammatory conditions (polyneuropathy, headache) were used as controls (the first group of young controls, people <65 years; the second group of aged controls, people ≥65 years). The results of routine laboratory examinations of serum and CSF samples of the young controls indicated normal basic findings. The normal status of the aged controls was supported by either cognitive scores in two tests (the Mini-Mental State Examination and the Addenbrooke´s Cognitive Examination Revised [Citation23–25]) or results of routine laboratory examinations (normal basic findings). Moreover, normal concentrations of CSF biomarkers for AD (Aβ 1-42, total and phosphorylated τ) were found [Citation26,Citation27]. The AD patients were subdivided, according to their cognitive and functional status, into patients with mild cognitive impairment due to AD (MCI-AD, the third group) or those with dementia (the last group), in accordance with the literature [Citation28,Citation29]. The diagnosis of AD was supported by cognitive tests and abnormal concentrations of CSF biomarkers for AD (cut-offs were 448 pg/ml for Aβ 1–42, 334 pg/ml for total τ and 57 pg/ml for phosphorylated τ). Blood samples were allowed to clot prior to centrifugation to collect serum. Serum and CSF were centrifuged, aliquoted into 1-ml polypropylene tubes and stored (on average within 1.5 h of sampling) at -80°C. The specimens were thawed immediately before measurement. All experiments were conducted in accordance with the Declaration of Helsinki, and the study was approved by the Ethical Committee of Third Faculty of Medicine, University Hospital Kralovske Vinohrady, in accordance with the Laws 129/2003 and 130/2003 of the Czech Republic. Written informed consent was obtained from all study participants, either personally or by proxy.
Table 1. Characteristics of patients providing serum or cerebrospinal fluid samples.
Methods
ST measurements
Measurements of static ST were performed by the pendant-drop method, which employs digital image analysis of the drop shape using a Theta Lite optical tensiometer. The acquired profile of the measured drop formed inside the thermostatic measuring cell was compared with the profile of the theoretical curve given by the Young–Laplace equation of capillarity. The best fit of the theoretical profile on the experimental drop outline was obtained by the least squares method and was used to calculate the ST. The measured drop profile consists of 32 drop images with 1000 coordinates accumulated within 1 s. The final value of the ST represents the average of ten measurements of the drop profile ± SD. The densities of the serum and CSF samples, necessary for the ST calculation, were measured using a Rudolf Research Analytical DDM 2911 densitometer. The measured density values of the serum and CSF were between 0.9979–0.0021 g.cm-3. The density of samples at top limit of the interval is close to the value of the water density. Since the volume of most samples was insufficient to measure the density of the sample (the volume needed is 1 ml), we used a density of water equal to 0.9989 g.cm-3 to calculate the ST values.
Fluorescence measurements
All measurements of NF, ThTF and IAF signals were performed in a 96-well plate using a Synergy MX (BioTek) spectrofluorometer. NF and IAF were determined immediately, and the intensity of ThTF was measured after a 1 h incubation of the sample with ThT (Sigma-Aldrich); the final concentration of the dye was 20 μM. For NF measurements, the excitation was set at 440 nm and the emission was recorded at 485 nm. The same excitation and emission wavelengths were used for the measurement of ThTF. IAF was determined by excitation at 357 nm and emission at 440 nm [Citation17]. The excitation and emission slits were adjusted to 9.0/9.0 nm and the top probe vertical offset was 6 mm. All fluorescence experiments were performed in triplicate and the final value is the average of the measured values.
ELISA measurements
Levels of Aβ 1-42, total τ and τ phosphorylated at position 181 were estimated in the CSF samples using kits (Innogenetics; now Fujirebio), according to the manufacturer's instructions.
Statistical analysis
Statistical analysis was performed using the BMDP statistical software. Analysis of variance (ANOVA) was applied for global and pooled variance of a Student´s t-test for pairwise comparisons (program 7D). Correlation analysis was also used (program 6D) and the equality of correlation coefficients (Rs) between two groups was examined by a test based on Fisher´s Z-transformation (Z-test) [Citation30]. Sensitivity and specificity using receiver-operating characteristic (ROC) curve analysis were calculated in MS Excel according to the MedCalc statistical software manual [Citation31]. Data in the tables are presented as the mean ± SD.
Results
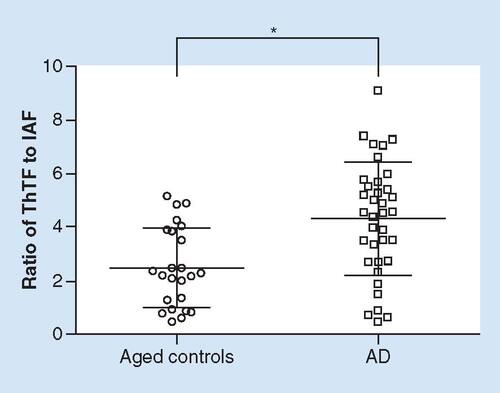
Characteristics of the patients that provided serum (a total of 66 people) and CSF samples (a total of 94 people) are shown in . Results of the ST and fluorescence measurements (ST, NF, ThTF and IAF values in serum and CSF) are shown in . The results of correlation analyses (performed on a portion of the results shown in ) are summarized in , and the best results with respect to novel diagnostic biomarkers for AD obtained in serum (the ratio of ST to IAF) or CSF (the ratio of ThTF to IAF) are shown in . shows a portion of the results seen in (the ratio of ThTF to IAF in CSF in aged controls and AD patients) presented as individual plots.
Table 2. Results of surface tension and fluorescence measurements obtained from serum and cerebrospinal fluid samples.
Table 3. Correlation analysis performed on data from surface tension and fluorescence measurements.
Table 4. Ratios of surface tension values to intrinsic amyloid fluorescence signals in serum and thioflavin T-based fluorescence to intrinsic amyloid fluorescence signals in cerebrospinal fluid.
Individual plots showing part of the data presented in . Fluorescence signals were estimated from cerebrospinal fluid samples of aged controls (n = 24) and AD patients (n = 36). Statistical significance (Student´s t-test) was calculated with respect to aged controls.
AD: Alzheimer's disease; IAF: Intrinsic amyloid fluorescence; ThTF: ThioflavinT-based fluorescence.
*p < 0.010.
In serum, the ST values did not markedly differ between young and aged controls, but were significantly decreased to 95.7% in AD patients when compared with young controls. No significant differences among particular groups were found in NF, ThTF or IAF signals (). In CSF, the ST values were decreased to 98.4% in aged as compared with young patients (t-test p = 0.034, however, results of ANOVA did not indicate statistical significance), but not in the MCI-AD/AD groups. In contrast to serum, ThTF and IAF signals in CSF were significantly changed in the MCI-AD and AD groups; however, again only in comparison with young controls. In particular, an increase in ThTF (to 142.2% in MCI-AD and 130.2% in AD) and a decrease in IAF (to 46.3% in MCI-AD and 58.5% in AD) were found ().
Correlation analyses () revealed four significant links in serum (two positive correlations: between age and ThT or between NF and IAF; two negative correlations: between age and ST or between ST and ThTF) and three significant links in CSF (one positive correlation: between age and ThTF; two negative correlations: between age and IAF or between ST and ThTF) in young controls. The results of the Z-test reveal five significant alterations in correlations in aged when compared with young controls in serum (a shift to a positive correlation between age and NF, a shift from a positive to a mild negative correlation between age and ThTF, a shift to a negative correlation between ST and NF, a shift from negative to a mild positive correlation between ST and ThTF, and finally a shift to a negative correlation between ThTF and IAF). On the other hand, the results of the Z-tests did not reveal significant differences in correlations between young and aged controls in CSF. However, two significant alterations in correlations were found in AD patients in comparison with aged controls in serum (a shift from a positive to a negative correlation between age and NF, a shift from a mild positive to a mild negative correlation between age and IAF) as well as in CSF (a shift to a positive correlation between ST and IAF, a shift to a positive correlation between NF and IAF).
In order to enhance differences among particular groups, we created a ratio of ST values (decreased in the AD group) to IAF values (a trend to the increase in the AD group) in serum. Similarly, we created a ratio of ThTF values (increased in the MCI-AD and AD groups) to IAF values (decreased in the MCI-AD and AD groups) in CSF. The ratio of ST to IAF in serum was decreased to 86.1% in AD patients as compared with young controls (t-test p = 0.021, however, results of ANOVA did not indicate statistical significance, ). On the other hand, the ratio of ThTF to IAF in CSF was significantly increased in AD patients as compared with both young and aged controls (increased to 153.6 and 172.0%, respectively; moreover, differences between AD patients and young or aged controls were statistically significant after Bonferroni correction [ & ]). ROC curve analysis revealed a cut-off value of 3.79 for this ratio (the sensitivity was 61.1% for AD and the specificity was 70.8% in comparison with aged controls).
The levels of Aβ 1–42 and total or phosphorylated τ in CSF obtained from ELISA measurements are shown in . The levels of Aβ 1–42 were significantly decreased in the MCI-AD and AD groups as compared with aged controls (decreased to 49.8% and 54.9%); however those of total and phosphorylated τ were increased (increased to 185.5 and 255.3% or 176.6 and 173.7%, respectively). Correlation analysis among classical CSF biomarkers (Aβ 1-42, total τ and phosphorylated τ) and prospective biomarkers in CSF (ST, NF, ThTF, IAF and the ratio of ThTF to IAF) revealed only one significant link: a negative correlation between Aβ 1–42 and ST was found in the AD patient group (R = -0.333, p = 0.048); however, the Z-test did not support significance in comparison with aged controls (p = 0.089). In addition, the results of correlation analysis supported significant links between Aβ 1–42 and age (R = -0.415, p = 0.044), between total τ and age (R = +0.518, p = 0.010) and finally between total and phosphorylated τ (R = +0.562, p = 0.004) in aged controls. While the above-mentioned links to age were significantly different in AD patients when compared with aged controls (Aβ 1-42: R = +0.302, p = 0.073, Z-test, p = 0.004; total τ: R = -0.093, p = 0.588, Z-test, p = 0.008), the link between total and phosphorylated τ was not altered (Z-test p = 0.302).
Table 5. Levels of Aβ 1–42, τ and phosphorylated τ in cerebrospinal fluid.
Discussion
Our results support studies suggesting that the diagnosis of AD, associated with amyloidogenic peptides and proteins, should be based on the analysis of CSF rather than serum [Citation4]. Firstly, changes in amyloidogenic peptides and proteins characteristic of AD were better reflected in CSF (brain accumulation) than in serum isolated from peripheral blood (). Second, age-dependent changes in amyloidogenic peptides and proteins, particularly in serum, complicated the evaluation of novel biomarkers for AD (there were significant antagonistic links in correlations between age and certain evaluated biomarkers in aged controls and the AD patient group; ). It is therefore not surprising that we found only one acceptable biomarker, the ratio of ThTF to IAF signals, in only the CSF samples ( & ). In addition, our results suggest that ThTF and IAF signals may reflect different amyloid structures, in accordance with the literature [Citation18,Citation19]. ThTF signals appear to be based on oligomers as well as aggregates and changes in ThTF due to AD in CSF are more similar to those in total Aβ, where trends toward a mild increase have been observed [Citation4,Citation32]. IAF signals seem to be based especially on amyloid aggregates and changes in IAF due to AD in CSF are more similar to those observed in Aβ 1-42, where significant decreases have been repeatedly found [Citation4,Citation33,Citation34]. Our present data are summarized below in more detail.
Surfactant peptides & proteins characterized by the ST values, the influence of age & comparison with fluorescence signals or classical biomarkers
Despite great promise [Citation2,Citation3,Citation5], ST values in serum have been shown to be an unsuitable biomarker for AD. In particular, a decrease to 95.7% in AD patients is not very robust and is significant only in comparison with young controls. ST values in CSF are not a suitable biomarker for AD either, since these values are unchanged in the MCI-AD and AD patient groups when compared with both control groups (). Correlation analyses performed on data in serum () revealed a significant negative correlation between age and ST values, in accordance with reported age-dependent changes in dynamic ST [Citation1]; however, this was only seen in young controls (nondemented patients, 30–65 years of age). The negative correlation was weakened in aged controls (no significant change in serum ST values between young and aged controls) and even tended toward a positive correlation in the AD patient group (Z-test between young controls and AD patients p < 0.001). On the contrary, correlation analysis did not reveal similar differences among particular groups in CSF (); thus, supporting advantages for measurements being made in CSF rather than in serum.
The changes in surfactant peptides and proteins, characterized by a decrease in the ST values in aged controls (CSF, significant result only by t-test) or in AD patients (serum), are believed to be similar to those observed in amyloidogenic peptides and proteins during longer incubations in vitro, and likely represent alterations in their conformations via increased hydrophobic content of the structure [Citation13–15]. A comparison of the ST values with certain fluorescence signals () or classical biomarkers (, Results) revealed the following links. First, significant negative correlations between ST values and ThTF signals in both the serum and CSF of young controls support a role for oligomerization (rather than for aggregation since correlations between ST and IAF are not significant) among surfactant peptides and proteins, in accordance with data in the literature [Citation15,Citation16]. This is well conserved in CSF, but surprisingly significantly weakened in the serum of aged healthy patients and AD patients (Z-test between young and aged controls p = 0.015; Z-test between young controls and AD patients p = 0.005). The results in the serum can be interpreted as an attenuated role of oligomers among surfactant peptides and proteins (see also an insignificant reduction in ThTF signals to 94.8% in AD patients as compared with aged controls; ), in agreement, for example, with the observed lower levels of τ oligomers in the serum of the MCI-AD group [Citation35]. It has been suggested that the decrease in serum oligomers could be the result of impaired clearance from the interstitium to the blood and consequent accumulation in the AD brain [Citation35,Citation36]. Secondly, correlation analyses did not reveal significant links between ST values and naturally fluorescent substances, as characterized by NF signals, or between ST values and amyloidogenic peptides and proteins with extensive β-sheet formation, as characterized by IAF signals, in either the serum or CSF of young controls. However, naturally fluorescent substances, including peptides and proteins containing aromatic amino acids, and amyloid aggregates appear to play a more important role among surfactants in both the serum and CSF during normal aging and AD (there are many significant correlations between ST values and NF/IAF signals () or between those and levels of Aβ 1–42 [Results]). Moreover, differences between serum and CSF (negative correlations between ST and IAF in the serum of aged and AD patients, but a significant positive correlation in the CSF of AD patients; ) can be interpreted as accumulation of amyloid aggregates in the AD brain, which is better reflected in CSF than in serum.
Comparison of NF, ThTF & IAF signals
Separate NF, ThTF and IAF signals in serum are unsuitable biomarkers for AD, as shown in our previous studies based on NF and ThTF measurements [Citation20,Citation21]. Here, we found no significant differences among groups (), and detailed analyses revealed significant antagonistic trends in correlations between age and NF/IAF signals in aged controls and the AD group (). Separate fluorescence signals in CSF are also unsuitable biomarkers of AD. Although we observed pronounced changes in ThTF values (increases to 142.2% in the MCI-AD and 130.2% in the AD group) or IAF values (decreases to 46.3 and 58.5%, respectively), the results were statistically significant only when compared with young nondemented controls. On the other hand, detailed analysis of CSF data revealed no significant antagonistic trends in correlations between age and fluorescence signals in the aged control and AD groups, supporting the above-mentioned advantages of CSF analyses.
Results of correlation analyses did support direct links among fluorescence signals (). First, we observed differences between serum and CSF in relation to NF and ThTF signals (a negative correlation in serum of the AD group and two positive correlations in CSF of the aged controls and AD patients). The results are difficult to interpret; however, these correlations are likely due to a weakened role of serum oligomers (above-mentioned findings with respect to ST values), an increasing role of CSF oligomers and an accumulation of aggregates in the brain of AD patients. Secondly, we found significant positive correlations between naturally fluorescent substances, as characterized by NF signals, and amyloidogenic peptides and proteins with extensive β-sheets, as characterized by IAF signals, in serum from all groups, indicating that NF signals may partly reflect intrinsic fluorescence of serum peptides and proteins containing aromatic amino acids, including Aβ itself, better than previously expected. In CSF, however, the mild negative correlations between NF and IAF signals in both control groups, but the significant shift to a marked positive correlation in AD patients, suggests that NF signals in CSF may reflect intrinsic fluorescence of peptides and proteins with aromatic amino acids, exclusively in AD. This corresponds well with the findings that NF signals are much more intense in serum than in CSF (), and that the content of peptides and proteins in CSF is 200–400 times lower than in serum [Citation2,Citation3]. Finally, we revealed significant negative correlations between ThTF and IAF signals in the serum of aged controls and AD patients, but no marked links in CSF (). When comparing data in and , our interpretation is as follows: in relatively young nondemented people (persons aged 30–65 years), the total levels of serum oligomers are likely higher than those of serum aggregates (the ratio of ThTF to IAF is 3.02), but are more similar in CSF (the ratio equals 1.34; ), which may be explained by the fact that small oligomers are more easily detected in serum than in CSF (see increased content of peptides and proteins in serum as compared with CSF [Citation2,Citation3]). iIn serum of aged nondemented controls (people older than 65 years), there were trends toward mild increases, especially of oligomers (changes to 114.4% in ThTF and only 105.5% in IAF signals). Conversely, trends observed in CSF (compare changes to 115.4% in ThTF and 89.4% in IAF signals) suggest the beginning of enhanced aggregation and possible accumulation of amyloidogenic peptides and proteins in the brains of aged patients, which is better reflected in CSF, in accordance with the literature [Citation4]. And finally, in AD patients, as compared with aged non-demented controls, data support an increasing role of aggregates but an attenuated role of oligomers, especially in serum (changes to 94.8% in ThTF and 107.3% in IAF signals; changes in serum ST values). Conversely, the increased oligomeriziation and aggregation/accumulation in the brain is reflected in the CSF of AD patients (changes to 112.8% in ThTF and 65.5% in IAF signals). Moreover, the changes appear to begin very early (MCI-AD vs. AD groups; ).
Ratios of ST & IAF signals in serum and ThTF to IAF signals in CSF as biomarkers for AD
With respect to novel diagnostic biomarkers for AD, the ratio of ST values to IAF signal in serum and that of ThTF to IAF signals in CSF gave the best results in the present study (). Nevertheless, the ratio of ST to IAF in serum is not a suitable biomarker for AD. Although the values were decreased to 86.1% in the AD group, the significance level by t-test is only reached when compared with young controls. Conversely, the ratio of ThTF to IAF signals in CSF ( & ) appears to be an acceptable diagnostic biomarker for AD (significant increase to 153.6% in comparison with young controls and 172.0% in comparison with aged controls). Moreover, no differences between MCI-AD and AD patients in ThTF and IAF signals () suggest that the ratio is sensitive to early stages of disease. Sensitivity of the biomarker for AD was 61.1%, and the specificity reached 70.8% in comparison with aged controls. We propose that the ratio of ThTF to IAF signals in CSF, reflecting age- and disease-dependent oligomers and aggregates rate, may prove to be a relatively cheap and easily accessible diagnostic biomarker for AD. Nevertheless, the ratio can be used only as a supportive biomarker in combination with another biomarker (sensitivity >85% and specificity >75-85% are generally expected in the case of a good biomarker).
With respect to potential AD biomarkers in blood cells as the most easily accessible cell types, our results based on amyloidogenic peptides and proteins support hypothesis that plasma or serum Aβ levels reflect peripheral Aβ generation more than they reflect brain pathology in AD [Citation37]. On the other hand, it is correct to note that the recent research based, for example, on total τ, mikroRNAs, mitochondrial enzymes or chemical elements indicates that blood or even nonivasive samples as urine or saliva can be a promising source for AD biomarkers [Citation37–40].
Conclusion
Despite great promise, ST values in serum or CSF have been shown to be an unsuitable biomarker for AD. Conversely, the ratio of ThTF to IAF signals in CSF, reflecting oligomers to aggregates rate, appears to be an acceptable diagnostic biomarker for AD, however, only as a supportive biomarker in combination with other biomarkers. We can recommend fluorescence intensity measurements for AD diagnossisince it is a relatively cheap and easily accessible approach.
Introduction
Human biological fluids, such as blood serum or cerebrospinal fluid (CSF), serve as the major biological samples for laboratory and clinical diagnostics.
Changes in the surface tension (ST) of biological fluids are characteristic for some diseases including neurological disorders.
Amphiphilic amyloid-β peptides and other amyloidogenic peptides/proteins display surfactant properties and ST of biological fluids can be influenced by either concentrations of peptides/proteins or by their ability to change conformations and to oligomerize or aggregate.
Oligomerization or aggregation of amyloidgenic peptides/proteins also increase their fluorescence intensity compared with native structures.
Methods
We estimated the ST values and native/ThioflavinT-based/intrinsic amyloid fluorescence (IAF) intensity signals in the serum and CSF of patients with Alzheiemer´s disease and corresponding controls in order to elucidate novel diagnostic biomarkers.
We used Theta Lite optical tensiometer and 96-well plate Synergy MX spectrofluorometer.
Results
Values of the ST are not a suitable diagnostic biomarker for Alzheimer´s disease (AD).
The ratio of ThioflavinT-based to IAF in CSF is significantly increased in patients with AD compared with aged controls.
The ratio of ThioflavinT-based to IAF in CSF probably reflect that of oligomers to aggregates.
Conclusion
The ratio of ThioflavinT-based to IAF in CSF appears to be a acceptable supportive diagnostic biomarker for AD.
We can recommend fluorescence intensity measurements here since it is a relatively cheap and easily accessible approach.
Ethical conduct of research
All subjects gave written informed consent regarding study participation, in accordance with the Declaration of Helsinky. The Ethics Committee of the Third Faculty of Medicine, Charles University in Prague approved the study.
Financial & competing interests disclosure
In Slovakia, the study was supported by VEGA 2/0145/17, COST project 083/14 action BM1405 (MVTS), SAS-MOST JRP 2015/5 and EU project 6220120033. We would like to thank Dagmar Sedlakova (Institute of Experimental Physics, SAS, Kosice, Slovakia) for technical assistance. In the Czech Republic, the study was supported by GACR (P304-12-G069), AZV (16-27611A) and NPU I (LO1611) projects. Moreover, NV18-07-00272 and PROGRES Q 35 projects supported this study in the Czech Republic. The authors have no other relevant affiliations or financial involvement with any organization or entity with a financial interest in or financial conflict with the subject matter or materials discussed in the manuscript apart from those disclosed.
No writing assistance was utilized in the production of this manuscript.
Additional information
Funding
References
- Zaitsev S . Dynamic surface tension measurements as general approach to the analysis of animal blood plasma and serum. Adv. Colloid Interface Sci.235, 201–213 (2016).
- Kazakov VN , VozianovAF, SinyachenkoOV, TrukhinDV, KovalchukVI, PisonU. Studies on the application of dynamic surface tensiometry of serum and cerebrospinal liquid for diagnostics and monitoring of treatment in patients who have rheumatic, neurological or oncological diseases. Adv. Colloid Interface Sci.86 (1–2), 1–38 (2000).
- Fathi-Azarbayjani A , JouybanA. Surface tension in human pathophysiology and its application as a medical diagnostic tool. Bioimpacts5 (1), 29–44 (2015).
- Wilfang J , LewczukP, RiedererPet al. Consensus paper of the WFSBP task force on biological markers of dementia: the role of CSF and blood analysis in the early and differential diagnosis of dementia. World J. Biol. Psych.6 (2), 69–84 (2005).
- Mottaghy K , HahnA. Interfactial tension of some biological fluids: a comparative study. J. Clin. Chem. Clin. Biochem.19 (5), 267–271 (1981).
- Lin TY , TimasheffSN. On the role of surface tension in the stablilization of globular proteins. Protein Sci.5 (2), 372–381 (1996).
- Chichili VPR , KumarV, SivarramanJ. Linkers in the structural biology of protein–protein interactions. Protein Sci.22 (2), 153–167 (2012).
- Schuster T , KrumpferJW, SchellenbergerS, FriedrichR, KlapperM, MüllenK. Effects of chemical structure on the dynamic and static surface tensions of short-chain, multi-arm nonionic fluorosurfactants. J. Colloid Interface Sci.428, 276–285 (2014).
- Soreghan B , KosmoskiJ, GlabeC. Surfactant properties of Alzheimer´s A beta peptides and the mechanism of amyloid aggregation. J. Biol. Chem.269 (46), 28551–28554 (1994).
- Ambroggio EE , KimDH, SeparovicFet al. Surface behavior and lipid interaction of Alzheimer β-amyloid peptide 1-42: a membrane-disrupting peptide. Biophys. J.88 (4), 2706–2713 (2005).
- Williams TL , SerpellLC. Membrane and surface interactions of Alzheimer´s Aβ peptide – insights into the mechanism of cytotoxicity. FEBS J.278 (20), 3905–3917 (2011).
- Brydon HL , HaywardR, Harkness Wand BaystonR. Physical properties of cerebrospinal fluid of relevance to shunt function. 2: the effect of protein upon CSF surface tension and contact angle. Br. J. Neurosurg.9 (5), 645–651 (1995).
- Sun X , WuWH, LiuQet al. Hybrid peptides attenuate cytotoxicity of β-amyloid by inhibiting its oligomerization: implication from solvent effects. Peptides30 (7), 1282–1287 (2009).
- Kachooei E , Moosavi-MovahediAA, KhodagholiF, RamshiniH, ShaerzadehF, SheibaniN. Oligomeric forms of insulin amyloid aggregation disrupt ourgrowth and complexity of neuron-like PC12 cells. PLoS ONE7 (7), e41344 (2012).
- Ruiz ED , AlmadaM, BurboaMGet al. Oligomers, protofibrils and amyloid fibrils from recombinant human lysozyme (rHL): fibrillation process and cytotoxicity evaluation for ARPE-19 cell line. Colloid. Surf. B-Biointerfaces126, 335–343 (2015).
- Maji SK , AmsdenJJ, RothschildKJ, CondronMM, TeplowDB. Conformational dynamics of amyloid β-protein assembly probed using intrinsic fluorescence. Biochemistry44 (40), 13365–13376 (2005).
- Chan FTS , Kaminski SchierleGS, KumitaJR, BertonciniCW, DobsonCM, KaminskuCF. Protein amyloids develop an intrinsic fluorescence signature during aggregation. Analyst138 (7), 2156–2162 (2013).
- Groenning M . Binding mode of Thioflavin T and other molecular probes in the context of amyloid fibrils – current status. J. Chem. Biol.3 (1), 1–8 (2010).
- Maezawa I , HongHAS, LiuRet al. Congo red and thioflavin-T analogs detect Aβ oligomers. J. Neurochem.104 (2), 457–468 (2008).
- Kristofikova Z , GazovaZ, SiposovaKet al. Effects of ferrofluid and phytoalexin spirobrassinin on Thioflavin-T-based fluorescence in cerebrospinal fluid of the elderly and multiple sclerosis patients. Neurochem. Res.39 (8), 1502–1510 (2014).
- Gazova Z , AntosovaA, KristofikovaZet al. Attenuated antiaggregation effects of magnetite nanoparticles in cerebrospinal fluid of people with Alzheimer´s disease. Mol. Biosyst.6 (11), 2200–2205 (2010).
- Sitkiewicz E , OledzkiJ, PoznanskiJ, DadlezM. Di-tyrosine cross-link decreases the collisional cross-section of Ab peptide dimers and trimers in the gas phase: an ion mobility study. PloS ONE9 (6), e100200 (2014).
- Folstein MF , FolsteinSE, McHughPR. “Mini-mental state”. A practical method for grading the cognitive state of patients for the clinician. J. Psychiatr. Res.12 (3), 189–198 (1975).
- Mioshi E , DawsonK, MitchellJ, ArnoldT, HodgesJR. The Addenbrooke´s Cognitive Examination Revised (ACE-R): a brief cognitive test battery for dementia screening. Int. J. Geriatr. Psychiatry21 (11), 1078–1085 (2006).
- Bartos A , RaisovaM. The Mini-Mental State Examination: Czech norms and cutoffs for mild dementia and mild cognitive impairment due to Alzheimer´s disease. Dement. Geriatr. Cogn. Disord.42 (1-2), 50–57 (2016).
- Deisenhammer F , BartosA, EggRet al. Guidelines on routine cerebrospinal fluid analysis. Report from an EFNS task force. Eur. J. Neurol.13 (9), 913–922 (2006).
- Hort J , BartosA, PirttiläT, ScheltensP. Use of cerebrospinal fluid biomarkers in diagnosis of dementia across Europe. Eur. J. Neurol.17 (1), 90–96 (2010).
- Albert MS , DeKoskyST, DicksonDet al. The diagnosis of mild cognitive impairment due to Alzheimer´s disease: recommendations from the National Institute on Aging-Alzheimer´s Association workgroups on diagnostic guidelines for Alzheimer´s disease. Alzheimers Dement.7 (3), 270–279 (2011).
- McKhann GM , KnopmanDS, ChertkowHet al. The diagnosis of dementia due to Alzheimer´s disease: recommendations from the National Institute on Aging-Alzheimer´s Association workgroups on diagnostic guidelines for Alzheimer´s disease. Alzheimers Dement.7 (3), 263–269 (2011).
- Sheskin DJ . Measures of association/correlation. In Handbook of Parametric and Nonparametric Statistical Procedures (5th Edition). Chapman and Hall/CRC, New York, USA, 1219–1413 (2011).
- Schoonjans F . ROC curve analysis. InMedCalc Manual.MedCals Software bvba, Ostend, Belgium, 177–190 (2014).
- Kristofikova Z , RipovaD, BartosAet al. Neuroinflammation and complexes of 17β-hydroxysteroid dehydrogenase type 10 - amyloid β in Alzheimer´s disease. Curr. Alzeimer Res.10 (2), 165–173 (2013).
- Kristofikova Z , RicnyJ, KolarovaMet al. Interactions between amyloid-β and tau in cerebrospinal fluid of people with mild cognitive impairment and Alzheimer´s disease. J. Alzheimers Dis.42 (suppl. 3), S91–S98 (2014).
- Kristofikova Z , RicnyJ, VyhnalekMet al. Levels of 17β-hydroxysteroid dehydrogenase type 10 in cerebrospinal fluid of people with mild cognitive impaiment and various types of dementia. J. Alzheimers Dis.48 (1), 105–114 (2015).
- Kolarova M , SenguptaU, BartosA, RicnyJ, KayedR. Tau oligomers in sera of patients with Alzheimer´s disease and aged controls. J. Alzheimers Dis.58 (2), 471–478 (2017).
- Gong Y , ChangL, ViolaKLet al. Alzheimer´s disease-affected brain: presence of oligomeric Aβ ligands (ADDLs) suggests a molecular basis for reversible memory loss. Proc. Natl Acad. Sci. USA100 (18), 10417–10422 (2003).
- Olsson B , LautnerR, AndreassonUet al. CSF and blood biomarkers for the diagnosis of Alzheimer´s disease: a systematic review and meta-analysis. Lancet Neurol.15 (7), 673–684 (2016).
- Wu HZ , OngKL, SeeherKet al. Circulating microRNAs as biomarkers of Alzheimer´s disease: a systematic review. J. Alzheimers Dis.49 (3), 755–766 (2016).
- Wojsiat J , Laskowska-KaszubK, Mietelska-PorowkaA, WojdaU. Search for Alzheimer´s disease biomarkers in blood cells: hypotheses-driven approach. Biomark. Med.11 (10), 917–931 (2017).
- Hartmann S , Ledur KistTB. A review of biomarkers of Alzheimer´s disease in noninvasive samples. Biomark. Med.12 (6), 677–690 (2018).