
Abstract
1. The metabolism and drug–drug interaction (DDI) risk of tofogliflozin, a potent and highly specific sodium-glucose co-transporter 2 inhibitor, were evaluated by in vitro studies using human liver microsomes, human hepatocytes, and recombinant human CYPs.
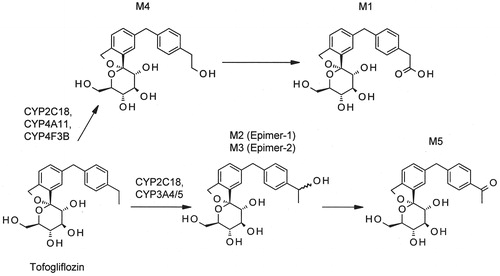
2. The main metabolite of tofogliflozin was the carboxylated derivative (M1) in human hepatocytes, which was the same as in vivo. The metabolic pathway of tofogliflozin to M1 was considered to be as follows: first, tofogliflozin was catalyzed to the primary hydroxylated derivative (M4) by CYP2C18, CYP4A11 and CYP4F3B, then M4 was oxidized to M1.
3. Tofogliflozin had no induction potential on CYP1A2 and CYP3A4. Neither tofogliflozin nor M1 had inhibition potential on CYPs, with the exception of a weak CYP2C19 inhibition by M1.
4. Not only are multiple metabolic enzymes involved in the tofogliflozin metabolism, but the drug is also excreted into urine after oral administration, indicating that tofogliflozin is eliminated through multiple pathways. Thus, the exposure of tofogliflozin would not be significantly altered by DDI caused by any co-administered drugs. Also, tofogliflozin seems not to cause significant DDI of co-administered drugs because tofogliflozin has no CYP induction or inhibition potency, and the main metabolite M1 has no clinically relevant CYP inhibition potency.
Introduction
A novel sodium-glucose co-transporter (SGLT) 2 inhibitor, tofogliflozin ((1 S,3′R,4′S,5′S,6′R)-6-[(4-ethylphenyl)methyl]-6′-(hydroxymethyl)-3′,4′,5′,6′-tetrahydro-3H-spiro[2-benzofuran-1,2′-pyran]-3′,4′,5′-triol) is a derivative of O-spiroketal C-arylglucoside (Ohtake et al., Citation2012), and is approved as a therapeutic agent for type 2 diabetes mellitus (T2DM) in Japan.
SGLT2, which is specifically located in the luminal side of the S1 segment of the proximal tubules of the kidneys, plays an important role in renal glucose reabsorption (Idris & Donnelly, Citation2009; Isaji, Citation2007; Washburn, Citation2012). SGLT2 mutations were observed in patients with familial renal glucosuria (Magen et al., Citation2005; Santer et al., Citation2003). In studies using SGLT2 knockout mice, the increase in blood glucose levels in mice made diabetic with streptozotocin was attenuated (Vallon et al., Citation2013), and glucosuria in both normal and diabetic mice was observed (Vallon et al., Citation2011, Citation2013). These reports indicate that SGLT2 plays an important role in renal glucose reabsorption and is a promising novel target for diabetes mellitus therapy.
Suzuki et al. (Citation2012) reported that tofogliflozin lowered blood glucose levels by potently inhibiting renal SGLT2 in diabetic rats and mice and improved their pathological conditions of T2DM. In contrast, tofogliflozin showed no glucose-lowering effect in hypo/euglycemic conditions because its inhibition of SGLT2 is highly specific (Nagata et al., Citation2013a; Yamaguchi et al., Citation2013). Additionally, long-term use of tofogliflozin in T2DM patients possibly prevents the progression of diabetic nephropathy (Nagata et al., Citation2013b). These reports demonstrate that tofogliflozin is a pharmacologically promising agent. Regarding safety, tofogliflozin did not significantly increase the susceptibility to urinary tract infection when female mice infected by transurethral inoculation with Candida albicans were treated orally with tofogliflozin at 10 mg/kg for 3 d (Suzuki et al., Citation2014).
Diabetic patients normally take not only anti-diabetics but also other agents for different indications, such as anti-hypertensive drugs. Therefore, diabetic patients with polypharmacy should be carefully managed for the drug–drug interaction (DDI) risk. A significant change in the exposure of anti-diabetics by a concomitant drug may lead to the deterioration of glycemic control or the risk of hypoglycemia. Scheen (Citation2005) reported that rifampicin, a CYP inducer, is known to significantly reduce the glucose-lowering effect of gliclazide or repaglinide because the CYP induction reduces their exposure. Moreover, anti-diabetics may affect the systemic exposure of a concomitant drug by the pharmacokinetic DDI, which may cause adverse events; this is especially true for drugs with a narrow therapeutic window, which will be significantly affected in clinical use (e.g. digoxin, warfarin). Considering these risks, it is essential for new anti-diabetics to have no potential of DDI. Yamaguchi et al. (Citation2013) reported that renal glucose reabsorption correlates with the plasma concentration of an SGLT inhibitor. This suggests that any factors that alter the pharmacokinetics of an SGLT inhibitor would possibly affect its therapeutic efficacy. Therefore, we have to keep an eye on the possibility of alterations to the systemic exposure mediated by metabolic enzymes and transporters. In this study, to clarify the enzymes involved in the bioconversion of tofogliflozin, we evaluated its metabolic pathway using human tissues and recombinant CYP. The CYP induction and inhibition potencies of tofogliflozin were also investigated in order to estimate the pharmacokinetic DDI risks in clinical studies.
Materials and methods
Materials
[14C]Tofogliflozin was synthesized at GE Healthcare Bio-Sciences (Tokyo, Japan), and the radiochemical purity was ≥99.4%, according to analysis by high performance liquid chromatography (HPLC). Tofogliflozin and its metabolites M1, M2, M3, M4, and M5 were synthesized at Chugai Pharmaceutical Co., Ltd. William’s medium E, l-glutamine, insulin solution from bovine pancreas, penicillin–streptomycin solution, dexamethasone, methyl-α-D-glucopyranoside (AMG), 1-aminobenzotriazole, ethoxyresorufin, amodiaquine, diclofenac, dextromethorphan, nifedipine, and testosterone were purchased from Sigma-Aldrich (St. Louis, MO). 10-Undecynoic acid was purchased from Wako Pure Chemical Industries Ltd. (Osaka, Japan). β-Nicotinamide-adenine dinucleotide reduced form (NADPH) was purchased from Sigma-Aldrich. NADPH-generating system was purchased from BD gentest (Woburn, MA). 7-Ethoxyresorufin was purchased from AnaSpec (San Jose, CA) or Sigma-Aldrich. S-Mephenytoin was purchased from Toronto Research Chemicals Inc. (Ontario, Canada). Midazolam was obtained from F. Hoffmann-La Roche, Ltd. (Basel, Switzerland). [14C]AMG was purchased from GE Healthcare Japan (Tokyo, Japan). Human hepatocytes were purchased from In Vitro Technologies, Inc. (Baltimore, MD) or Xenotech LLC. (Lenexa, KS). Human liver microsomes were purchased from Tissue Transformation Technologies, Inc. (Edison, NJ) and BD Gentest. Recombinant human CYP (rhCYP) isoforms from baculovirus-infected insect cells (product name: Supersomes™) were purchased from BD Gentest.
Tofogliflozin metabolism in human hepatocytes
The incubation mixture contained pooled human hepatocytes (1 × 10⁶ cells/mL), l-glutamine (0.292 g/L), penicillin/streptomycin (50 units/50 μg/mL), insulin (10−7 M), and dexamethasone (10−7 M) in William’s medium E. The incubation mixtures were pre-incubated in duplicate at 37 °C under 5% CO2 with sufficient mixing at 300 rpm by Rotamax120 (As One Corp., Osaka, Japan) for 15 min until the mixture was warmed. In the inhibition experiment, an inhibitor of ω- and (ω−1)-hydroxylation of lauric acid, 10-undecynoic acid (final concentration: 150 μM), was added to the incubation mixture before initiating pre-incubation, and blank vehicle was added in place of the inhibitor as a control sample. The reaction was initiated by the addition of [14C]tofogliflozin at the final concentration of 1 μM. The inhibitor and substrate were dissolved in dimethyl sulfoxide (DMSO) and the final DMSO concentration in the incubation mixture was less than 0.4%. The reaction was terminated by adding iced acetonitrile after 5 h incubation. The mixture was mixed and centrifuged at 5 °C for 5 min at 3000 rpm (Himac CF7D; Hitachi Koki Co., Ltd., Tokyo, Japan), and then the supernatant was collected as an analytical sample for HPLC. The radioactivity percentage of each peak was calculated from the following formula: percent of radioactivity (%) = radioactivity of metabolite peak/total peak radioactivity × 100. When the peak height of radioactivity was less than two-fold the height of the background, the peak was defined as not detected (ND) and the radioactivity (%) was not calculated. The inhibitory effect of 10-undecynoic acid on tofogliflozin metabolism is expressed as the percentage of inhibition as follows: inhibition (%) = (1 − I/C) × 100, where I and C represent the percentage of metabolite radioactivity in the presence and absence of an inhibitor, respectively. The value for inhibition (%) is defined as 100 when the percentage of radioactivity is ND in the presence of the inhibitor (I). [14C]Tofogliflozin and each metabolite in human hepatocytes incubations were identified by comparing the retention times and mass fragmentation patterns with those of authentic standards (Supplementary Material 1).
Tofogliflozin metabolism in human liver microsomes
The incubation mixture contained 1 mg/mL human liver microsomes, 0.1 M phosphate buffer (pH 7.4), and NADPH-generating system (1.3 mM NADP+, 3.3 mM glucose-6-phosphate, 3.3 mM MgCl2, and 0.4 units/mL glucose-6-phosphate dehydrogenase). The incubation mixtures were pre-incubated in duplicate at 37 °C for 15 min until warmed. An inhibitor, 1-aminobenzotriazole (final concentration: 1 mM), was added to the incubation mixture before initiating pre-incubation, and blank vehicle was added in place of the inhibitor as a control sample. The reaction was initiated by the addition of [14C]tofogliflozin at the final concentration of 10 μM. The inhibitor and substrate were dissolved in DMSO and the final DMSO concentration in the incubation mixture was set at less than 0.4%. The reaction was terminated by addition of iced acetonitrile after 1 h incubation. The mixture was mixed and centrifuged at 5 °C for 5 min at 15 000 rpm (MRX-150; Tomy Seiko Co., Ltd., Tokyo, Japan), and then the supernatant was collected as an analytical sample for HPLC. The inhibitory effect of 1-aminobenzotriazole was calculated as mentioned above.
Tofogliflozin metabolism in rhCYPs
Fourteen types of rhCYP (CYP1A2, CYP2A6, CYP2B6, CYP2C8, CYP2C9, CYP2C18, CYP2C19, CYP2D6, CYP2E1, CYP3A4, CYP3A5, CYP4A11, CYP4F2, and CYP4F3B) were used. The incubation mixtures contained 200 pmol CYP/mL, additional control microsomal proteins (used for adjusting final protein concentration to 4 mg/mL), the NADPH-generating system, and a buffer: 0.1 M Tris-HCl buffer (pH 7.5) was used for CYP2A6, CYP2C9, and CYP4A11, and 0.1 M potassium phosphate buffer (pH 7.4) for the other isoforms. The incubation of [14C]tofogliflozin (final concentration: 1 μM) and analytical sample preparation were carried out in duplicate by the same method as the human liver microsomes. [14C]Tofogliflozin was dissolved in DMSO and the final DMSO concentration in the incubation mixture was set at 0.2%. The obtained samples were analyzed by HPLC.
CYP induction studies
A CYP induction study was carried out using hepatocytes from three donors. The plated hepatocytes from each donor were cultured in the exposure medium, which consist of Modified Lanford’s medium (Nissui Pharmaceutical Corp., Tokyo, Japan) containing 10 v/v% fetal bovine serum (FBS) (Hyclone Laboratories Inc., South Logan, UT), and tofogliflozin (0.5, 5, and 50 μM) for 48 h in a CO2 incubator set at 37 °C, 5% CO2, and 95% humidity. Tofogliflozin was dissolved in DMSO and the final DMSO concentration in each well was set at 0.1%. The exposure medium was renewed 24 h after incubation. After removal of the exposure medium, pre-warmed (37 °C) Hank's Balanced Salt Solution (HBSS) (Nissui Pharmaceutical) was added to wash. After removal of the HBSS, a pre-warmed substrate solution (37 °C) (1 μM 7-ethoxyresorufin for CYP1A2 or 100 μM testosterone for CYP3A4) was added and incubated in duplicate for 1 h in a CO2 incubator. An aliquot of exposure medium was mixed with iced 25% acetonitrile (for 7-ethoxyresorufin) or iced 25% methanol (for testosterone) to terminate the reaction. The reaction mixture was mixed and centrifuged at 5 °C for 10 min at 3000 rpm (Himac CF7D). Then, the supernatant was collected as an analytical sample for HPLC, and the residue was lysed by 1 M NaOH and mixed with HCl for neutralization, and then the protein concentration was determined with a BCA protein assay kit (Thermo Fisher Scientific Inc., Waltham, MA). The target substance (resorufin or 6β-hydroxytestosterone as the metabolite of 7-ethoxyresorufin or testosterone, respectively) was analyzed by HPLC (Supplementary Material 2).
Reversible inhibition experiments to determine IC50
The incubation mixture contained 0.2 mg/mL human liver microsomes, 0.1 M phosphate buffer (pH 7.4), a CYP isoform-selective substrate (1 μM 7-ethoxyresorufin for CYP1A2, 100 μM bupropion for CYP2B6, 2 μM amodiaquine for CYP2C8, 5 μM diclofenac for CYP2C9, 20 μM S-mephenytoin for CYP2C19, 5 μM dextromethorphan for CYP2D6, and 5 μM midazolam, 10 μM nifedipine or 30 μM testosterone for CYP3A), and the test article, tofogliflozin or M1 (final concentration: 0.20, 0.39, 0.78, 1.56, 3.13, 6.25, 12.5, 25, and 50 μM). Tofogliflozin and M1 were dissolved in DMSO and the final DMSO concentration in the incubation mixture was set at 0.2%. DMSO was added instead of the test article as a control sample. The incubation mixtures were pre-incubated in triplicate at 37 °C for 10 min. The reaction was initiated by the addition of NADPH (final concentration: 1 mM), and terminated after 5- to 30-min incubation (depending on the substrate used) by the addition of iced acetonitrile containing deuterium-midazolam and deuterium-dextrorphan as internal standards (IS). After terminating the reaction, the mixture was mixed and centrifuged (5800 × g, 10 min), and then the supernatant was collected to analyze the concentration of metabolite of each substrate by liquid chromatography-tandem mass spectrometry (LC-MS/MS) (Supplementary Material 2). The percentage of enzyme activity was calculated as (metabolite concentration observed in the incubation with the test article)/(metabolite concentration observed in the control sample) × 100. When an enzyme inhibition was observed, the IC50 value was estimated using the calculated inhibition percentage by the non-linear curve fitting procedure of Origin software (OriginLab Corp., Northampton, MA). Inhibition (%) was calculated as follows: inhibition (%) = 100 − (percentage of enzyme activity).
Time-dependent inhibition experiments
The incubation mixture contained 1 mg/mL human liver microsomes, 0.1 M phosphate buffer (pH 7.4), and the test article, tofogliflozin (final concentration: 10 to 100 μM) or M1 (final concentration: 10 to 50 μM). Tofogliflozin and M1 were dissolved in DMSO and the final DMSO concentration in the incubation mixture was set at 0.25%. DMSO was added in place of the test article as a control sample. The incubation mixtures were warmed to 37 °C over 10 min, then the pre-incubation of the test article was initiated by the addition of NADPH (final concentration: 1 mM). At timepoints of 0.5- to 15-min pre-incubation (0.5, 2.5, 4.5, 8, and 15 min for CYP1A2 and CYP2C9, 0.5, 3, 6, 10, and 14.5 min for CYP3A), aliquots were transferred with fresh NADPH to pre-warmed substrate solution; the final concentration of microsomes and NADPH were 0.1 mg/mL and 1.1 mM, respectively. The substrates used were 1 μM 7-ethoxyresorufin or 10 μM tacrine for CYP1A2; 20 or 25 μM diclofenac for CYP2C9; and 10 μM midazolam for CYP3A. Incubations were performed in singlicate (tofogliflozin) or triplicate (M1). The reaction was allowed to proceed for 10 or 15 min (depending on the substrate used), and then terminated by addition of iced acetonitrile containing deuterium-midazolam and deuterium-dextrorphan as IS. After terminating the reaction, the mixture was mixed and centrifuged (5800 × g, 10 min), and then the supernatant was collected to analyze the concentration of metabolite of each substrate by LC-MS/MS (Supplementary Material 2). The relative metabolite formation rates for each substrate were calculated as follows: relative metabolite formation rate = (metabolite concentration after incubation)/(metabolite concentration in the 0.5-min pre-incubated control sample) × 100. The natural logarithm of the relative metabolite formation rate was plotted against the pre-incubation time, and then the slope as a rate constant for the loss of enzyme activity (kobs, min−1) was estimated.
Protein binding to human plasma
Blood was collected from healthy volunteers working in-house at Chugai Pharmaceutical Co. Ltd. (5 men who had fasted for at least 8 h) using a syringe, and the blood samples were placed in sample tubes treated with sodium heparin. Informed consent was obtained from all individuals before testing, and the study protocol was approved by the human research ethics committee. The heparinized blood samples were centrifuged (3000 rpm by himac CF7D for 20 min at 4 °C) and plasma samples were obtained. The plasma samples from five donors were mixed and pooled on ice, then used within a day. A protein binding assay was performed using the equilibrium dialysis method. A dialysis membrane that had been immersed in phosphate buffered saline (PBS, pH 7.4) and had swollen sufficiently was placed at the boundary between the two cells of the equilibrium dialysis apparatus and fixed with bolts. The plasma sample containing M1 and PBS was added in triplicate to the equilibrium dialysis device and incubated in a shaking-incubator (37 °C, shaking frequency: 40 rpm). M1 was dissolved in purified water and the final concentration of M1 was set at 0.1 and 1 μg/mL. The plasma sample and PBS were collected at 20 h after incubation, then the concentrations of M1 were measured using a LC-MS/MS system. The free fraction in plasma (fP) and the percentage of protein binding were calculated as follows:
where CB and CP are the concentrations of M1 in PBS and plasma samples, respectively.
SGLT inhibition studies
An in vitro SGLT2 inhibition experiment was conducted as described in the literature (Suzuki et al., Citation2012). In brief, human SGLT2 (hSGLT2) cDNA was cloned into pcDNA3.1, and the constructed expression vector was introduced into CHO-K1 cells to establish a cell line expressing hSGLT2. The cells expressing SGLT2 were cultured in 96-well plates for 4 d and washed twice with sodium-free buffer containing 140 mM choline chloride, 2 mM KCl, 1 mM CaCl2, 1 mM MgCl2, and 10 mM 4-(2-hydroxyethyl)-1-piperazineethanesulfonic acid (HEPES)/Tris buffer (pH 7.4). The cells were incubated in duplicate with 1 mM [14C]AMG and a test article (tofogliflozin or its metabolites) in sodium-free or sodium-containing buffer (sodium-free buffer containing 140 mM NaCl) at 37 °C for 40 min. The test articles were dissolved in DMSO and the final DMSO concentration in each well was set at 0.4%. The incubation was terminated by washing twice with sodium-free buffer containing 10 mM non-radiolabeled AMG. The cells were lysed with 0.1 w/v% sodium dodecyl sulfate, 0.1 w/v% Triton X-100, and 1 M NaOH, and the radioactivity of each sample was measured by TopCount-NXT (PerkinElmer Inc., Boston, MA). Sodium-dependent AMG uptake was calculated by subtracting the level of AMG incorporated into the sodium-free buffer from that of AMG in the sodium-containing buffer. IC50 values were calculated by multiple logistic regressions using SAS preclinical package (SAS Institute Inc., Tokyo, Japan).
HPLC analysis
The metabolite profile of [14C]tofogliflozin was analyzed by Shimadzu HPLC system (Shimadzu Corp., Kyoto, Japan) equipped with two pumps (LC-10ADvp), an autoinjector (SIL-10Avp), a column oven (CTO-10Avp), a diode-array detector (SPD-10Avp), and a flow scintillation analyzer (FLO-ONE 515TR; PerkinElmer). Chromatographic separation was achieved with a reverse-phase column (Hypercarb, 5 μm, 4.6 × 100 mm; Thermo Fisher Scientific) at 40 °C and a flow rate of 1 mL/min. A gradient with two solvents, A and B, was used; solvent A consisted of 0.1 v/v% ammonia in water and solvent B was 0.1 v/v% ammonia in acetonitrile. The gradient program started at an initial condition of 20% B, which was increased to 100% B over the course of 10 min, held for 5 min, then decreased to 0% over 0.1 min, increased linearly to 20% over 1.9 min, and then re-equilibrated to 20% B over 8 min. Ultima-Flo™ M (PerkinElmer) was used as a scintillator and the flow rate was 1.5 mL/min.
LC-MS/MS analysis
To measure M1 concentration, an aliquot of the sample obtained was mixed with a 2.5-fold volume of methanol and a 2-fold volume of deuterium-M1 solution as IS. To prepare the standard samples of calibration curve and quality controls (QC), the blank plasma or PBS was mixed with a 2.5-fold volume of methanol containing M1 solution (2–800 ng/mL) and a 2-fold volume of IS solution. The supernatant was collected by centrifugation and mixed with water to prepare an analytical sample. The M1 was quantitated by Shimadzu HPLC system interfaced with an API 4000 mass spectrometer (AB Sciex, Foster City, CA) and an HPLC system equipped with two pumps (LC-10AD), an autoinjector (SIL-20AC), and a column oven (CTO-10AD). Chromatographic separation was achieved with a reverse-phase column (Cadenza CD-C18, 3 μm, 2.0 × 50 mm, Imtakt Co., Kyoto, Japan) at ambient temperature. A gradient with two solvents, A and B, was used: 0.3 v/v% formic acid in water for solvent A and acetonitrile for solvent B. The gradient program started at an initial condition of 5% B, which was held for 2 min, increased in a stepwise fashion to 19% B over the course of 9 min, then to 90% B over 4 min, and then re-equilibrated to 5% B over 5 min. The HPLC flow rate was 0.2 mL/min over 11 min, 0.4 mL/min over 8 min, and 0.2 mL/min over 1 min. The mass spectrometer was operated in positive electrospray ionization mode. The desolvation temperature was 400 °C, and ion source voltage was 5500 V. M1 and IS were detected through multiple reaction monitoring at m/z 417.25 → 297.30 for M1, and 421.25 → 301.30 for IS (deuterium-M1). Analyst software (AB Sciex) was used to analyze the ion chromatograms obtained from LC-MS/MS analyses. A calibration curve (weight: 1/x2) was prepared by the IS method and used to calculate the concentration of M1 in the incubation samples.
Results
Human metabolite profile of tofogliflozin
The metabolite profile of [14C]tofogliflozin after 5 h incubation with human hepatocytes is shown in . [14C]Tofogliflozin was metabolized to the carboxylated derivative (M1), the secondary hydroxylated derivatives, epimer-1 and epimer-2 (M2 and M3), the primary hydroxylated derivative (M4), and the ketone derivative (M5). The radioactivity of each metabolite after incubation was 30.9% for M1, 0.6% for M2/M3, 1.1% for M4, and 3.7% for M5. The chemical structure of each metabolite is shown in .
Figure 1. Radio-HPLC chromatogram of [14C]tofogliflozin after 5 h incubation with human hepatocytes at the concentration of 1 μM. Pooled human hepatocytes from 10 donors of mixed gender were used. The percent in the figure expresses the mean value of percent radioactivity obtained from two experiments.
![Figure 1. Radio-HPLC chromatogram of [14C]tofogliflozin after 5 h incubation with human hepatocytes at the concentration of 1 μM. Pooled human hepatocytes from 10 donors of mixed gender were used. The percent in the figure expresses the mean value of percent radioactivity obtained from two experiments.](/cms/asset/0db7df2e-36cc-4c44-8f52-7ddff716ae14/ixen_a_976296_f0001_b.jpg)
Figure 2. Proposed metabolic pathways of tofogliflozin in human.
Identification of metabolic enzymes
To clarify whether the conversion of [14C]tofogliflozin to M2/M3 or M4 was catalyzed by CYP enzymes, the cofactor requirement and the effect of 1 mM 1-aminobenzotriazole (a non-specific CYP inhibitor) were evaluated using human liver microsomes. The metabolites were generated in the presence of NADPH-generating system, and the formation of M2/M3 or M4 was almost completely inhibited by 1-aminobenzotriazole ().
Table 1. Cofactor requirement and effect of 1-aminobenzotriazole on the metabolism of [14C]tofogliflozin.
shows the radioactive metabolites in the reaction mixture of [14C]tofogliflozin after 1 h incubation with rhCYPs. The conversion of tofogliflozin to M2/M3 was mainly catalyzed by rhCYP2C18, rhCYP3A4, and rhCYP3A5 with 8.2%, 13.0%, and 12.6% of radioactivity, respectively. The conversion of tofogliflozin to M4 was mainly catalyzed by rhCYP2C18, rhCYP4A11, and rhCYP4F3B with 8.4%, 1.8%, and 1.6%, respectively.
Table 2. Metabolism of [14C]tofogliflozin to hydroxylated derivatives after 1 h incubation with a set of 14 rhCYPs at 37 °C.
10-Undecynoic acid, an inhibitor of ω- and (ω-1)-hydroxylation of lauric acid, at 150 μM completely inhibited the formation of M4 (100% of inhibition) and almost completely inhibited the subsequent formation of M1 (96.7% of inhibition) in human hepatocytes.
CYP induction and inhibition
The in vitro CYP induction and inhibition studies were performed at concentrations near to or higher than the maximum plasma concentration (Cmax) observed in clinical study; the Cmax values of tofogliflozin and M1 were 489 and 189 ng/mL (1.27 and 0.45 μM), respectively (Schwab et al., Citation2013).
CYP1A2 and CYP3A4 activity was not induced by tofogliflozin in the concentration range of 0.5–50 μM (). The free concentration of tofogliflozin might be lower than the nominal value due to the protein binding to FBS in the incubation mixture. The results of positive control inducers are shown in Supplementary Material 3 (Table S1).
Table 3. CYP1A2 and CYP3A4 induction by tofogliflozin.
Tofogliflozin exhibited no reversible inhibition potential on CYP1A2, CYP2B6, CYP2C8, CYP2C9, CYP2C19, CYP2D6, or CYP3A activity (IC50 of each CYP > 50 μM). M1 also did not inhibit CYP isoforms (IC50 of each CYP > 50 μM) except for CYP2C19 (IC50 = 27.1 ± 6.5 μM) (). The results of positive control inhibitors are shown in Supplementary Material 3 (Table S2). Moreover, time-dependent inhibition of CYP1A2, CYP2C9, and CYP3A activity were estimated; no inhibition potency was observed at the concentration range of 10–100 μM of tofogliflozin and at the range of 10–50 μM of M1 (). The results of positive control inhibitors are shown in Supplementary Material 3 (Table S3).
Table 4. IC50 values for reversible inhibition of CYPs by tofogliflozin and M1.
Table 5. Time-dependent inhibition of CYP activity by tofogliflozin and M1.
Protein binding to human plasma
The protein binding of M1 to human plasma was 55.0 ± 1.9 and 54.7 ± 0.7% (0.450 ± 0.019 and 0.453 ± 0.007 as the value of fp) at the concentration of 0.1 and 1 μg/mL, respectively.
In vitro pharmacological activity of the metabolites towards hSGLT2
The IC50 values towards hSGLT2 were 0.0039, 2.7, 0.015, 0.014, 0.0049, and 0.016 μM for tofogliflozin, M1, M2, M3, M4, and M5, respectively (). In vitro inhibition potency of all metabolites was lower than that of tofogliflozin.
Table 6. In vitro IC50 values and in vivo inhibition potencies for SGLT2 of tofogliflozin and its metabolites.
Discussion
It was reported that the area under plasma concentration–time curves from time 0 to 24 h (AUC0–24h) after oral administration of 20 mg [14C]tofogliflozin to healthy subjects was 1814, 2215, 225, and 136 ng h/mL for tofogliflozin, M1, M2/M3, and M5, respectively, and that M1 was found to be the major metabolite in urine and feces (Zell et al., Citation2013). These results suggested that the main metabolite of tofogliflozin was M1 in human. In the present study, the metabolism of [14C]tofogliflozin was investigated using human hepatocytes, and the in vitro main metabolite of tofogliflozin was found to be M1, the same as in vivo (). Additionally, M1 was generated from M4 according to a human hepatocyte experiment (Supplementary Material 4). On the other hand, considering the metabolite structures, it was expected that tofogliflozin would be converted to M5, via M2/M3 (). M4 is the intermediate of the main metabolite of tofogliflozin, M1; thus, the enzymes involved in M4 formation are important for tofogliflozin metabolism. In this study, we focused on M4 formation, and metabolic enzymes which were responsible for converting tofogliflozin to M4 were identified using rhCYP, human liver microsomes, and human hepatocytes.
shows that the [14C]tofogliflozin oxidation was catalyzed by certain CYP enzymes. The reactions with 14 types of rhCYP suggested that the conversion of tofogliflozin to M2/M3 was catalyzed by CYP2C18, CYP3A4, and CYP3A5 and that the conversion of tofogliflozin to M4 was catalyzed by CYP2C18, CYP4A11, and CYP4F3B (). Moreover, the conversion of tofogliflozin to M4 was almost completely inhibited by 10-undecynoic acid in human hepatocytes. 10-Undecynoic acid, which is known as an inhibitor of ω- and (ω-1)-hydroxylation of lauric acid, inhibits CYP4A11 and CYP4F3B, because it inhibited the metabolism of [14C]lauric acid (substrate of CYP4A11) and [3H]leukotriene B4 (substrate of CYP4F3B) but did not inhibit the metabolism of diclofenac (substrate of CYP2C18) (Supplementary Material 5). There seemed to be some inconsistency in the in vitro experimental results: the data using rhCYP suggested that tofogliflozin was converted to M4 mainly by CYP2C18 (), but the inhibition experiment using human hepatocytes suggested it was converted mainly by CYP4A11 and/or CYP4F3B. The lack of background data for these uncommon drug metabolizing enzymes means that we can only make a limited interpretation, but we consider the contribution of CYP4A11 and/or CYP4F3B to the conversion of tofogliflozin to M4 would be higher than that of CYP2C18, because hepatocytes have enzymatic activities that reflect in vivo condition. Moreover, although it is unclear what enzymes are involved in the conversion of M4 to M1, alcohol dehydrogenase and aldehyde dehydrogenase might be the ones, considering the structures of the metabolites. In the present study, it was found that multiple enzymes were involved in tofogliflozin metabolism. Considering that the overall elimination of tofogliflozin depends not only on multiple metabolic enzymes but also on 15.5% of urinary excretion (Schwab et al., Citation2013), the exposure of tofogliflozin is not expected to be altered by any co-administered drugs.
This study using rhCYPs suggested that CYP3A4/5 contributed to the metabolism of tofogliflozin to M2/M3; nevertheless, the main metabolite in human was unequivocally not M2/M3 or M5, but was M1. This means that CYP3A4/5 is not the main metabolic enzyme. Indeed, it was reported that the influence of ketoconazole on tofogliflozin exposure was not clinically relevant (Schwab et al., Citation2012).
A lack of induction potency of tofogliflozin on CYP1A2 and CYP3A4 is a good characteristic (). Moreover, tofogliflozin and M1 showed no reversible inhibition potency on most CYP isoforms (IC50 of each CYP > 50 μM), except for a weak inhibition potency of CYP2C19 by M1 (IC50 = 27.1 μM) (). Bjornsson et al. (Citation2003) mentioned that for reversible inhibition, an interaction does not occur if the ratio of Cmax to inhibition constant (Ki) is below 0.1. It was reported that Cmax values of tofogliflozin and M1 after oral administration of 20 mg [14C]tofogliflozin to healthy subjects were 489 and 189 ng/mL (1.27 and 0.45 μM), respectively (Schwab et al., Citation2013). Thus, the Cmax/IC50 values for each CYP of tofogliflozin and M1 are calculated to be below 0.025 and 0.017, respectively, suggesting that the inhibition potency of tofogliflozin and M1 is not clinically relevant. Neither tofogliflozin nor M1 showed time-dependent inhibition potency on CYP1A2, CYP2C9, and CYP3A (). These indicate that the inhibition potency of tofogliflozin on CYPs is not clinically relevant. Although there are no in vitro data, we consider tofogliflozin has no inhibition/induction potency on the enzymes involved in its metabolism (CYP2C18, CYP4A11, and CYP4F3B), because there was no significant alteration of exposure after a 7-d repeated dose of tofogliflozin at 20 mg to healthy subjects (Kowa Pharmaceutical Co., Ltd., Citation2014; Sanofi K. K., Citation2014). Additionally, it was reported that transporter-related DDIs caused by tofogliflozin and M1 would not be expected when the inhibitory effect of tofogliflozin and M1 on transporters was evaluated: human multidrug resistance (MDR) 1, organic anion transporter (OAT) 1, OAT3, organic cation transporter (OCT) 2 and organic anion transporting polypeptide (OATP) 1B1 (data not shown).
shows the in vitro pharmacological activity of the tofogliflozin metabolites. M1 showed 700-fold weaker inhibition potency toward SGLT2 than tofogliflozin. The other metabolites showed 1.3- to 4.1-fold weaker inhibition potency than tofogliflozin. In order to estimate the in vivo pharmacological activity of the metabolites, the following equation was used:
Considering that the fp of tofogliflozin and M1 in human plasma were 0.17 (Schwab et al., Citation2013) and 0.45 (at 0.1 μg/mL because of its Cmax, ), respectively, and their AUC0–24h values were 1814 and 2215 ng h/mL, respectively (Zell et al., Citation2013), it was expected that M1 would not show additional efficacy, because in vivo inhibition potency of M1 versus tofogliflozin was estimated to be 0.005. M2/M3 and M5 are also considered not to affect the in vivo efficacy: the AUC0–24h values of M2/M3 and M5 were 225 and 136 ng h/mL, respectively (Zell et al., Citation2013), and in vivo potency of M2/M3 and M5 versus tofogliflozin was estimated to be 0.2 and 0.1, respectively, even when their fp was 1. Because the exposure of M4 was undetectable (Zell et al., Citation2013), it was considered that it would not influence in vivo efficacy.
Conclusion
The overall elimination of tofogliflozin is mediated by not only multiple metabolic enzymes but also urinary excretion, suggesting that the exposure of tofogliflozin would not be easily altered by any co-administered drugs. Also, tofogliflozin seems not to cause significant DDI of co-administered drugs because it had no induction potency on CYP and neither tofogliflozin nor the main metabolite M1 had clinically relevant inhibition potency on CYP.
Supplementary material available online
Supplementary Figures S1–S6
Supplementary Figures S1 - S6.
Download PDF (348.5 KB)Acknowledgements
We thank Naoaki Murao, Keiichi Morita, Tsutomu Sato and Yoshihito Ohtake for metabolite identification and material supply. We thank Editing services at Chugai Pharmaceutical Co., Ltd. for editing advice.
Declaration of interest
The authors of this work are employees of Chugai Pharmaceutical Co., Ltd., Chugai Research Institute for Medical Science Inc., or F. Hoffmann-La Roche Ltd and have not received financial support from any other institution.
Related Research Data
References
- Bjornsson TD, Callaghan JT, Einolf HJ, et al. (2003). The conduct of in vitro and in vivo drug-drug interaction studies: a pharmaceutical research and manufacturers of America (PhRMA) perspective. Drug Metabol Disposit 31:815–32
- Idris I, Donnelly R. (2009). Sodium–glucose co-transporter-2 inhibitors: an emerging new class of oral antidiabetic drug. Diabetes Obes Metabol 11:79–88
- Isaji M. (2007). Sodium-glucose cotransporter inhibitors for diabetes. Curr Opin Investig Drugs 8:285–92
- Kowa Pharmaceutical Co., Ltd. (2014). Deberza (tofogliflozin) [package insert]. Available from: http://www.kowa-souyaku.co.jp/upload/item/66/4-pt_167.pdf [Japanese] [last accessed 30 Oct 2014]
- Magen D, Sprecher E, Zelikovic I, Skorecki K. (2005). A novel missense mutation in SLC5A2 encoding SGLT2 underlies autosomal-recessive renal glucosuria and aminoaciduria. Kidney Int 67:34–41
- Nagata T, Fukazawa M, Honda K, et al. (2013a). Selective SGLT2 inhibition by tofogliflozin reduces renal glucose reabsorption under hyperglycemic but not under hypo- or euglycemic conditions in rats. Am J Physiol Endocrinol Metab 304:E414–23
- Nagata T, Fukuzawa T, Takeda M, et al. (2013b). Tofogliflozin, a novel sodium–glucose co-transporter 2 inhibitor, improves renal and pancreatic function in db/db mice. Br J Pharmacol 170:519–31
- Ohtake Y, Sato T, Kobayashi T, et al. (2012). Discovery of tofogliflozin, a novel C-arylglucoside with an O-spiroketal ring system, as a highly selective sodium glucose cotransporter 2 (SGLT2) inhibitor for the treatment of type 2 diabetes. J Med Chem 55:7828–40
- SANOFI K. K. (2014). Apleway (tofogliflozin) [package insert]. Available from: http://e-mr.sanofi.co.jp/di/tenpu/apleway.pdf?date=20140523174259 [Japanese]. [last accessed 30 Oct 2014]
- Santer R, Kinner M, Lassen CL, et al. (2003). Molecular analysis of the SGLT2 gene in patients with renal glucosuria. J Am Soc Nephrol 14:2873–82
- Scheen AJ. (2005). Drug interactions of clinical importance with antihyperglycaemic agents: an update. Drug Saf 28:601–31
- Schwab D, Portron A, Backholer Z, et al. (2013). A novel double-tracer technique to characterize absorption, distribution, metabolism and excretion (ADME) of [(14)C]tofogliflozin after oral administration and concomitant intravenous microdose administration of [(13)C]tofogliflozin in humans. Clin Pharmacokinet 52:463–73
- Schwab D, Portron A, Fukushima Y, et al. (2012). Tofogliflozin a selective SGLT2 inhibitor exhibits highly favourable drug properties for use in patients with renal impairment and for combination with other medicines. Abstracts of the 48th EASD Annual Meeting of the European Association for the Study of Diabetes; 2012 Oct 1–5; Berlin, Germany. Diabetologia 55:S316
- Suzuki M, Hiramatsu M, Fukazawa M, et al. (2014). Effect of SGLT2 inhibitors in a murine model of urinary tract infection with Candida albicans. Diabetes, Obes Metabol 16:622–7
- Suzuki M, Honda K, Fukazawa M, et al. (2012). Tofogliflozin, a potent and highly specific sodium/glucose cotransporter 2 inhibitor, improves glycemic control in diabetic rats and mice. J Pharmacol Exp Ther 341:692–701
- Vallon V, Platt KA, Cunard R, et al. (2011). SGLT2 mediates glucose reabsorption in the early proximal tubule. J Am Soc Nephrol 22:104–12
- Vallon V, Rose M, Gerasimova M, et al. (2013). Knockout of Na-glucose transporter SGLT2 attenuates hyperglycemia and glomerular hyperfiltration but not kidney growth or injury in diabetes mellitus. Am J Physiol – Renal Physiol 304:F156–67
- Washburn WN. (2012). Sodium glucose co-transporter 2 (SGLT2) inhibitors: novel antidiabetic agents. Expert Opin Therapeut Patents 22:483–94
- Yamaguchi K, Kato M, Suzuki M, et al. (2013). In vitro–in vivo correlation of the inhibition potency of sodium-glucose cotransporter inhibitors in rat: a pharmacokinetic and pharmacodynamic modeling approach. J Pharmacol Exp Ther 345:52–61
- Zell M, Husser C, Kuhlmann O, et al. (2013). Metabolism and mass balance of SGLT2 inhibitor tofogliflozin following oral administration to humans. Xenobiotica 44:369–78