
Abstract
1. An excretion balance study was performed following i.p. administration of 4-bromoaniline (50 mg kg−1) to bile-cannulated rats, using bromine-detected (79/81Br) ICPMS for quantification. Approximately 90% of the dose was recovered in urine (68.9 ± 3.6%) and bile (21.4 ± 1.4%) by 48 h post-administration.
2. HPLC-ICPMS (79/81Br) was used to selectively detect and profile the major urinary and biliary-excreted metabolites and determined that the 0–12 h urine contained at least 21 brominated metabolites with 19 bromine-containing peaks observed in the 6–12 h bile samples.
3. The urinary and biliary metabolites were subsequently profiled using HPLC-oaTOFMS. By exploiting the distinctive bromine isotope pattern ca. 60 brominated metabolites were detected in the urine in negative electrospray ionisation (ESI) mode while bile contained ca. 21.
4. While a large number of bromine-containing metabolites were detected, the profiles were dominated by a few major components with the bulk of the 4-bromoaniline-related material in urine accounted for by 4-bromoanaline O-sulfate (∼75% of the total by ICPMS, 84% by TOFMS). In bile a hydroxylated N-acetyl compound was the major metabolite detected, forming some ∼65% of the 4-bromoaniline-related material by ICPMS (37% by TOFMS).
Introduction
Anilines are important intermediates in many industrial processes including the synthesis of drugs and pesticides. As part of studies aimed at developing in vivo quantitative structure relationships for this class of compounds (Athersuch et al., Citation2013; Scarfe et al., Citation2002a), particularly with regard to the production of unusual N-oxanilic acid metabolites, we have investigated the metabolic fate of 4-bromoaniline in the rat (Abou-Shakra et al., Citation2002; Major et al., Citation2003a,Citationb; Nicholson et al., Citation2000; Scarfe et al., Citation2002b). These qualitative studies, which were limited to a study of the metabolites excreted via the urine, revealed a surprisingly complex metabolic fate for such a relatively simple structure. We have therefore undertaken further studies in order to obtain a more complete, and quantitative, metabolic profile for 4-bromoaniline, in bile-cannulated rats, with the additional aim of further characterising and identifying the metabolites of the compound. Previously, we have demonstrated the utility of using bromine-specific ICPMS for obtaining quantitative excretion-balance measurements and metabolic profiles for bromine-containing compounds (Packert Jensen et al., Citation2005; Smith et al., Citation2008) on urine and bile, etc. Here quantitative and qualitative profiling of biofluids has been performed using HPLC-ICPMS with bromine-specific detection, while HPLC-oaTOFMS was used for metabolite identification. The study provides a further demonstration of the utility of Br-ICPMS as a quantitative tool for in vivo metabolism studies without the need for the synthesis of radiolabelled tracers (see also, e.g. Cuyckens et al., Citation2008; Gammelgaard et al., Citation2008; Meermann et al., Citation2012).
Methods and materials
Chemicals
4-Bromoaniline, purity 98%, was obtained from Aldrich (Poole, UK) and was used as received. Bromobenzene, purity 99%, was also obtained from Aldrich. Solvents for HPLC were of high purity HPLC grade and were obtained from Fisher Scientific UK Ltd. (Loughborough, UK).
Animals and dosing
Three male Wistar-derived rats (200–250 g) were fitted with biliary cannulae. The surgical procedure involved an incision down the abdomen just below the liver. The intestine was moved sideways from the lower liver to reveal the hepatic artery and bile duct. The bile duct was isolated and straightened and a Portex polyethylene catheter (0.28 mm i.d.) inserted approximately 5 mm into the bile duct and firmly ligated. The abdominal cavity was then closed with surgical wire and the catheter passed under the skin of the lower abdomen and out through a puncture made in the tail. The skin of the abdomen was closed with surgical wire. The animals were anaesthetised with Fluothane (AstraZeneca, Macclesfield, UK) prior to and during bile duct cannulation. During the recovery period the bile duct cannula was secured with a harness from the tail of the rat to the roof of the metabolism cage.
The animals were acclimatised in metabolism cages for 72 h prior to dosing and were permitted free access to food (R&M No. 1 Modified Irradiated Diet) and water throughout the study. The water was supplemented with glucose, NaCl and KCl for 24 h prior to surgery until 48 h after surgery, then with only NaCl and KCl until the end of the study. The rats were dosed with 4-bromoaniline, ip, at 50 mg kg−1 in ethanol-water (1:1 v/v), at a concentration of 50 mg mL−1.
Urine and bile were collected over solid CO2 into sterile containers for the periods 0–12, 12–24 and 24–48 h and 0–6, 6–12, 12–24 and 24–48 h post-dosing, respectively. The samples were stored frozen (−20 °C) until analysis.
At the end of the study, animals were sacrificed by halothane inhalation with confirmation by cervical dislocation. The study was subject to internal ethical review and all animal procedures and treatments were carried out in accordance with approved animal licenses and guidelines issued by the British Home office [Animals (Scientific Procedures) Act (1986)].
Excretion balance via quantification of 79Br by ICPMS Standard curve preparation
Concentrations of Br-containing material in urine and bile were determined by reference to a calibration curve prepared using bromobenzene. Ten calibration standards were prepared in control urine and bile over the range 0.00004 to 4 mg mL−1. For the construction of the calibration curves, 50 μL of each standard was directly injected, in duplicate, into a Platform ICP mass spectrometer (Micromass UK Ltd., Wythenshawe, UK), tuned to monitor 79Br and 81Br, and the response measured over 1.5 min. The peak areas were then taken and used to construct standard curves for urine and bile.
Biofluid analysis for 79Br by ICPMS
Urine and bile samples (25 μL or 50 μL) from each time point were injected, in duplicate, directly into the Platform ICP mass spectrometer monitoring both 79Br and 81Br isotopes. The response was measured over 1.5 min and the concentration of Br was then determined by reference to the calibration curve.
The flow of the nebuliser gases and the operating and acquisition conditions of the ICP mass spectrometer are shown in . MassLynx™ software was used for instrument control, data acquisition and handling.
Table 1. Instrument operating conditions for the ICPMS.
HPLC-ICPMS (79/81Br)
For metabolite profiling and quantification using HPLC-ICPMS an Alliance 2695 separation module (Waters Corporation, Watford, UK) coupled to a Platform ICP mass spectrometer (Micromass UK Ltd.) tuned to monitor 79Br and 81Br was used. In order to avoid excessive carbon build-up on the cones of the instrument the nebuliser gas was mixed to 5% v/v oxygen in argon using an onboard mass flow controller. Additionally oxygen was used as the hexapole auxillary gas. The flow of the nebuliser gases and the operating and acquisition conditions of the ICP mass spectrometer are shown in . The chromatographic separation was carried out using a Hichrom H5BDS C18 column, (250 × 4.6 mm) (Hichrom Ltd., Reading, UK) packed with 5-μm particles, using a linear reversed-phase gradient method based on 0.01 M ammonium formate (solvent A) and methanol (solvent B) as follows; 0 to 10 min 5% B, 10 to 35 min 5 to 60% B, 35 to 40 min 60 to 80% B, then from 40 to 50 min 80 to 5% B. The flow rate was 1 mL min−1, which was split to 200 µL before entering the mass spectrometer. A total of 20 µL injections of urine or bile samples from one animal were made. MassLynx™ (version 4.0) software was used for instrument control, data acquisition and handling.
Table 2. Instrument operating conditions for (HPLC)-ICPMS.
HPLC-oaTOFMS
For metabolite characterisation and structure determination, HPLC-oaTOFMS was performed using an Alliance 2695 separation module (Waters Corporation) coupled to a Micromass LCT Premier™ orthogonal acceleration time of flight mass spectrometer (oa-TOFMS) (Micromass UK Ltd). The chromatographic separation was carried out on a C18 Symmetry column (250 × 4.6 mm) (Waters Corporation), fitted with a guard column (2 cm × 3.9 mm × 5 mm) (Waters Corporation) using a linear reversed-phase gradient method based on 0.01 M ammonium formate (solvent A) and methanol (solvent B) as follows; 0 to 10 min 0% B, 10 to 35 min 0 to 60% B, 35 to 40 min 60 to 80% B, then from 40 to 50 min 80 to 0% B, at a flow rate of 1 m mL min−1. The flow was split 4:1 before entering the mass spectrometer. Prior to performing all HPLC-MS experiments, the mass spectrometer was calibrated in both positive and negative ion electrospray. To carry out exact mass measurement of the analytes, a reference lockmass was infused into the eluent stream via a LockSpray™, the lockspray switch time was 10 s. Leucine enkephalin (C28H37N5O7) was used as it produces both a positive and negative ion ([M+H]+ = 556.2771, [M-H]− = 554.2615). Data were acquired over 80–800 m/z at an acquisition rate of 1 spectrum per second. Capillary voltages for sample ionisation were set to 3000 kV, and a sample cone voltage of 30 V was used for all experiments. Urine samples were diluted one in four with aqueous buffer, and bile samples were diluted one in three with aqueous buffer. The injection volume was 30 µL, and a blank injection was made after each sample analysis. The separation was also monitored by UV spectroscopy over the range 210–400 nm via UV-DAD (996 PDA, Waters Corporation) photodiode array detector. MassLynx™ (version 4.0, Waters Corporation) software was used for instrument control, data acquisition and handling.
Results and discussion
ICPMS-determined bromine excretion balance
The calibration curves constructed for bromine in urine and bile using ICPMS were linear over the range 0.00004 to 4 mg mL−1 (urine R2 = 0.998, bile R2 = 0.996) and all of the bromine responses for the subsequent biofluid samples fell within the range of the standard curves.
The bromine excretion data for the urine and bile of the three animals dosed with 50 mg kg−1 of 4-bromoaniline are shown in . As these data show, excretion was rapid with a total urinary recovery of 68.9 ± 3.6% of the dose achieved by 48 h after dosing and 21.4 ± 1.4% in the bile by 24 h post-dose. Br-containing material was not detected above background noise in the 24–48 h bile samples. The total recovery of 4-bromoaniline following intraperitoneal administration at 50 mg kg−1 up to 48 h post-dose was therefore 90.3 ± 3.8%.
Table 3. Dose recovery in urine and bile (48 h) after ip administration of 4-bromoaniline determined by Br-detected ICPMS.
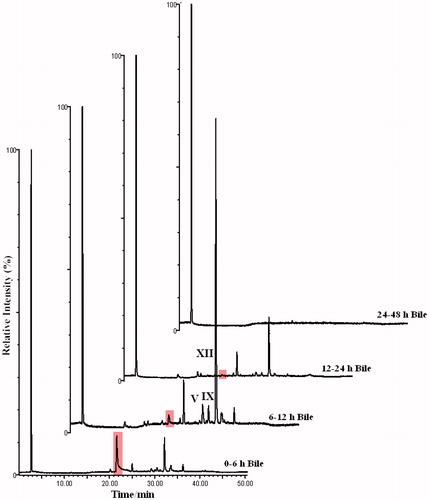
Typical urinary and biliary HPLC-ICPMS (total ion count, 79Br and 81Br) profiles for the Br-containing metabolites of 4-bromoaniline in the rat, for the study period 0–48 h post-dose for urine and bile are shown in and , respectively. The urinary profiles obtained in these bile-cannulated animals were similar to those obtained from non-cannulated rats using HPLC-ICPMS in the previous investigations of the metabolism of 4-bromoaniline (Abou-Shakra et al., Citation2002; Nicholson et al., Citation2000; Scarfe et al., 2002b). The principal metabolite, accounting for ca. 75% of the total, eluted at ∼23 min. (corresponding to the O-sulphate, metabolite VII, see later) and this, together with two other peaks, eluting at 30.0 and 32.5 min, made up the majority of the brominated material excreted during the 0–12 h period. However, at least 21 bromine-containing peaks can be observed in the “bromatogram” for this time point. The 12–24 h profile was similar to the 0–12 h sample in that it contained the same three major peaks, though the metabolite eluting at ca. 30.0 min. now dominated the profile (). The 24–48 h sample contained much less in the way of bromine-containing material with the metabolites eluting at 23 min and 30 min, respectively, accounting for the majority (). The bromatograms for bile () showed a major metabolite eluting at 32.2 min, accounting for ca. 65% of the total, with another significant Br-containing component at a retention time of ∼25.0 min. In addition to these two major components the 6–12 h bile bromatogram contained at least a further 19 brominated metabolites. The peak eluting at ca. 22 min (highlighted in these traces) was identified as an artefact (supporting evidence not included).
Figure 1. HPLC-ICPMS profiles (79Br & 81Br, TIC) of urine from a rat dosed at 50 mg kg−1 with 4-bromoaniline. See and and for key to peak identities and structures.
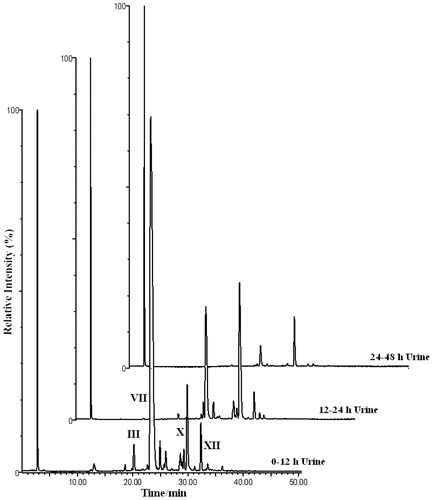
Figure 2. HPLC-ICPMS profiles (79Br & 81Br, TIC) of bile from a rat dosed at 50 mg kg−1 with 4-bromoaniline (artefact is highlighted). See and and for key to peak identities and structures.
Metabolite identification using HPLC-oaTOFMS
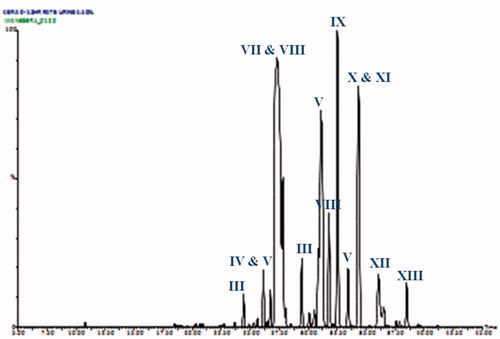
HPLC-oaTOFMS was then employed to characterise and identify the Br-containing metabolites of 4-BrA. Typical total ion current traces (negative ESI data) for urine and bile are shown in and . While the TICs are complex the distinctive bromine isotope pattern (79Br:81Br in the ratio 50.69:49.31) enabled the peaks relating to the 4-bromoaniline metabolites to be easily distinguished from endogenous components. Thus, HPLC-oaTOFMS, in both positive and negative ESI, and using a sensitivity cut-off of 20% threshold for the background noise to determine the presence of a bromine isotope pattern, enabled the detection of some 60 Br-containing compounds in negative ESI (). This probably does not represent the total of Br-containing species present and the use of a less stringent background level as a cut off would no doubt have increased these numbers substantially. The presence of the isotope pattern resulting from the presence of bromine atoms means, providing that it is not lost via metabolism, that it is possible to produce a highly selective trace of 4-bromoaniline metabolites by stripping out all of those signals that do not contain this pattern. A representative trace produced in this way for urine is shown in . Such MS-generated “isotopograms” for the bromine-containing metabolites of 4-BrA provide an interesting alternative to Br-detected ICPMS for specifically visualising metabolite profiles where access to ICPMS is not available. However, it should be borne in mind that while useful for detection, the potential differences in ionisation efficiency between metabolites may, unlike the ICPMS profiles, result in their being no more quantitative than any HPLC-MS profile.
Figure 3. HPLC-oa-TOFMS (TIC) profiles of 0–12 h urine (A), and 0–6 h bile (B) of a rat dosed at 50 mg kg−1 with 4-bromoaniline, metabolite peaks are indicated. See and and for key to peak identities and structures.
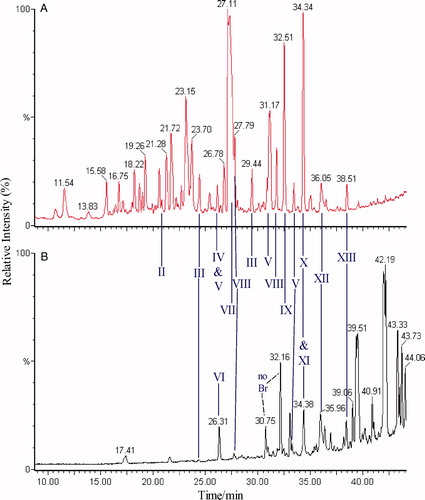
Figure 4. A bromine-isotopogram generated for a 0–6 h urine sample from a 4-bromoaniline-dosed rat. See and and for key to peak identities and structures.
Clearly, based on the quantitative profiles produced using HPLC-ICPMS, the vast bulk of these compounds were present only in trace amounts. The more abundant species, based on peak area by HPLC-oaTOFMS, are listed in , which also provides suggested atomic compositions and identifications where possible (the metabolites are listed in order of increasing mass). Exact mass determination in full scan mode was used to aid in the identification of the putative metabolites and provide an elemental composition. An example of this process can be seen in where the negative ESI mass spectrum for the N-oxanilic acid metabolite (IX) present in urine (eluting at a retention time of ca. 32 min) is shown at m/z 241.9/243.9. The exact mass determination for the m/z 241.9 ion gave 241.9466, which is consistent with a molecular formula of C8H6NO379Br. The loss of 72 amu, clearly visible in the mass spectrum, is due to the oxalic acid fragment. As would be expected on the basis of the similarity of the bromatograms obtained for urine between this and the previous study (Scarfe et al., Citation2002b) the major metabolite present in the urine was confirmed as the 2-hydroxysulphate of 4-BrA, eluting at ca. 27 min (metabolite VII). In addition to the previously identified metabolites, such as the mercapturate (metabolite X), we characterised a further 10 species to provide a total of 17 characterised urinary components related to the administered 4-bromoaniline.
Figure 5. Negative ion mass spectrum and structure of metabolite IX (4-bromo N-oxanilic acid), eluting at 32.32 min in the urine.
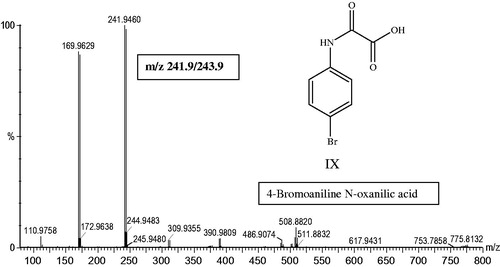
Table 4. Detected metabolites of 4-bromoaniline in urine using negative ion electrospray mode.
As noted earlier, the metabolites of 4-BrA excreted in the bile have not been previously characterised. The bromatograms of bile from these animals showed a much simpler profile than urine with a small number of major metabolites. In the case of bile the major brominated component detected, eluting at 35.09 min was a hydroxy- (most probably the 2-hydroxy) N-acetylated metabolite (XII) which comprised some ∼65% of the 4-bromoaniline-related material present overall, by ICPMS ( for m/z data). One of the other 4-BrA-related components, metabolite (XI), observed in the TIC, eluting at 33.57 min, (was also detected in urine) showed a molecular ion [M-H]− at m/z 330.9780/332.9777 (79/81Br) corresponding to a molecular formula of C11H13N2O3SBr which is consistent with the presence of a cysteinyl conjugate. Examination of the fragmentation of this metabolite showed the loss of the CH2CH(COOH)NH2 group to give the fragment ion 245.9415 (81Br). However, the observed fragmentation was not consistent with ring-based modification, suggesting that this metabolite is most likely a cysteinyl conjugate formed following production of a glutathione conjugate to a reactive hydroxy-sulphate of the glycoanilide as previously seen for the mercapturate detected in urine (also Scarfe et al., Citation2002b). As with urine, many other bromine-containing peaks were observed in the biliary HPLC-oaTOFMS profiles, recognisable by the bromine isotope fingerprint and these are listed in , with suggested biotransformations (see also for a schematic of the biotransformations of 4-bromoaniline).
Figure 6. A schematic showing the metabolites of 4-bromoaniline detected in urine and bile of the rat.
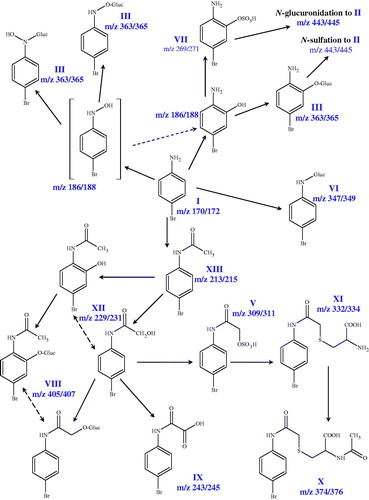
Table 5. Biliary metabolites of 4-bromoaniline detected using negative ion electrospray mode.
Comparison of the HPLC-ICPMS bromatograms against the HPLC-TOFMS TICs for both urine and bile enabled the relative proportions of the metabolites to be determined in both sample types. While not identical both methods gave similar results. Predictably, the retention times did not match between the two chromatographic systems, with the metabolites eluting a consistent 3.8 min later in the HPLC-TOFMS system, but peaks were able to be identified none-the-less, through comparison and overlay (illustrations not included) and establishing the principal metabolites. The 2-hydroxysulphate (metabolite VII), seen in previous studies to be the major component in urine (Scarfe et al., 2002b) accounted for ca. 75% of the total by Br-selective ICPMS and 84% by TOFMS. The N-acetyl-O-glucuronide (metabolite VIII) accounted for ca. 9% by ICPMS and 5% by TOFMS). In the case of the biliary profiles the major Br-containing component in the 6–12 h bile – the hydroxylated N-acetyl compound (XII) – made up ∼65% of the total by ICPMS and 37% by TOFMS.
As we, and others have shown elsewhere, the presence of an ICP-detectable atom such as bromine (Abou Shakra et al., Citation2002; Marshall et al., Citation2002; Nicholson et al., Citation2000, Citation2001; Packert Jensen et al., Citation2005; Smith et al., Citation2008), iodine (Duckett et al., Citation2003, Citation2007; Packert Jensen et al., Citation2004a), sulphur (Corcoran et al., Citation2000; Gika et al., Citation2009; Packert Jensen et al., Citation2004b) and, to a lesser extent chlorine (Corcoran et al., Citation2000; Duckett et al., Citation2003, 2006) in a x enobiotic readily allows for the element specific detection and quantification of metabolites. Providing that the atom being measured is not lost through metabolism determining the concentrations of, for example, bromine in samples such as urine and bile is easily accomplished, allowing the ready determination of the time course of excretion of compound-related material. Subsequent element-specific metabolite profiling via HPLC-ICPMS then provides a quantitative picture of the relative proportions of the metabolites present to be obtained. When combined with conventional HPLC-MS results in both metabolite quantification and identification without the need for the use of radiotracers. Clearly, most compounds do not contain appropriate elements to enable this technical opportunity to be widely used. However, where such a possibility exists the benefits are clear.
Conclusions
The use of ICPMS, with direct injection of urine and bile samples has enabled a quantitative excretion balance study to be performed in bile-cannulated rats based on the selective detection of bromine. Subsequent metabolic profiling with HPLC-ICPMS and HPLC-oaTOFMS allowed the generation of metabolite profiles for both biofluids, and the identification of the major metabolites. The combination of these techniques has enabled the metabolic fate of 4-bromoaniline in the bile-cannulated rat to be characterised without the need to employ radiolabeled material as a tracer.
Declaration of interest
The Royal Society of Chemistry (Analytical Division), EPSRC, and AstraZeneca are acknowledged for the financial support to C. J. Duckett.
Acknowledgements
Dr. J. Castro-Perez is thanked for discussions and technical expertise.
References
- Abou-Shakra F, Sage AB, Castro-Perez J, et al. (2002). High-performance liquid chromatography–UV diode array, inductively-coupled plasma mass spectrometry (ICPMS) and orthogonal acceleration time-of- flight mass spectrometry (oa-TOFMS) applied to the simultaneous detection and identification of metabolites of 4-bromoaniline in rat urine. Chromatographia 55:S9–13
- Athersuch TJ, Wilson ID, Keun HC, Lindon JC. (2013). Development of quantitative structure-metabolism (QSMR) relationships for substituted anilines based on computational chemistry. Xenobiotica 43:1–11
- Corcoran O, Nicholson JK, Lenz EM, et al. (2000). Directly coupled liquid chromatography with inductively coupled plasma mass spectrometry and orthogonal acceleration time-of-flight mass spectrometry for the identification of drug metabolites in urine: application to diclofenac using chlorine and sulphur detection. Rapid Comm Mass Spectrom 14:2377–84
- Cuyckens F, Balcaen LI, De Wolf K, et al. (2008). Use of the bromine isotope ratio in HPLC-ICP-MS and HPLC-ESI-MS analysis of a new drug in development. Anal Bioanal Chem 390:1717–29
- Duckett CJ, Lindon JC, Walker H, et al. (2006). Metabolism of 3-chloro-4-fluoroaniline in rat using [14C]-radiolabelling, 19F NMR spectroscopy, HPLC-MS/MS. HPLC-ICPMS and HPLC-NMR. Xenobiotica 36:59–77
- Duckett CJ, Wilson ID, Douce DS, et al. (2007) Metabolism of 2-fluoro-4-iodoaniline in the earthworm Eisenia veneta using 19F NMR spectroscopy, HPLC-MS, and HPLC-ICPMS (127I). Xenobiotica 37:1378–93
- Duckett CJ, Wilson ID, Walker H, et al. (2003). High-performance liquid chromatography/inductively coupled plasma mass spectrometry with iodine-specific detection for profiling the metabolites produced in the earthworm Eisenia veneta by exposure to 2-fluoro-4-iodoaniline. Rapid Comm Mass Spectrom 17:1855–8
- Gammelgaard B, Hansen HR, Stürup S, Møller C. (2008). The use of inductively coupled plasma mass spectrometry as a detector in drug metabolism studies. Expert Opinion Drug Met Toxicol 4:1187–207
- Gika HG, Theodoridou A, Michopoulos F, et al. (2009). Determination of two COX-2 inhibitors in serum and synovial fluid of patients with inflammatory arthritis by ultra performance liquid chromatography-inductively coupled plasma mass spectrometry and quadrupole time-of-light mass spectrometry. J Pharm Biomed Anal 49:579–86
- Major H, Castro-Perez J, Nicholson JK, Wilson ID. (2003a). Characterisation of putative pentose-containing conjugates as minor metabolites of 4-bromoaniline present in the urine of rats following intraperitoneal administration. Rapid Comm Mass Spect 17:76–80
- Major H, Castro-Perez J, Nicholson JK, Wilson ID. (2003b). Detection of mono- and di-hexoses as metabolites of 4-bromoaniline using HPLC-TOF-MS/MS. Xenobiotica 33:855–69
- Marshall P, Heudi O, Mckeown S, et al. (2002). Study of bradykinin metabolism in human and rat plasma by liquid chromatography with inductively coupled plasma mass spectrometry and orthogonal acceleration time-of-flight mass spectrometry. Rapid Comm Mass Spect 16:220–8
- Meermann B, Bockx M, Laenen A, et al. (2012). Speciation analysis of bromine-containing drug metabolites in faeces samples from a human in vivo study by means of HPLC/ICP-MS combined with on-line isotope dilution. Anal Bioanal Chem 402:439–48
- Nicholson JK, Lindon JC, Scarfe G, et al. (2000). High-performance liquid chromatography and inductively coupled plasma mass spectrometry (HPLC-ICP-MS) for the analysis of xenobiotic metabolites in rat urine: application to the metabolites of 4-bromoaniline. Analyst 125:235–6
- Nicholson JK, Lindon JC, Scarfe GB, et al. (2001). High performance liquid chromatography linked to inductively coupled plasma spectrometery and orthogonal acceleration time-of-flight mass spectrometry for the simultaneous detection and identification of the metabolites of 2-bromo-4-trifluoromethyl-[13c]-acetanilide in the rat. Anal Chem 73:1491–4
- Packert Jensen B, Smith CJ, Wilson ID, Weidolf L. (2004a). Sulphur specific detection of omeprazole metabolites in urine by high performance liquid chromatography/inductively coupled plasma mass spectrometry. Rapid Comm Mass Spectrom 18:181–3
- Packert Jensen B, Smith CJ, Bailey C, et al. (2004b). Application of inductively coupled plasma mass spectrometry and high-performance liquid chromatography – with parallel electrospray mass spectrometry to the investigation of the disposition and metabolic fate of 2-, 3- and 4-iodobenzoic acids in the rat. J Chromatogr B 809:279–85
- Packert Jensen B, Smith CJ, Bailey CJ, et al. (2005). Investigation of the metabolic fate of 2-,3- and 4-bromobenzoic acids in bile-duct cannulated rats by inductively coupled plasma mass spectrometry and high-performance liquid chromatography/inductively coupled plasma mass spectrometry/electrospray mass spectrometry. Rapid Commun Mass Spectrom 19:519–24
- Scarfe GB, Wilson ID, Warne MA, et al. (2002a). Structure-metabolism relationships of substituted aniline: prediction of N-acetylation and N-oxanilic acid formation using computational chemistry. Xenobiotica 32:267–77
- Scarfe GB, Nicholson JK, Lindon JC, et al. (2002b). Identification of the urinary metabolites of 4-bromoaniline and 4-bromo-[carbonyl-13C]-acetanilide in rat. Xenobiotica 32:325–37
- Smith CJ, Shillingford S, Edge AM, et al. (2008). Quantification of the in vitro and in vivo metabolic fates of 2-, 3- and 4-bromobenzoic acids using high temperature LC coupled to ICP-MS and linear ion trap MS. Chromatographia 67:673–8