Abstract
Purpose: To describe the design, analysis and evaluation of a new antenna array system for microwave hyperthermia. The proposed antenna array was evaluated by the focusing method based on the time-reversal principle.
Materials and methods: Power absorption distributions in a cylindrical homogeneous and inhomogeneous phantom were calculated for the frequency range 500–900 MHz. Two set-ups with 12 and 16 antennas were analysed by comparing the changes in focusing areas enclosed by the 50%, 75% and 90% iso-SAR contours. For a more quantitative evaluation of the results the average power absorption ratio and remaining tissue maximum index were calculated.
Results: The sharpest focusing area in the centre of the phantom, 151 mm2 (9 × 20 mm) (90% iso-SAR), was obtained by using 16 antennas at frequency 900 MHz. The largest focusing area of 280 mm2 (13 × 24 mm) (90% iso-SAR) was obtained by using 16 antennas at 500 MHz. The SAR focus was steered in the desired radial direction obtaining a 43 mm2 90% iso-SAR focus-width in a semi-three-dimensional neck phantom. The results showed qualitative agreement between three dimensions (3D) and two dimensions (2D) for the performance indicators.
Conclusions: The conducted study confirms the feasibility of the time-reversal-based focusing methods for microwave hyperthermia. The proposed system shows promise and is suitable for further development in the treatment of head and neck tumours, and extremities application.
Introduction
A significant advantage of using hyperthermia combined with radiotherapy, and/or chemotherapy in the treatment of solid tumours, has been reported in a number of studies Citation[1–5]. The objective of hyperthermia treatment is to raise tumour temperatures to therapeutic levels long enough to achieve cell death or render cells more sensitive to ionising radiation or chemotherapy. One of the challenges of hyperthermia is how to adequately heat deep-seated tumours while protecting surrounding healthy tissue from undesired heating and damage.
In a previous paper we introduced a new method for planning hyperthermia treatment based on a time-reversal principle Citation[6]. To confirm the previous 2D numerical results we have designed an antenna array evaluated in 3D simulations. The system is aimed towards the treatment of head and neck (H&N) tumours. Selection of this region is two-fold. Firstly, this region is smaller in comparison with, for example, the pelvic area but still contains complicated structures with areas requiring protection from heat. Secondly, there is a clinical need for such an applicator. Hyperthermia in this area is achieved most often by superficial techniques not optimal for deep-seated tumours. Our design is based on the near-field, beam-forming approach, which employs an array of radiators placed circumferentially around the object Citation[7]. The constructive wave interference is controlled by the amplitude and phase changes at the feed points of the antennas by using the time-reversal method Citation[6], Citation[8].
A clinical prototype of a H&N annular phased array (aPA) applicator, was recently designed by Paulides et al. Citation[9–13]. They designed a 12-patch antenna system arranged in a double ring formation with six antennas in each ring. Our approach differs distinctly from this work, in particular with regard to the number of frequencies, as our system was designed for a broad frequency range. The optimal frequency for a specific treatment is dependent on the tumour positioning and size. This is in contrast to present heating equipment, which tends to work only at ISM frequencies allocated for industry, science and medicine in Europe Citation[14]. The only exceptions to a system when considering a multi-frequency approach are the applicators of Turner et al. Citation[15] and Nadobny et al. Citation[16] designed for pelvic tumour treatment. These systems have been extensively studied in terms of power and/or temperature distribution and examination with respect to optimisation algorithms, frequency, and number of antennas Citation[16–19]. Their system, including antenna array, in contrast to our system, is aimed at using considerably lower frequencies, thus penetrating a much larger pelvic region.
Another important advantage in the use of broadband antennas is that a small change in the antenna's surroundings gives rise to only a small change in the antenna's characteristics. This is important, since the matching of the antenna varies slightly with neck size and water bolus temperatures during treatment Citation[9]. The present study is based on a patch antenna system. This is in contrast to most applicators for deep hyperthermia, which often consist of an array of dipoles Citation[15–19], waveguides Citation[20] or cavity slot antennas Citation[21]. Notable exceptions are the patch antennas often used for superficial heating Citation[22], Citation[23].
Patch antennas offer the attractive features of low profile, low cost, low weight, conformability, and the fact that they can be fed by simple coaxial cables. However, they often provide only a limited bandwidth and have relatively large sizes in the microwave frequency range. In the last two decades much work has been devoted to enhancing the bandwidth of microstrip antennas using a variety of approaches, such as L-shaped probe feeds Citation[24], stacking configurations Citation[25], parasitic elements Citation[26–28], and novel slots Citation[29–33]. This has typically increased the 10-dB impedance bandwidth by 30–50%.
An overall aim of the present work to is to carry out a robust, systematic evaluation of a designed applicator in terms of appropriate evaluation indices, thus contributing to a framework for further benchmarking. In the first part, an antenna system was designed consisting of triangular microstrip antenna elements containing V-shaped slots and short-circuiting walls. In the second, we investigated the focusing capability of a system using a time-reversal algorithm.
Focusing remains one of the outstanding challenges of any system attempting to deposit energy in human tissue. Clinical applications are determined and limited largely by this property. In this paper, the amplitude and phase information for each individual element of the array, determined by using time-reversal procedure based on 2D FDTD, was investigated using a 3D numerical model of this system.
The rest of the study is presented as follows. Firstly, we discuss single antenna element design and its employment in the array system. Radiating properties of the single antenna element, as well as a complete antenna array, are discussed in the Results section. Investigation of focusing capabilities of the array, in terms of relevant performance indicators, is presented later in the same section. Here results have been presented in terms of power absorption distribution in two phantoms, with and without steering at feeding points of antenna elements. Finally, discussion and conclusions are presented.
Methods
Single antenna element design
The triangular shape was selected for its similar radiation properties to rectangular patches Citation[34–36]. It has the added advantage of being physically smaller Citation[35]. The dimensions of the antennas were further reduced by using a shorting wall connected to the edge of the patch and the ground plane Citation[35].
The wideband behaviour obtained is the result of the currents along the edges of the slots, which introduce additional resonances in conjunction with the resonance of the main patch. The slots also introduce capacitive reactance that counteracts the inductive reactance of the feed.
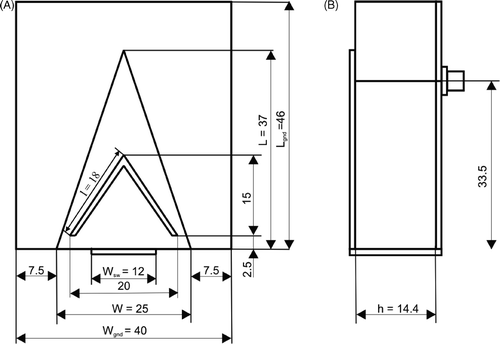
The geometry of the antenna element is shown in . The patch, being the shape of an isosceles triangle with length L = 37 mm and width W = 25 mm, is printed on the dielectric substrate with relative permittivity of εr = 2.34 and thickness of h = 14.4 mm. The substrate and ground plane are rectangular plates of length Lgnd = 46 mm and Wgnd = 40 mm. The antenna is excited by a probe feed via the centre of a coaxial transmission line positioned on the midline of the patch, at a distance df = 3.5 mm from the tip of the patch. The shorting wall is connected to the edge of the triangular patch and the ground plane. The shorting wall had a thickness of 1 mm. The V-shaped slot of 12 mm width is centred in the triangular patch, with the tip facing that of the triangle. The length of the outer edge is l = 18.1 mm with a distance d = 2.5 mm from the bottom of the patch.
Figure 1. Geometry of the proposed antenna. (A) Cross-sectional top view. (B) Cross-sectional side view.
During hyperthermia treatment a water bolus filled with demineralised water is typically placed between the body and the applicator. The water bolus reduces hot spots and improves impedance matching between the biological tissue and the antennas. In the antenna design proposed in this study, the patch antenna is immersed in the water bolus, which considerably decreases the operating frequency. The permittivity of the bolus affects the matching of the antenna. It is thus possible to tune the applicator to different frequencies by changing the permittivity from treatment to treatment.
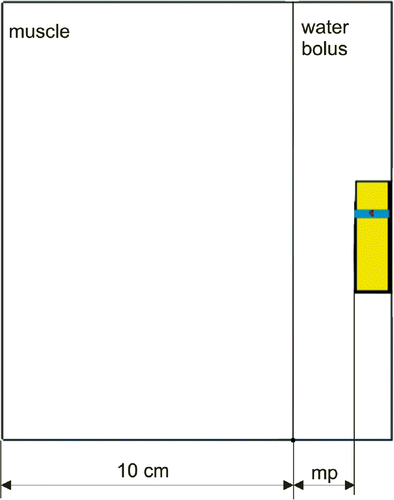
A muscle tissue load configuration, consisting of a single antenna element and a 12 cm thick slab of homogeneous muscle tissue phantom (εr = 56, σ = 0.8 S/m) is shown in . The distance between the phantom and the radiating elements mp was initially 2.45 cm, which corresponded approximately to λ/4 at the centre frequency.
Antenna array design
In our previous study Citation[6], we showed that a 12-antenna array system provided an acceptable compromise between performance and cost. This is also in concurrence with the conclusions of Paulides et al. Citation[10]. In order to investigate whether it is possible to reduce heating of the body surface, we have now additionally investigated two different 16-antenna arrays. One with a radius of 14 cm and one with a radius of 16.5 cm. Since we used 2D modelling to focus energy in 3D, we considered only a single ring arrangement in the present study.
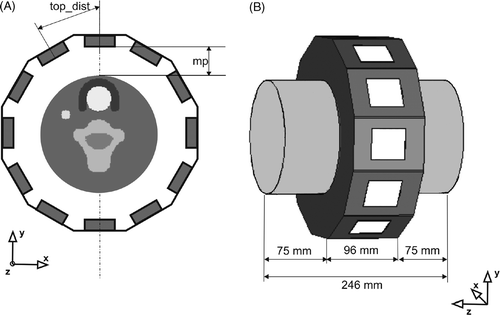
The configuration for the 12-antenna system is shown in with a phantom of biological tissues. The antenna system consists of elements arranged in a ring of radius 14 cm. This corresponds to a distance of 4 cm between the homogeneous phantom and radiating elements. The length of water bolus is 9.6 cm. The permittivity of the water bolus varied between 13 and 40 for the antenna to be resonant at the operating frequency, typically in the range 500 MHz to 900 MHz.
Two phantoms with a numerical resolution of 1 mm were considered. The first was a homogeneous muscle tissue phantom of 15 cm diameter used to investigate the focusing abilities of the designed array. The second was the Paulides Citation[13], semi-3D neck anatomy phantom of 13.5 cm diameter with a tumour radius of 5 mm, used during steering capability investigations of the proposed array; see . The dielectric properties of the structures used in both phantoms were calculated using the Cole–Cole parameters of Gabriel Citation[37]. The dielectric properties of the tumour were calculated using the parametric model proposed by Lazebnik et al. Citation[38]. We used the Cole–Cole parameters of their curve corresponding to the 75th percentile of the cancer samples containing 30% or more malignant tissue content. Note that Lazebnik parameters are specific for breast tumours and we used them in our neck analysis as they represent a very close, available, approximation. summarises the dielectric dispersion parameters of the used structures in the Cole–Cole model.
Table I. Dielectric parameters of Cole–Cole dispersion model used to predict the dielectric properties in the selected neck structures.
EM modelling and evaluation
In our focusing method the wave front of the source is propagated through the model of the patient from a virtual antenna placed in the desired focusing location. The simulated radiated field is then ‘measured’ using computer models of the surrounding antenna system. The real antenna system then transmits the field in a time-reversed order. It is the invariance of the wave equation during time reversal in a lossless media that enabled refocusing of a time-reversed signal from the original source. In the present set-up, a 2D finite-difference time-domain (FDTD)-based programme was used to calculate the amplitude and phase of each of the antenna elements, which were thus modelled as point sources. The refocusing stage was modelled using the 3D simulation package CST Microwave Studio 2008 (CST, Darmstadt, Germany) Citation[39], including a detailed model of the antenna array system.
The 2D modelling was carried out using the FDTD method. Generalised perfectly matched layer (GPML) boundary conditions were applied to terminate the borders of the computational domain. The field was propagated in a uniform rectangular grid 360 × 360 with a resolution of 1 mm. A typical computation took about 1 minute on a single cluster node of the C3SE system (4 Xeon 5160, 3 GHz core, 4 GB RAM).
The obtained phase and amplitude of each individual antenna were then used as input to the CST Microwave Studio model of the antenna array system with standard perfectly matched layer (PML) boundary conditions. For all simulations low-frequency refinement with maximal mesh step width 1 mm was used. This gave sufficient accuracy for the variable grid Citation[40]. A coaxial feeding line was replaced by a discrete port of S-parameter type. In the homogeneous phantom study, a magnetic (Ht = 0) symmetry of YZ and XZ planes was used, resulting in 3 million mesh cells. A study of a semi-3D model was carried out on the whole, resulting in 10 million mesh cells.
The power absorption distribution (PA) in each voxel could be obtained from the calculated electric field. Due to the constant mass density of ρ = 1000 kg/m3 assumed, the PA values correspond to the specific absorption rate (SAR) distribution:where σ [S/m] is the electrical conductivity of the tissue and |E| [V/m] is the magnitude of the electric field.
The evaluation of the SAR distributions was carried out by comparing the different cross-sections. The areas enclosed by the 50%, 75% and 90% iso-SAR contours were calculated in order to compare results quantitatively in terms of the change in focusing size, i.e. the region of high SAR values.
For a more quantitative evaluation of the results, the average power absorption ratio was calculated indicating the relative amount of energy absorbed in the tumour. It was defined as the ratio of PA in the tumour volume to the total PA distributed in the remaining tissue.
The sum in the denominator and the nominator of Equation 2 represents a summation of the tumour tissue volume and the non-tumour tissue volume respectively, and is the total number of volume elements of the tumour tissue and non-tumour tissue respectively.
This ratio enables comparison of different treatment scenarios, such as employment of a varying number of antennas. However, it is dependent on the sizes of the tumours. The applicator system's additional performance indicator is the remaining tissue maximum index (RTMi). This index is analogous to the muscle maximum index introduced by Kroeze et al. Citation[21]:Here PA50 is the median PA in the tumour and PA1 is the value indicating the highest percentile of the PA distribution in the remaining tissue. The RTMi provides a level of the highest percentile of the PA distribution in the remaining tissue with respect to the median value in the tumour.
For comparison, the 3D results were also compared with 2D exposure modelling. To achieve this, both aPA and RTMi, in the 3D modelling, were calculated in the plane of maximum focusing in a cross-section through the xy plane.
Results
Single antenna element analysis
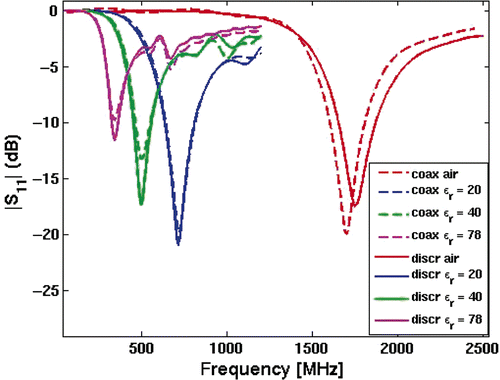
shows the return loss versus the centre frequency variation in the 350 to 1700 MHz range for the relative permittivities of the water bolus between 20 and 78 respectively, in the homogeneous muscle tissue load configuration as shown in . The dash lines represent the return loss of the antenna with the coaxial feeding and the solid lines are the return loss, when the coaxial feeding was approximated as a hard source. The results for these two cases are in good agreement and therefore the hard source approximation was used in the rest of the study.
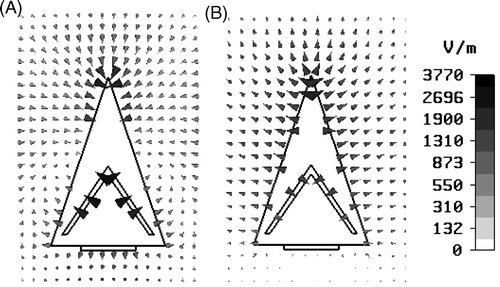
Changing the operating frequency obviously affects the radiation characteristic of the antenna. By changing the permittivity of the water bolus the wavelength remains approximately the same, while the wavelength of the guided wave in the antenna varies significantly, affecting the reactance of the antenna. Thus, a different mode of the antenna is excited, resulting in a different SAR distribution in the tissue. At frequencies below 450 MHz the excited patch surface current is strongly distributed near the bottom edge of the patch and around the edges of the slot, which appeared to be the TM20 mode Citation[34]. In the fundamental mode TM10, the currents flow mainly along the tip of the antenna as can be seen in .
Figure 5. E-field distribution along the patch at different frequencies. Cross-sectional top view. (A) 350 MHz; (B) 800 Mhz.
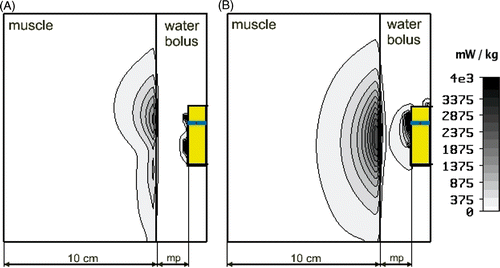
shows the SAR distributions in the muscle phantom for frequencies of 350 MHz and 800 MHz, respectively. The SAR distribution is more homogeneous in the high-frequency case. In the lower frequency range, the SAR distribution is shallower with maxima close to the feeding probe. The different radiation pattern is caused by the change of the operating frequency, while the details of the antenna, e.g. the distance between feeding probe and shorting wall, remain constant.
Figure 6. SAR distribution in muscle phantom for different frequencies. (A) f = 350 MHz; (B) f = 800 MHz.
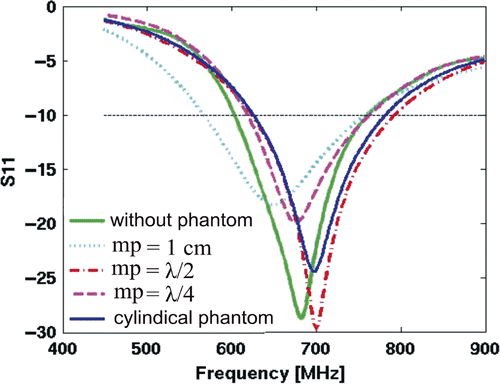
The placement of the lossy medium in the vicinity of the antenna strongly affects the impedance matching. The sensitivity of the design of to the distance from the muscle phantom is shown in . The influence of a phantom on the antenna characteristics is shown for several set-ups: first without phantom, then with a phantom layer at distances 1 cm, 2.45 cm and 4.9 cm. The latter two correspond to λbol/4 and λbol/2 respectively at centre frequency. The antenna characteristics were also investigated for a cylindrically shaped phantom with a distance of λbol/4 from the antenna. The optimal distance between the phantom and the applicator is in agreement with the theoretical predictions of λbol/4. The quality of the impedance matching degraded if the antenna was moved closer to, or farther from the phantom. Furthermore, the frequency shift of about 20 MHz could be observed in both these cases. However, the return loss still remained under -15 dB and, due to the broadband design, the frequency shift was not expected to cause significant changes in radiation characteristics.
SAR in homogeneous muscle phantom
To investigate the influence of mutual coupling between the antennas, they were placed at varying distances from each other in the configuration of .
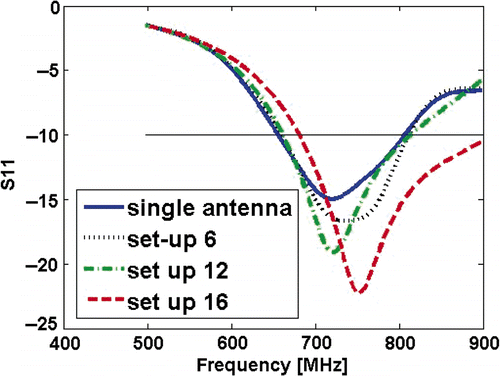
A comparison of the reflection coefficient for antenna number one versus the frequency for different numbers of array elements is shown in . Little influence was observed up to the 12-antenna arrangement, in which the distance between the adjacent antenna tips was ∼6 cm. With the 16-antenna set-up, somewhat larger coupling occurred, resulting in an increase of 25 Mhz in the resonance frequency peak. In this case the distance between the antenna tips was ∼4.8 cm, which was slightly less than λ/2. It can be concluded that the shape of the reflection characteristic remained intact, with improved matching quality to a distance of λ/2. The effects of mutual coupling on the SAR pattern are further discussed later.
The focusing ability of the antenna array was tested on a homogeneous muscle phantom of 15 cm diameter. In the configuration of , the Gaussian signal simultaneously excited the elements with the same amplitude and phase.
shows the areas enclosed by the centrally located 50%, 75% and 90% iso-SAR contours. It also contains the length and width of these areas. The results are presented for a ring of radius 14 cm with 12 antennas as well as for the set-up with 16 antennas placed in a ring of radius 16.5 cm. The results are presented for 5 different frequencies ranging from 500 MHz to 900 MHz. All simulations show that a central focusing was obtained and that iso-SAR areas decreased at higher frequencies. The effect of higher numbers of antennas can be seen from the decrease of the width of the focusing areas. Improved focusing with increasing frequency could also be observed from the reduced levels of hot spots on the surface of the phantom. This was present in both 12- and 16-antenna configurations, but was most significant in the latter. This was exemplified by the area enclosed by the 75% iso-SAR surface contour, at 500 Mhz, which was 83 mm2, whereas at 800 Mhz hot spots were only enclosed by the 50% iso-SAR with an area of 160 mm2.
Table II. The areas (mm2) enclosed by centrally located 50%, 75% and 90% iso-SAR contours and the length and width of the focus for set-ups of 12 and 16 antennas at various frequencies.
, which shows the obtained SAR distributions in the phantom at cross-section through y = 0 for the central settings of both the 12- and 16-antenna set-ups at two separate frequencies, illustrates the observation above. The figure shows the surface plots of the SAR distribution in the centre of the phantom. The levels corresponding to the significant SAR levels are shown as the contour lines in the figure. Below the 3D image, contour plots show the same iso-SAR levels. Note that for the 16-antenna configuration and lower frequencies the level of the hot spots on the surface of the phantom is higher than in the 12-antenna configuration. These peaks are of a local character and unlikely to cause problems. They can be attributed to the distance of the array and phantom, which in this case is close to one wavelength. An increase of the array radius partly solves this problem, since the effects of mutual coupling on the phantom surface diminishes. However, use of a larger array radius can cause coupling effects in the water bolus at higher frequencies, with increased energy loss. On the other hand, a smaller array radius results in stronger mutual coupling between antennas, which cause hot spots on the phantom surface at higher frequencies. This suggests the need for flexibility in the radius of the system for different operational frequencies. The effect of mutual coupling will later be seen in and . and it is further discussed in the next section.
Figure 9. The normalised SAR distributions calculated in the cross-section through the muscle phantom at y = 0 cm for (A) 12-antenna set-up, f = 500 MHz; (B) 12-antenna set-up, f = 800 MHz; (C) 16-antenna set-up, f = 500 MHz; (D) 16-antenna set-up, f = 800 Mhz. The axes are in mm.
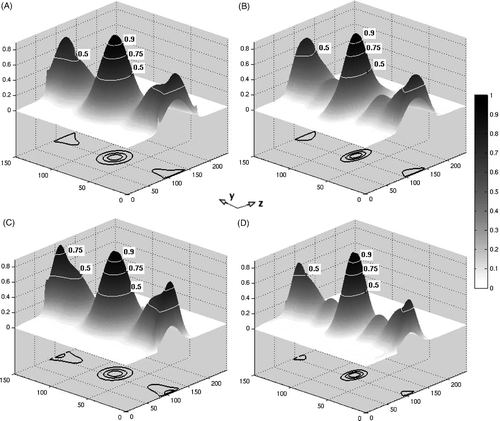
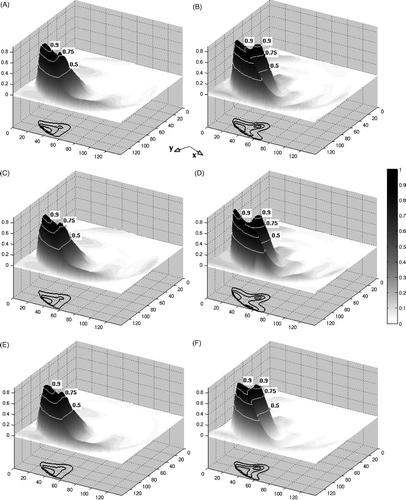
Figure 10. The normalised SAR distributions calculated in the cross-section through the semi-3D neck phantom containing tumour at z = 110 mm. The axes are in mm. (A)12-antenna set-up, frequency f = 500 MHz; (B)12-antenna set-up, f = 800 MHz; (C)16-antenna set-up, d = 16.5 cm, f = 500 MHz; (D)16-antenna set-up, d = 16.5 cm, f = 800 Mhz. (E)16-antenna set-up, d = 14 cm, f = 500 MHz; (F) 16-antenna set-up, d = 14 cm f = 800 Mhz.
SAR steering
In this section the antenna settings calculated in 2D were used for steering the SAR pattern in two separate cases. In the first case, we used a semi-3D anatomy phantom of 13.5 cm diameter without a tumour. In the second case, the same phantom containing a cylindrical tumour of 5 mm diameter was used, as depicted in . These two cases were considered for the analysis of the influence of tumour conductivity on the SAR pattern. Since the hot spots on the surface of the phantom occurred beneath the antenna array, and the maximum of the focused energy was shifted slightly in the axial direction, as seen in , we used the plane z = 110 mm.
shows calculated aPA ratios for the set-up with 12 antennas as well as for the set-up with 16 antennas and corresponding 2D simulations with 16 antennas. The effect of the present tumour phantom on the SAR pattern was small. In comparison with the 16-antenna case, the difference in aPA was only 0.15, which was almost negligible. The area of the 75% iso-SAR was quite similar for both 12- and 16-antenna systems.
Table III. aPA ratio calculated in 2D and 3D for phantom both with and without tumour. Frequency f = 800 Mhz.
The similarity of results for 12- and 16-antenna arrangements are clearly seen in , which shows the areas enclosed by the 75% and 90% iso-SAR contours in the main focusing areas and surface hot spots at five different frequencies. The plus sign in this table means that the given iso-SAR contour encloses both the focusing area and the surface hot spot. Similar to the case with the centrally focused SAR, the best ratio for the SAR distribution in the focusing area and the surface hot spots appeared in frequency range 700 to 800 Mhz. At frequencies below and above this range, only the area covered by 75% iso-SAR was achieved in the tumour.
Table IV. The areas (mm2) enclosed by 75% and 90% iso-SAR contours in the target for set-ups of 12 and 16 antennas at various frequencies.
A comparison of two 16-antennas arranged in an array with radii 14 and 16.5 cm, is presented in the same table. The area enclosed by 90% iso-SAR tended to be rather more extensive in the smaller array, often penetrating from the focusing region to the skin. Note in this case the significantly higher energy levels in the treated region, thus the 90% iso-SAR in tumour was achieved even at low frequencies. However, the level of energy absorbed on the phantom surface was significantly higher and had unfavourable impacts on aPA ratio, as shown in .
Figure 11. The average power absorption (aPA) ratio as a function of frequency for 12- and 16-antenna arrangements, calculated for both 2D and 3D.
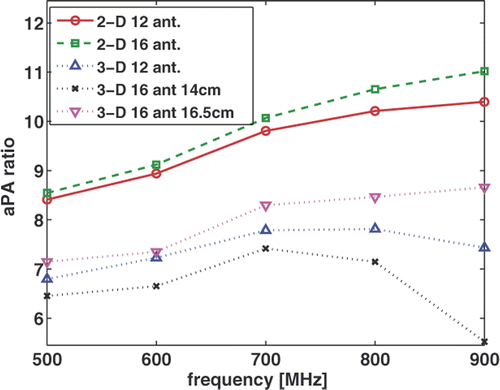
and show a comparison of the aPA ratio and the RTMi index for different numbers of antennas versus frequency in 2D with the results obtained in 3D. Good agreement was found between the performance indicators of the 3D case and those predicted by 2D simulations. The advantage of using more antennas is clearly seen at higher frequencies. The 2D simulations showed better performance indicators. This was as expected, since we have used 2D calculations to obtain phase and amplitude information and since the ring-like structure is not likely to be optimal for focusing in 3D.
Figure 12. The remaining tissue maximum index (RTMi) as a function of frequency for 12- and 16-antenna arrangements, calculated in both 2D and 3D.
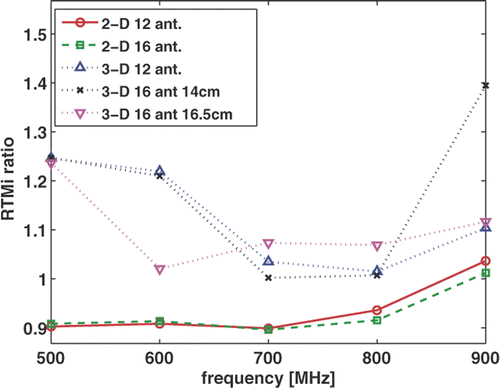
For both 2D and 3D, the positive influence of higher antenna numbers can be seen in and particularly at higher frequencies. The aPA ratio starts to plateau at 800 MHz with the 12-antenna set-up, whereas for the 16-antenna array of radius 16.5 cm, this does not occur until 900 MHz.
Discussion
In the present paper we have studied antenna arrays consisting of 12 and 16 patch antenna elements. The designed triangular microstrip antenna elements contained a V-shaped slot and short-circuiting wall. The designed antenna has a bandwidth of 170 MHz and the operating frequency band was further extended by the use of different water boluses with various permittivity. It should be noted that , , , and indicate single parameter variations and thus do not describe the complete scan of the combined parameter space.
We first investigated the focusing ability of the arrays on a 15 cm diameter homogeneous muscle tissue phantom. This size reasonably covers the H&N applications and applications on the extremities. The testing was carried out for a broad spectrum of frequencies and in all cases a central 90% iso-SAR focus was achieved. The sharpest focusing area was 151 mm2 (9 × 20 mm) of 90% iso-SAR, obtained by using 16-antennas at a frequency of 900 MHz. The largest focusing area was 280 mm2 (13 × 24) of 90% iso-SAR. It was obtained by using 16 antennas at 500 MHz. Thus, the largest number of antennas employed at the highest frequencies provides the best 90% iso-SAR focusing. Note that at the lower frequency of 500 MHz using only 12 antennas, we obtained a central 50% iso-SAR of 67 mm axially and 32 mm radially. This can be compared with the larger central 50% iso-SAR focusing area of 103 × 35 mm by Paulides et al. Citation[11].
In the latter part of the paper we focused on the steering ability of the proposed applicator, performing tests on semi-3D neck phantom of 5 mm radius, both with and without the tumour. The results showed considerable heating of the predetermined region in terms of the specific power absorption, with remarkably low heating of the surrounding region. A 90% iso-SAR focus of 43 mm2 was achieved in the tumour area, whereas 90% iso-SAR with a focusing area of 125 mm2 was absorbed at the surface of the phantom. Similar results were obtained if the tumour was replaced with a muscle-like phantom. Thus, the increase of conductivity of the tumour did not significantly affect the results.
We have shown earlier Citation[6] that 12 antennas are often sufficient for the considered application. This can also be seen in , which reveals that the 16-antenna arrangement provided slightly higher PA values in the focusing area and lower PA values on the surface of the phantom. It can be concluded that with a higher number of antennas a higher frequency can be used.
The obtained results correlated well with Paulides et al. Citation[10], who suggested that for 434 MHz a 16-antenna system improved focusing depths by 10% in comparison to the 12-antenna system. Other theoretical studies on focusing of multiple antenna rings have been conducted mainly for treatment in the pelvic region Citation[16–19], Citation[22]. It is interesting to note that Kroeze et al. Citation[21] also showed that 12 antennas were sufficient in that region. Other studies Citation[17], Citation[18] using power-based optimisation showed that increasing the number of antennas per ring was in many cases more favourable than increasing the number of antenna rings. Thus, for the later design of the multiple antenna ring array a two-ring set-up appears suitable. However, the number of elements in the ring might be higher than the typically recommended six antennas, since the aim of all the studies cited was to focus into larger tumours than those considered in this study.
In the present study, the focusing ability of the array was evaluated by 50%, 75% and 90% iso-SAR coverage, which provides more information than the clinically often used 25% and 50% iso-SAR coverage, used for instance by Paulides et al. Citation[11], Citation[12]. Better focusing contributes to the flexibility of the system and also allows it to operate in a low focusing mode. This can, for example, be achieved by moving the focusing region around during treatment. Large tumours can be treated by placing more virtual antennas on the perimeter of the tumour. Additionally, by switching to different amplitudes and phase settings, hot spots on the surface can be further reduced.
We note from that the aPA performance parameter varied little with the number of antennas in the system. This is in contrast to the 2D simulations presented in , which show a considerable difference in aPA, both with the number of antennas (at high frequencies) and with and without tumour (). The results presented here show qualitative agreement for 3D and 2D in terms of the performance indicators.
Conclusions
The target of the present work was to carry out robust systematic evaluation of a designed applicator in terms of appropriate evaluation indices, thus contributing to a framework for further benchmarking. In this paper we have evaluated the first simplified hyperthermia system aiming towards H&N treatment.
The overall constraint in the design of the single antenna, was that it should be able to operate in the frequency band 300 MHz–l GHz, which was achieved only by using different water boluses in different frequency regimes. The design constraint for the antenna array was to achieve constant characteristics under the treatment conditions, e.g. avoiding small movement changes or temperature changes in the water bolus during the treatment. A second constraint was the avoidance of antenna coupling, achieved by the employment of more antennas in the antenna ring.
The advantage of using more antennas is clearly seen at higher frequencies, particularly in 2D. However, we observed that an increased number of elements in the array resulted in increased mutual coupling, raising the question of the need for systems with flexible radii.
Generally, 2D simulations show better performance indicators than the corresponding 3D results. We believe that this is attributable to the single ring set-up and to the limited use of the 3D model in the time-reversal process. A further study will clarify this hypothesis.
Due to the single ring applicator in the present study, the variation of SAR distribution along the z-axis is somewhat uncontrollable. This problem can be alleviated by a more advanced applicator design, perhaps with a multi-ring system. We anticipate that optimisation of amplitude and phase using full 3D modelling can improve the focusing results even further.
In conclusion, while experimental verification is still in progress, the obtained results confirmed the feasibility of time-reversal-based focusing methods. As a result of decreased computational cost the use of a 2D-based time-reversal method such as that used in the present study could have clinical benefits with respect to speed and flexibility of the system, in spite of reduced accuracy. In a future study the present results will be compared and contrasted with simulated 3D time-reversal-based focusing, as well as with experimental results.
Declaration of interest: The authors report no conflicts of interest. The authors alone are responsible for the content and writing of the paper.
References
- Valdagni R, Amichetti M, Pani G. Radical radiation alone versus radical radiation plus microwave hyperthermia for N3 (TNM-UICC) neck nodes: A prospective randomized clinical trial. Int J Radiat Oncol Biol Phys 1988; 15(1)13–24
- Valdagni R, Amichetti M. Report of long-term follow-up in a randomized trial comparing radiation therapy and radiation therapy plus hyperthermia to metastatic lymph nodes in stage IV head and neck patients. Int J Radiat Oncol Biol Phys 1993; 28: 163–169
- Van der Zee J, Gonzáles Gonzáles D, Van Rhoon GC, van Dijk J, van Putten W, Hart A. Comparison of radiotherapy alone with radiotherapy plus hyperthermia in locally advanced pelvic tumours: A prospective, randomised, multicentre trial. Lancet 2000; 355: 1119–1125
- Jones EL, Oleson JR, Prosnitz LR, Samulski TV, Vujaskovic Z, Yu D, Sanders LL, Dewhirst MW. Randomized trial of hyperthermia and radiation for superficial tumors. J Clin Oncol 2005; 23: 3079–3085
- Issels RD, Lindner LH, Wust P, Hohenberger P, Jauch K, Daugaard S, Mansmann U, Hiddemann W, Blay J, Verweij J. Regional hyperthermia (RHT) improves response and survival when combined with systemic chemotherapy in the management of locally advanced, high grade soft tissue sarcomas (STS) of the extremities, the body wall and the abdomen: A phase III randomised pros. Clin. Oncol 2007 ASCO Annual Meeting Proceedings Part I., Vol 25, No. 18S(June 20 Supplement), Abs No. 10009
- Trefná H, Vrba J, Persson M. Time-reversal focusing in microwave hyperthermia for deep seated tumours. 2009, Submitted to Phys Med Biol
- Turner PF. Regional hyperthermia with an annular phased array. IEEE Trans Biomed Eng 1984; BME-31: 106–114
- Cassereau D, Fink M. Time-reversal of ultrasonic fields-part III: Theory of the closed time-reversal cavity. IEEE Trans Ultrason Ferroelectr Freq Control 1992; 39(5)579–592
- Paulides MM, Bakker JF, Chavannes M, van Rhoon GC. A patch antenna design for application in a phased-array head and neck hyperthermia applicator. IEEE Trans Biomed Eng 2007; 54: 2057–2063
- Paulides MM, Bakker JF, Zwamborn APM, van Rhoon GC. A head and neck hyperthermia applicator: Theoretical antenna array design. Int J Hyperth 2007; 23: 59–67
- Paulides MM, Bakker JF, van Rhoon GC. An electromagnetic head and neck hyperthermia applicator: Experimental phantom verification and FDTD model. Int J Radiat Oncol Biol Phys 2007; 68: 612–620
- Paulides MM, Bakker JF, Neufeld E, Van der Zee J, Jansen PP, Levendag PC, van Rhoon GC. The HYPERcollar: A novel applicator for hyperthermia in the head and neck. Int J Hyperth 2007; 23: 567–576
- Paulides MM, Wielheesen DHM, Van der Zee J, Van Rhoon GC. Assessment of the local SAR distortion by major anatomical structures in a cylindrical neck phantom. Int J Hyp 2005; 21: 125–140
- International Telecommunication Union. Introduction to international radio regulations: Article 5. www.itu.int. (accessed 07122009)
- Turner PF, Schaefermeyer T. BSD-2000 approach for deep local and regional hyperthermia: Clinical utility. Strahlenth Onkol 1989; 165: 700–704
- Nadobny J, Wlodarczyk W, Westhoff L, Gellermann J, Rau B, Monich B, Wust P. Development and evaluation of a three-dimensional hyperthermia applicator with Water-Coated antennas (WACOA). Int J Hyp 2003; 30: 2052–2064
- Wust P, Beck R, Fähling H, Seebass M, Wlodarczyk W, Hoffmann W, Nadobny J. Electric field distributions in a phased-array applicator with 12 channels: Measuring and numerical simulations. Med Phys 2000; 27: 2065–2579
- Seebass M, Beck R, Gellermann J, Nadobny J, Wust P. Electromagnetic phased arrays for regional hyperthermia: Optimal frequency and antenna arrangement. Int J Hyperth 2001; 17: 321–336
- Paulsen KD, Geimer S, Tang J, Boyse WE. Optimization of pelvic heating rate distributions with electromagnetic phased arrays. Int. J. Hyperth 1999; 15: 157–186
- Crezee J, Kok HP, Wiersma J. Improving locoregional hyperthermia equipment using 3D power control: From AMC-4 to AMC-8.. 14–15, In Abstracts ESHO-05 2005
- Kroeze H, Van de Kramer JB, De Leeuw AAC, Lagendijk JJW. Regional hyperthermia applicator design using FDTD modelling. Phys Med Biol 2001; 46: 1919–1935
- Samulski TV, Fessenden P, Lee ER, Kapp DS, Tanabe E, McEuen A. Spiral microstrip hyperthermia applicators: Technical design and clinical performance. Int J Radiat Oncol Biol Phys 1990; 18: 233–242
- Stauffer PR, Rossetto F, Leoncini M, Gentilli GB. Radiation patterns of dual concentric conductor microstrip antennas for superficial hyperthermia. IEEE Trans Biomed Eng 1998; 45: 605–613
- Lepage AC, Begaud X. A compact ultrawide band triangular patch antenna. Microw Opt Technol Lett 2004; 40: 287–289
- Jang Y-W. Experimental study of a broadband U-slot triangular patch antenna. Microw Opt Technol Lett 2002; 34: 325–327
- Waterhouse R. Small microstrip patch antenna. Electronics Letters 1995; 31: 604–605
- Sanad M. Effect of the shorting posts on short circuit microstrip antennas. In IEEE Ant Prop Symp 1994; 794–797
- Guo YX, Luk MK, Lee KF. Dual-band slot-loaded short-circuited patch antenna. Electron Lett 2000; 36: 289–291
- Li Y, Chair R, Luk MK, Lee KF. Broadband triangular patch antenna with folded shorting wall. IEEE Ant Wireless Prop Lett 2004; 3: 189–192
- Row J-S, Liou Y-Y. Broadband short-circuited triangular patch antenna. IEEE Trans Ant Prop 2006; 54: 2137–2141
- Liou Y-Y, Row J-S, Chen T-R. Dual-frequency design of a shorted triangular patch antenna. Microw Opt Technol Lett 2006; 48: 749–751
- Wong KL, Pan M-C, Hsu W-H. Single-feed dual-frequency triangular microstrip antenna with a V-shaped slot. Microw Opt Technol Lett 1999; 20: 133–134
- Lu J-H, Tang C-L, Wong K-L. Novel dual-frequency and broad-band designs of slot-loaded equilateral triangular microstrip antennas. IEEE Trans Ant Prop 2000; 48: 1048–1054
- Hassani HR, Mirshekar-Syahkal D. Analysis of triangular patch antennas including radome effects. IEE Proceedings-H 1992; 139: 251–256
- Nasimuddin, Esselle K, Verma AK. Resonance frequency of an equilateral triangular microstrip antenna. Microw Opt Technol Lett 2005; 47: 485–489
- Lee K-F, Luk M-K, Dahele JS. Characteristic of the equilateral triangular patch antenna. IEEE Trans Ant Prop 1988; 36: 1510–1518
- Gabriel S, Lau RW, Gabriel C. The dielectric properties of biological tissues: III. Parametric models for the dielectric spectrum of tissues. Phys Med Biol 1996; 41: 2271–2293
- Lazebnik M, Popovic D, McCartney L, Watkins CB, Lindstrom MJ, Harter J, Sewall S, Ogilvie T, Magliocco A, Breslin TM, et al. A large-scale study of the ultrawideband microwave dielectric properties of normal, benign, and malignant breast tissues obtained from cancer surgeries. Phys Med Biol 2007; 52: 6093–6115
- CST Microwave studio, CST GmbH. Bad Nauheimer Str. 19, 64289 Darmstadt, http://www.cst.com (accessed 07122009).
- Rossetto F, Stauffer PR, Manfrini V, Diederich CJ, Gentili GB. Effect of practical layered dielectric loads on SAR patterns from dual concentric conductor microstrip antennas. Int J Hyperthermia 1998; 14: 553–571
