
Abstract
Intraoperative radiotherapy (IORT) is continuously gaining ground in cancer treatment. However, there is currently no planning system associated with these devices, which precludes patient-specific dose delivery optimization. The objective of this study was the development and validation of a Monte Carlo simulation (MCS)-based dosimetry platform using the Intrabeam™ system.
Methods. After surgical resection of the tumor this system delivers a single dose fraction at the surface of an applicator irradiating the tumor bed through a 50 kV x-ray beam. The GATE MCS platform was used in this study combining the phase space obtained by modeling the x-ray source and the detailed modeling of the additional parts of the Intrabeam™ system. The model was validated by comparing simulated versus experimental measurements of depth dose curves (DDC) and isotropy. A clinical validation study was also carried out using patient computed tomography images.
Results. The mean deviation between measured and simulated DDC was 2.9% ± 4.4% and 5.9% ± 5.7% for the bare needle and the use of applicators, respectively. A good agreement with experimental measurements was also found in terms of dose isotropy with a maximum difference of 2.04% for the 40 mm diameter applicator. A patient study revealed a mean absolute deviation of 0.06 Gy between simulated and thermoluminescent dosimeters (TLD) measured skin doses.
Conclusion. This study shows the potential of using the GATE MCS platform to model three-dimensional dose distributions of the Intrabeam™ system for use in IORT.
The aim of partial breast irradiation (PBI) is to reduce the risk of local recurrence in the tumor bed following breast surgery. Within this context different techniques have been described, using interstitial brachytherapy (low or high dose rate), Mammosite (balloon), electron or photon intraoperative radiation therapy (IORT) or external beam radiation therapy (EBRT) [Citation1]. The approach of partial intraoperative breast irradiation with electron or photon beams is particularly attractive since it offers the possibility of a single unified radiosurgical treatment [Citation2]. The surgical lumpectomy is in this case immediately followed by PBI, the whole process requiring approximately 2–3 hours. Therefore this approach reduces overall treatment time and cost associated with the use of multi-fraction EBRT following breast surgery given the necessary transportation costs and inconvenience. The main difficulty is to obtain accurate and reliable data on the histological resection margins or the presence of an extensive intraductal component, which could imply that the patient would benefit from irradiation of the entire gland [Citation1,Citation2].
Current IORT protocols using the Intrabeam™ system in breast cancer apply a single dose fraction of 20 Gy at the applicator surface to all patients [Citation2]. The current lack of a personalized dose prescription in the case of IORT may be questioned considering European recommendations of individual dose optimization [Citation3]. In addition, the dose distribution delivered to tissues is not known, and therefore cannot be optimized. Within this context several factors come into play. Firstly, at 50 kV, the dose gradient is so high that any measurements associated with significant uncertainty related to the positioning accuracy of the detector. Second, the low-energy photon spectrum varies rapidly with depth, which makes it difficult to measure since detector response to low energy photons is usually energy dependent. Consequently precise dose calculation and measurements need to take into account the evolution of the spectrum with depth. Finally, at 50 kV (and considering an average energy of 27.02 ± 8.80 keV at the surface of the applicator) water is not exactly a tissue equivalent material. Furthermore, the assumption of considering a patient as a simple water box may not be appropriate in terms of accurate dose calculation, particularly in regions where variable tissue densities and heterogeneities may be present. In order to overcome these limitations, we propose in this work the development of a Monte Carlo (MC) dose calculation platform for the Intrabeam™ system. The proposed development has been carried out using the Geant4 Application for Emission Tomography (GATE) platform [Citation4] to model the x-ray source (XRS) and simulate realistic patient conditions.
The first objective of the present work was the modeling of the Intrabeam™ XRS and validation of the model by comparison of simulated and measured dose distributions in a water phantom. In the second phase of this study the capabilities of the proposed IORT dosimetry platform were evaluated using patient computed tomography (CT) images. In-vivo measurements during patient irradiation were performed using thermoluminescent detectors (TLD) positioned on the skin surface.
Material and methods
Device description
The mobile miniaturized radiation source of the Intrabeam™ (Supplementary Figure 1, to be found online at http://informahealthcare.com/doi/abs/10.3109/0284186X.2015.1016623) produces x-rays by emitting and focusing an electron beam in the electron gun, accelerating the beam with a mean energy of 50 keV and a Gaussian distribution with 5 keV full width at half maximum [Citation5]. The beam then travels down an evacuated tube to strike a thin gold hemispherical target (0.5 μm thick) that lies on the inside end of the tube. The resulting beam consists of x-ray photons coming from the interactions of the electron beam with the gold target filtered by the beryllium layer. Both Bremsstrahlung x-rays and characteristic line radiations are emitted from the tip of the tube with an isotropic photon emission. Depending on the clinical application, various applicator types can be attached to the XRS. Spherical applicators made of polyetherimide material (15–50 mm) are used to deliver radiation to the tumor bed [Citation6–9].
GATE Monte-Carlo simulation
The GATE MCS platform [Citation4] was used to model the XRS and to perform associated dosimetry calculations on phantom and patient datasets. This modeling was separated into two parts. The first part concerns the XRS, which is invariable and patient independent, while the second part included the patient/phantom description and certain variable device parts such as the applicator.The flexibility of GATE and the versatility of its macro interface allow the modeling of physical and geometrical characteristics of the different components of the XRS, the applicators and the phantom according to manufacturer specifications.
Generated particles were collected in a virtual space called phase space (PHS). The PHS is more precisely developed to store the particles coming from the patient independent part, and is stored to a volume of user defined size, including the characteristics of each particle (type, direction, energy…). In this simulation, the PHS was defined as a hemispherical volume with a diameter of 3.2 mm and a thickness of 1 nm in the z direction. It was used to simulate the fluency of derived photons and their interactions with the media dependent part (applicator/patient). The PHS file was recorded at the surface of the hemispherical bare probe. Once the particle goes outside this surface it is saved in the PHS file without any further scattering. To focus on the Bremsstrahlung interactions we used the standard energy physics list within GATE which takes into account photon paths from 1 keV to 1 TeV. One billion particles were stored in the PHS file (total file volume of 15.2 GB stored as a ROOT file). All MCSs were performed with 109 particles and carried out on a cluster of 200 CPUs (2.74 GHz, 2 GB/CPU).
An energy/dose scoring tool associated with statistical uncertainty implemented within GATE was used to calculate the energy deposition and absorbed dose in a matrix of dose voxels. The voxel size was 1.75 × 1.75 × 1.75 mm3, which corresponds to the 5.3 mm3 sensitive volume of the ionization chamber (IC) used for the comparative measurements. The dose uncertainty obtained from GATE simulations was evaluated according to several criteria. The actor calculates the deposited energy in MeV (Edep), the absorbed dose D in Gy, the number of hits (a hit occurs each time a primary or secondary particle makes a step in a volume, with or without energy deposition), and the local statistical uncertainty according to [Citation10]. The squared sum of Edep and D are also provided and can be used to compute the statistical uncertainty when the simulation is split into multiple runs to improve computational efficiency. Equation 1 defines the statistical uncertainty εk at pixel k, with N being the number of primary events, dkt the deposited energy in pixel k at primary event t [Citation10–12]. Sk is an estimate of the standard error of the mean dose in voxel k.
GATE provides both the absolute dose value and the statistical uncertainty associated to this dose.
Using CT images as simulation input requires a method to relate the Hounsfield unit (HU) values of the input image to Geant4 materials. The stoichiometric calibration implemented in GATE is described by Schneider et al. [Citation13] and recommended by the AAPM TG-186 [Citation14]. The procedure is based on a user-defined mass density tolerance parameter and two calibration files describing the piecewise linear correspondence between CT numbers and mass density, and a list of material compositions. The tolerance parameter can be used to tune the number of materials depending on the accuracy required in the simulation. The list of materials generated and the correspondence between materials and HU values are stored and can be used for converting any CT image into materials.
Validation on water
Independent verification of depth dose curves (DDCs) and isotropy was carried out using a water phantom specifically designed for low energy XRS. Measurements were carried out at different source-detector distances by integrating the resulting signal for 60 seconds at each position. DDCs were measured using a 5.3 mm3 soft x-ray PTW IC (34013 type), which is a plane parallel chamber with thin membranes designed for low energy x-rays. The chamber was connected to an UNIDOS™ electrometer measuring electrical charges which are corrected and converted into dose rate. This IC used in this study is the same as the one used by Rivard et al., on the Xoft Axxent XRS [Citation15]. Isotropy was checked by measuring the charge at eight successive incremental (45°) rotations of the radiator with the IC inserted beside the probe (Supplementary Figure 2, to be found online at http://informahealthcare.com/doi/abs/10.3109/0284186X.2015.1016623). The deviation of the eight values from their average allowed the calculation of the isotropy that should have a maximum variation of 15% in all directions according to manufacturer specifications.
Using GATE, DDCs and isotropy were simulated under the same conditions as in the experimental set-up and with the same volume as the IC for each slice under the source along the z-axis. For isotropy the angle 0° is chosen arbitrary on GATE and the source is subsequently turning on itself around the z axis by steps of 45°. The maximum difference between measured and simulated results should be < 5% (considering the tolerance of radiotherapy treatment planning systems in general). In this study the maximum difference obtained was 2.04%.
Clinical study
In order to evaluate the GATE Intrabeam™ modeling within a clinical context, x-ray CT images of a patient were acquired during IORT after insertion of the applicator into the excision cavity following lumpectomy. Different steps were necessary to specify these dosimetric measurements according to the specifications of measurement methodology from the APPM Update of the AAPM TG43 [Citation16]. Images were acquired with a Somatom Sensation Open CT scanner (SIEMENS Medical, Erlangen, Germany) at 120 kVp with a slice thickness of 2 mm. To ensure sterilization during the transit, a sterilized support to maintain the applicator and a sterile cover close to the surgical site were used.
In vivo dosimetry measurements were performed using seven TLD packs placed equidistant around the incision to quantify the skin dose. Results were compared with GATE by measuring the dose at the same position.
The calibration of TLDs (LiF: Mg, 3 × 3× 1 mm3, TLD700) was done using the proposed methodology by Eaton et al. and the suggestions of Kron et al. [Citation17,Citation18]. Typically, four TLDs were used per packet in order to exclude outliers and reduce the standard deviation of measurements. As TLD measurements provide a relative dosimetry, the dose is determined by comparing the response of a given TLD to the response of a reference dosimeter, which has been irradiated at a point where the dose is precisely known. The unknown dose received by the patient TLDs was calculated using the individual calibration factor of the TLD rods relating their reading to the IC reading which received a known dose. In this study, the reference dosimeter is the IC described in the section ‘Validation on water’. A scaling factor of 1.004 provided by PTW in order to correct for the PMMA thickness of the inserts was used. The TLDs were handled with tweezers and read out in a manual TLD reader (Harshaw 3500, Thermo Scientific™, OH, USA) with a preheat temperature of 140°C and with a 300°C acquisition temperature. All dosimeters were annealed with a dedicated annealing oven (FIMEL, France) at 400°C for one hour and cooled down to 100°C during two hours. The provided simulated dose values are doses to tissue. A relative conversion factor was obtained by comparing TLD responses in water and TLD responses in real tissue. This was achieved by using TLDs inserted under different thicknesses of pig tissue and comparing the response with TLDs under the same depths of water. A geometrical correction was performed by systematically taking into account the thickness of the TLDs.
Absolute dose calibration
As a second validation step an absolute dose comparison was carried out using a different approach. First, a calibration step was necessary due to the low fluency of photons which imply very low doses with GATE. This calibration of the simulated XRS in terms of absolute dose per irradiation time was performed using two distinct steps [Citation19]:
Conventional calibration of the beam, by measuring the dose in water Dw per irradiation time (t↓trr); D↓w/t↓trr (Gy/min) at different depths from the surface of the bare probe. Reference measurements were defined as DDCs measured with the IC described above (section ‘Validation study’).
GATE simulations of the exact same set-up and associated conditions, using particles from the PHS, in order to obtain DGate per simulated particle at the same water depths: DGate/N, where N is the number of simulated particles.
A calibration factor FQ depending on the beam quality (50 kV x-ray photons) and the number of particles per irradiation time was subsequently derived using:
where, ttrr is the irradiation time during an IORT procedure. Following this calibration step and as a second stage of the absolute dose comparison process, the beam simulation in water was replaced by the clinical treatment simulation using patient CT images. The beam obtained from the PHS was adjusted given the appropriate applicator size. The beam generated during MCSs yields a dose DPGate at the point P corresponding to the skin position where each TLD was placed during treatment. The absolute dose at P, Dp (in Gy), is given by:
A calibration factor of FQ = 1.063.1014 N/min was obtained for the 40 mm applicator diameter.
Dosimetric uncertainties analysis
In order to determine the accuracy of the measurements and calculations, uncertainties analysis was performed according to the AAPM TG-138 report and GEC-ESTRO brachytherapy dosimetry uncertainty recommendations [Citation20]. Uncertainties analyses include all dosimetric properties of clinical XRS and all factors that could possibly influence the result of a measurement or calculations. Generic uncertainty assessments have been performed for experimental measurements using IC and TLDs, and MC methods for radiation transport calculations. The uncertainty in TLD measurements has several components, some of which correspond to type A including reproducibility and calibration and some of type B, such as the lack of backscatter and their position on the skin. These uncertainties have been assessed as discussed by the International Atomic Energy Agency in the calibration documentation [Citation20,Citation21]. However, Monte Carlo uncertainties (statistical uncertainties, XRS and Applicator geometry and motions, source energy spectrum) have been calculated using the recommendations of the AAPM TG-43 update and the TG 138 [Citation16,Citation20]. Type A and B components correspond to statistical and systematic uncertainties, respectively. All values provided are for 1σ.
Results
shows the Monte Carlo simulation on the patient CT volume with the dose deposition and compares the difference in the use of the shielding or not. shows the energy spectrum output of the bare needle in air obtained from the PHS. The mean energy was 20.64 ± 10.48 keV while a peak at the energy of 10 keV was observed which corresponds to the dominating Au-Lβ-fluorescence. shows the energy spectrum for the 40 mm-applicator calculated in GATE using the PHS produced from the bare needle. In this configuration when the applicator is used, the characteristic Au-L-lines are almost suppressed. The shape of the spectrum is globally independent of applicator size. The main difference is the Au-L-lines which are increasingly attenuated with larger applicator sizes. The mean energies obtained were 26.54 ± 8.90 keV, 26.36 ± 8.90 keV, 27.02 ± 8.80 keV, 27.12 ± 8.80 keV, and 28 ± 8.80 keV for applicator diameters increasing in steps of 5 mm from 30 mm to 50 mm. The mean energy for the 30 mm diameter applicator is higher than the 35 mm one due to an additional aluminum filter inserted in order to attenuate the beam.
Figure 1. Comparison of the dose distribution of an IORT treatment, respectively without shielding on the left and with shielding placed on the pectoral muscle on the right.
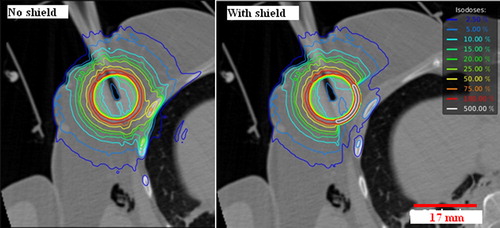
Figure 2. Validation on water: output energy spectrum computed in air (a) for the bare needle source, and (b) for the 40 mm-applicator. Depth dose curves (DDC) for the bare needle(c) and the 40 mm-applicator (d). Relative dose is presented as a function of the depth in water. Experimental measurements have been done using a 5.3 mm3 soft x-ray PTW IC (34013 type). The error bars represent the relative deviation between calculated and measurement value. Polar plot showing the angular distribution of the dose for the bare probe (e) and the 40 mm-applicator (f). A comparison between MC (dotted lines) and experimental measurements (full lines) is shown.
Measured and MC computed normalized DDC for the 50 kV beam without and with the 40 mm-applicator () show a maximum difference of about 6% for the 40 mm applicator and 2.3% for the bare needle, with a maximum GATE uncertainty of, respectively, 0.2% and 0.04% for the applicator and bare needle (). The polar plot shows the angular distribution of the dose for the bare probe (e) and the 40 mm-applicator (f), considering both the MCS and experimental measurements. The mean measurement uncertainties with GATE were 0.25% ± 0.14% and 0.080% ± 0.001% for the bare probe and the applicator, respectively. For the bare needle, the maximum deviation from the mean value was2.04% at 225° and 315° for the GATE simulations, compared to the measured maximum deviation of -0.97%. However, the minimum deviation was -0.61% at 135° for GATE versus –1% for the measurements. For the 40 mm-applicator, the deviation from the mean value was in the range of −1.53%–0.11% and −1.45%–0.14% for the simulations and measurements, respectively. Our results confirm the manufacturer specifications (< 15%).Concerning patient study, the comparison has been performed between clinically measured doses using the TLDs and the corresponding MCS results using the patient CT images (). The mean absolute deviation was 0.06 ± 0.09 Gy with a maximum of 0.29 Gy and a minimum of 0 Gy for a distance of 50 mm and 35 mm from the center of the applicator, respectively. The mean statistical uncertainties with GATE simulations were less than 0.8%.
Table I. GATE uncertainties and relative deviation between measured and simulated results.
Table II. TLD measurements and corresponding doses from the patient simulation study using the 40 mm diameter applicator.
The overall required times for dose calculations in water without and with an applicator was 1.5 hours and 1.75 hours, respectively. For the patient-specific CT-based dosimetry study the computation time was four hours and 46 hours with and without the use of the PHS, respectively, on a single CPU (INTEL Core i7 4770, frequency of 3.4 GHz).
Supplementary Table I (available online at http://www.informahealthcare.com) provides a summary of the uncertainties estimation for the current study. Monte Carlo uncertainties were estimated to be approximately 3.4%. This result is in accordance with Rivard et al. who found 2.5% and 5% for the Monte Carlo uncertainties of different radius size for an I-125 seed. Dolan et al. found a MC uncertainty of 1.76% for the I-125 seed dosimetry showing good agreement with our value if considering the methodology [Citation16,Citation22]. Based on the evaluation of uncertainties related to TLD measurements in this study the total quoted uncertainty was 16.6%, including lack of backscatter (5%), energy response (8%) and variation in the TLD position on the skin (10%), showing good agreement with previously reported values. The minimum uncertainty according to AAPM TG 61 in the determination of the absorbed dose in water, Dw (z) (Gy) at a specific location z was ± 5.3%.
Discussion
Current use of IORT is based on the prescription and assumed delivery of a fixed dose without considering the potential differences associated with patient-specific anatomy and corresponding tissue characteristics. However, it would be of interest to be able to determine the three-dimensional (3D) dose distribution for each individual patient in order to personalize treatment planning and/or eventually validate the use of a standard prescribed dose. The aim of this study was therefore the development and validation of a MC dosimetry platform for IORT applications based on the use of the Intrabeam™ system. This development was based on the use of the GATE platform. Accurate physical settings were made possible by the development of advanced energy/dose scoring tools and the definition of a PHS allowing a reduction in the overall simulation computational cost.
More specifically, the relative dose distribution measured for the bare source needle indicates a good agreement between measurements and the MCS results. The addition of the applicators obviously results in an alteration of the dose distribution when compared with the bare needle due to their construction characteristics. This change was accurately reproduced by the developed GATE model as shown on the energy spectrum obtained at the surface of the applicator. Finally, although differences between real measured data and GATE measurements were very small close to the tip of the source, they increased with depth because of the very small measured dose magnitudes and the small number of simulated events at those larger distances compared with photon fluency in realistic treatment. Concerning the angular distribution of the XRS emissions around the probe, the simulation results revealed a good conformity with the experimental measurements, confirming the specification of 15% maximal difference provided by the manufacturer. The distribution isotropy was confirmed based on the different circular and concentric isodoses obtained for the bare needle and the 40 mm diameter applicator.
A CT acquisition of a patient was carried out with the applicator in place to obtain the information on source position and the distance between the applicator surface and the skin with sufficient precision for a patient-specific dosimetry validation study. These CT images were used in combination with the GATE XRS model to produce patient-specific 3D dose distribution maps. The results demonstrate a good agreement between TLD measurements and GATE dose results at the same patient skin positions. The patient skin recorded doses ranging from 0.2 Gy to 1.5 Gy are below the threshold for severe skin toxicity (< 6 Gy) and reflect the different tissue thicknesses overlying the applicator. Our single patient dose values are within the range of those recorded by Fogg et al. with a reported maximum average dose of 2.93 ± 1.46 Gy and Eaton et al. [Citation18] with a mean measured skin dose of 2.9 ± 1.6 Gy.
Another significant observation is the doses to normal structures, such as the rib bones, heart and lungs, depending on the depth of the incision and the treated breast side. In order to reduce the dose to such critical structures, the surgeon uses a spherical shielding made of tungsten-impregnated silicone (lead equivalent 0.05 mm) which reduces the doses from 25% to 60% as shown in .
To achieve personalized intraoperative dosimetry, several elements are needed including a Monte Carlo dosimetry platform, patient-specific images and the applicator position. Associating these elements within a “treatment planning system” would allow an inverse dosimetry for patient-specific treatment. In this study we have performed MC calculations of the dose using intraoperative CT imaging, which remains complicated and time consuming to envisage for every patient. For this reason an alternative scenario can be considered based on pre-operative CT images similar to those used for treatment planning in EBRT. These pre-operative CT images can be subsequently used in conjunction with intraoperative x-ray C-arm imaging device to guide the positioning of the applicator in the tumor cavity based on the pre-operative dose planning using the acquired CT images. We are currently studying the clinical feasibility of such an approach using pre-operative CT imaging in particular for breast and spinal metastases applications. Finally, in terms of computational time the current performance of the GATE MCS platform is not compatible with a potential clinical use, even if one considers the use of pre-operative CT imaging and subsequent treatment planning. However, the necessary computational times are expected to be dramatically reduced in the future by using hybrid computing architectures, such as graphical card units (GPUs), including recently proposed implementations for Geant4 based MCSs both in imaging and radiotherapy applications [Citation23–25].
In this study the accuracy of the XRS model was validated, showing good agreement between experimental measurements and simulated results considering a simple water phantom as well as on a single patient study using intraoperative patient CT images that allow accounting for the presence of heterogeneous tissues in the irradiation field. A future study will concentrate on an extended clinical validation of MC-based intraoperative treatment planning and guidance based on pre-operative CT images. Such a future IORT treatment framework based on the proposed dosimetry platform should ensure patient-specific dose optimization and delivery based on accounting for patient-specific tissue heterogeneities and a better precision in applicator placement during IORT treatment.
Supplementary material available online
Supplementary Figure 1-2, Supplementary Table I to be found online at http://informahealthcare.com/doi/abs/10.3109/0284186X.2015.1016623.
ionc_a_1016623_sm1428.pdf
Download PDF (325.9 KB)Acknowledgments
The authors would like to thank the Carl Zeiss Surgical Group, for helpful information on the applicators’ characteristics used in the Intrabeam™ system. This work was funded by a grant (DOSEVAL) from the National Institute of Cancer (INCa) in France. The authors report no conflicts of interest. The authors alone are responsible for the content and writing of the paper.
Declaration of interest: The authors report no conflicts of interest. The authors alone are responsible for the content and writing of the paper.
References
- Hannoun-Lévi JM, Marsiglia H, Garbay JR, Gérard JP. Irradiation partielle du sein: Pourquoi, comment ? Cancer/Radiothérapie 2003;7:200–9.
- Vaidya JS, Tobias JS, Baum M, Wenz F, Kraus-Tiefenbacher U, D’Souza D, et al. TARGeted Intraoperative radiotherapy (TARGIT): An innovative approach to partial-breast irradiation. Semin Radiat Oncol 2005;15:84–91.
- Nuis. directive 97/43 euratom du conseil. 1997.
- Jan S, Benoit D, Becheva E, Carlier T, Cassol F, Descourt P, et al. GATE V6: A major enhancement of the GATE simulation platform enabling modelling of CT and radiotherapy. Phys Med Biol 2011;56:881–901.
- Clausen S, Schneider F, Jahnke L, Fleckenstein J, Hesser J, Glatting G, et al. A Monte Carlo based source model for dose calculation of endovaginal TARGIT brachytherapy with INTRABEAM and a cylindrical applicator. Z Med Phys 2012;22:197–204.
- Yanch JC, Harte KJ. Monte Carlo simulation of a miniature, radiosurgery x-ray tube using the ITS 3.0 coupled electron-photon transport code. Med Phys 1996;23:1551–8.
- Beatty J, Biggs PJ, Gall K, Okunieff P, Pardo FS, Harte KJ, et al. A new miniature X-ray device for interstitial radiosurgery: Dosimetry. Med Phys 1996;23:53–62.
- Dinsmore M, Harte KJ, Sliski AP, Smith DO, Nomikos PM, Dalterio MJ, et al. A new miniature x-ray source for interstitial radiosurgery: Device description. 1996.
- Ebert MA, Carruthers B. Dosimetric characteristics of a low-kV intra-operative x-ray source: Implications for use in a clinical trial for treatment of low-risk breast cancer. Med Phys 2003;30:2424.
- Chetty IJ, Rosu M, Kessler ML, Fraass BA, Haken RKT, Kong FM, et al. Reporting and analyzing statistical uncertainties in Monte Carlo-based treatment planning. Int J Radiat Oncol Biol Phys 2006;65:11.
- Chetty I, Curran B, Cygler JE, DeMarco JJ, Ezzell G, Faddegon BA, et al. Report of the AAPM Task Group No. 105: Issues associated with clinical implementation of Monte Carlo-based photon and electron external beam treatment planning. Med Phys 2007;34:36.
- Sarrut D, Bardies M, Boussion N, Freud N, Jan S, Letang JM, et al. A review of the use and potential of the GATE Monte Carlo simulation code for radiation therapy and dosimetry applications. Med Phys 2014;41:064301.
- Schneider W, Bortfeld T, Sclegel W. Correlation between CT numbers and tissue parameters needed for Monte Carlo simulations of clinical dose distributions. Phys Med Biol 2000;45:459–78.
- Beaulieu L, Carlsson Tedgren A, Carrier JF, Davis SD, Mourtada F, Rivard MJ, et al. Report of the Task Group 186 on model-based dose calculation methods in brachytherapy beyond the TG-43 formalism: Current status and recommendations for clinical implementation. Med Phys 2012; 39:6208–36.
- Rivard MJ, Davis SD, DeWerd LA, Rusch TW, Axelrod S. Calculated and measured brachytherapy dosimetry parameters in water for the Xoft Axxent X-Ray Source: An electronic brachytherapy source. Med Phys 2006;33: 4020.
- Rivard MJ, Coursey BM, DeWerd LA, Hanson WF, Saiful Huq M, Ibbott GS, et al. Update of AAPM Task Group No. 43 Report: A revised AAPM protocol for brachytherapy dose calculations. Med Phys 2004;31:633.
- Kron T, DeWerd L, Mobit P, Muniz J, Pradham A, Toivonen M, et al. A checklist for reporting of thermoluminescence dosimetry (TLD) measurements. Phys Med Biol 1999; 44(L15–L17).
- Eaton DJ, Best B, Brew-Graves C, Duck S, Ghaus T, Gonzalez R, et al. In vivo dosimetry for single-fraction targeted intraoperative radiotherapy (TARGIT) for breast cancer. Int J Radiat Oncol Biol Phys 2012;82: e819–24. [19]
- Nahum A. Special features of Monte Carlo based treatment planning. The handbook of radiotherapy physics: Theory and pactice. Ch 28. London: Taylor and Francis; 2007. pp. 615–7.
- DeWerd LA, Ibbott GS, Meigooni AS, Mitch MG, Rivard MJ, Stump KE, et al. A dosimetric uncertainty analysis for photon-emitting brachytherapy sources: Report of AAPM Task Group No. 138 and GEC-ESTRO. Med Phys 2011; 38:782.
- International Atomic Energy Agency. Absorbed dose determination in external beam radiotherapy based on absorbed dose-to-water standars: An international code practice. Technical Report Series n°398, IAEA: Vienna; 2000.
- Dolan J, Li Z, Williamson JF. Monte Carlo and experimental dosimetry of an [sup 125]I brachytherapy seed. Med Phys 2006;33:4675.
- Bert J, Perez-Ponce H, El Bitar Z, Jan S, Boursier Y, Vintache D, et al. Geant4-based Monte Carlo simulations on GPU for medical applications. Phys Med Biol 2013;58: 5593–611.
- Jia X, Gu X, Sempau J, Choi D, Majumdar A, Jiang SB. Development of a GPU-based Monte Carlo dose calculation code for coupled electron–photon transport. Phys Med Biol 2010;55:3077–86.
- Hissoiny S, Ozell B, Bouchard H, Després P. GPUMCD: A new GPU-oriented Monte Carlo dose calculation platform. Phys Med Biol 2011;38:754–64.