
ABSTRACT
Background. The pre-treatment 18F-Fludeoxyglucose (FDG) avid subvolume of the tumor has shown promise as a potential target for dose painting in patients with in head and neck squamous cell carcinomas (HNSCC).
Purpose. The purposes of this study are: 1) to assess the pre-treatment spatio-temporal variability of FDG PET/CT target volumes and 2) to assess the impact of this variability on dose distribution in dose painting plans in patients with HNSCC.
Material and methods. Thirty patients were enrolled and scanned twice, three days apart, days prior to treatment. Delineation of the FDG avid subvolume of the tumor and lymph nodes on both scans was performed by a specialist in nuclear medicine yielding GTVPET1 and GTVPET2 and segmentation based on SUV iso-contours were constructed yielding two metabolic target volumes, MTV1 and MTV2. Images were co-registered rigidly and dose painting plans with dose escalation up to 82 Gy to GTVPET1 were planned and GTVPET2 was copied from the co-registered images to the dose planning scan. Variation in dose to the target and modeled tumor control probability were assessed as measures of the impact of imaging variations in a dose painting scenario.
Results. Twenty-four patients were available for full analysis. The median mismatch between GTVPET1 and GTVPET2 was 14.2% (1.7 cm3). The median difference in dose to the FDG planning target volume was 0.3 Gy (PTVPET) and 0.4 Gy (PTVMTV). Median difference in the modeled tumor control probability (TCP) was < 0.2% and 23 of 24 patients had a difference in expected TCP < 1%.
Conclusions. Pre-treatment FDG PET/CT target volumes were stable and day-to-day variability had no relevant impact on dose distribution and expected tumor control in dose painting plans.
Recurrence after definitive chemo-radiation therapy (CRT) for head and neck squamous cell carcinoma (HNSCC) occurs predominantly in the pre-treatment18F-Fludeoxyglucose (FDG) avid subvolume of the gross tumor volume (GTV) [Citation1]. The FDG avid tumor volume is therefore a potential target for dose painting strategies in HNSCC patients [Citation1–3]. Two approaches are discussed in the literature on dose painting. The first approach is subvolume boosting where the boost dose is prescribed uniformly to a defined subvolume of the tumor and the second approach is dose painting by numbers where the dose distribution is modulated according to the voxel intensity from the positron emission tomography (PET) scan [Citation2,Citation4–6]. Hypoxia is an established reason for RT tumor resistance, and a potential dose painting target, but hypoxia assessed with the PET tracer 18F-Fluoromisonidazol (FMISO) have shown conflicting results in test-retest studies [Citation7,Citation8]. A study testing the impact FMISO variability on the dose distribution showed a substantial loss of the dose actually delivered to the hypoxic target volume from dose painting plans [Citation9]. Clinical trials of PET/computed tomography (CT)-guided dose painting are currently in progress, typically escalating the dose to regions with high FDG uptake, as these regions have shown an association with treatment failure after a uniform dose distribution [Citation1,Citation3]. This provides a rationale for boosting the radiation dose to these regions. To this end, studies testing the variability of dose painting target volumes at baseline and the possible impact on dose distribution are of interest.
Clinical examination including endoscopy and imaging with CT or magnetic resonance imaging (MRI) is recommended in HNSCC oncologic work-up. FDG PET/CT has been shown to reduce the inter-observer variability of target volume delineation in radiation oncology [Citation3,Citation10,Citation11]. However, the FDG PET positive tumor volume (GTVPET) will depend on which segmentation tool is used [Citation12] and there is no evidence supporting one tumor segmentation algorithm over another. A second concern in FDG image-based dose painting is the stability of the dose painting target, in this case: GTVPET, before any treatment. Clearly, if GTVPET changes much in size or location prior to treatment the dose painting plan optimized on one day may provide sub-optimal coverage of the relevant volume recorded on another day. To what extent changes after the start of therapy are relevant remains unclear. From the perspective of dose painting target validation it is a sufficient criterion that there is evidence for a link between the FDG uptake at baseline and the subsequent origin of local relapse. The published clinical experience with dose painting remains limited [Citation13–15].
The aim of this study is to investigate the FDG PET/CT positive tumor overlap in a prospective scan-rescan study and, furthermore, investigate if the variability in FDG PET/CT positive tumor volume prior to any treatment would have a relevant impact on dose distribution and expected tumor control in a hypothetical dose painting plans.
Methods and materials
Thirty patients with oro- or hypo-pharyngeal HNSCC referred to curative RT were included in this prospective study. The patient cohort has previously been used to assess reproducibility of the quantitative FDG uptake on both PET/CT and PET/MR [Citation16]. The patients were scanned and rescanned with FDG-PET/CT with three-day intervals according to the same protocol. Informed consent was obtained from all patients and the study was approved by the local ethics committee, approval number H-3-2012-072.
18F-FDG PET/CT
All PET/CT scans were performed on the same Biograph mCT 64 (Siemens Medical Solutions) and patients were immobilized with an individually molded thermoplastic mask in supine position on a flat scanner couch in order to reproduce the RT setup. On the first day, the scan was a whole body PET/CT (apex of the skull to mid-thigh) and on the second day the scan covered the apex of the skull to the apex of the lung. All CT images were acquired as diagnostic quality spiral CTs with intravenous contrast, except in one patient with renal insufficiency. A multi-bed PET scan with 2 min/ bed position was performed after the CT and the patients were scanned 60 minutes after FDG injection (4 MBq/kg). In case of an unintended delay on Day 1, the same time from FDG injection to scan was reproduced for the second scan.
Delineation and radiotherapy planning
The PET positive tumor volume (GTVPET), including both primary tumor and involved lymph nodes, was defined and delineated manually by a nuclear medicine specialist by visual adaptation of a standardized uptake value (SUV) iso-contour starting at 40% of SUVmax. A radiologist afterwards delineated the GTV in collaboration with the oncologist. Two specialists in nuclear medicine performed the delineation on all scans (AL and CBC), but the same specialist in nuclear medicine delineated both scans on each patient. Multiple delineations on the same scan were not performed and we do not assess inter-observer variability in delineation. The delineation on the second scan was performed after a minimum interval of one month and blinded, i.e. without access to the first scan. Both primary tumor and lymph nodes if assessed malignant were included in the GTVPET. The process yielded two GTVPET, one from the first scan (GTVPET1) and one from the second scan (GTVPET2). For each patient, the images were co-registered rigidly on bone (C2-C5 and the mandible) in Eclipse™ Treatment Planning System (Varian Medical Systems, Palo Alto, CA, USA) and afterwards the contour from scan 2 was copied to scan 1. The PET positive planning target volume (PTVPET) was constructed by expanding GTVPET with an isotropic margin of 4 mm, yielding PTVPET1 and PTVPET2, using the same nomenclature as for GTVPET. One RT plan for each patient was generated with dose escalation to 82 Gy equivalent dose in 2 Gy fractions (EQD2) to GTVPET1, as previously described [Citation17]. All plans were approved according to the criteria from an ongoing clinical trial using the prescribed doses, limits and constraints in .
Table I. Mean dose, dose limits for planning target volumes (PTV) and dose constraints for organs at risk (OAR).
An iso-contour defined metabolic tumor volume (MTV) was delineated using a threshold of 50% of SUVmax on both scan 1 and scan 2 without visual adaptation. The primary tumor subsite and lymph nodes from level I-V were included in the region of interest. This yielded two metabolic tumor volumes (MTV1 and MTV2) as an alternative to the expert delineation of GTVPET and the ratio between the volumes of GTVPET and MTV was assessed from both scans. The contour MTV2 from scan 2 was copied to scan 1 and the PET positive planning target volume (PTVMTV) was constructed by expanding MTV with an isotropic margin of 4 mm, yielding PTVMTV1 and PTVMTV2. A RT plan with dose escalation up to 82 Gy to MTV1 was made.
Volume overlap analysis
Tumor volumes were retrieved from Eclipse (Varian Medical Systems) and the mismatch between GTVPET1 and GTVPET2 was assessed as GTVPET1 subtracted from GTVPET2 and GTVPET2 subtracted GTVPET1, i.e. how much of GTVPET1 was not included in GTVPET2 and vice versa expressed in percent from the following equations:
mismatch = , where V(x) defines the volume of x and \ denotes the subtraction of volumes. In addition, DICE coefficients were calculated as
Mean dose and the percentage volume receiving 95% of prescribed dose (V95%) were reported for GTVPET and PTVPET from both scans.
Impact on expected tumor control
To estimate the clinical effect of a possible mismatch between target volumes, the tumor control probability (TCP) was estimated for both GTVPET1 and GTVPET2. The idea was to bring the magnitude and location of a mismatch onto a scale of estimated GTVPET tumor control in the original plan and on the rescan. The TCP was estimated using the dose-response model of Vogelius et al. [Citation17]:
The difference in TCP for the two GTVPET delineations was compared to the estimated TCP with the current prescription of 68 Gy using the same model. This facilitated comparison of the impact of variability in GTVPET with the expected benefit from dose escalation. Fraction-size adjustment used α/β = 10 Gy and a fixed number of 34 fractions.
Results
Thirty patients were included in this study. Three patients were only scanned once because they did not show up for the second scan: one withdrew consent, one forgot the appointment, and one was ill. Another three patients had no pathological FDG uptake on either of the two PET/CT scans. This left 24 patients, all with oropharyngeal carcinoma, available for analysis. Median age at time of scan was 64 years (range 44–74 years), 20 patients were male, four female. Nineteen patients had locally advanced disease stage III-IV (UICC 2010) and five patients had stage II disease, 12 patients were p16 positive, 11 p16 negative and one was inconclusive according to the pathology report.
The median mismatch between the target volumes GTVPET1 and GTVPET2 was 14.2% with a range from 0.4% to 59.2% corresponding to a median DICE coefficient 0.74 (range 0.42–0.91) and a mismatch of 1.7 in cm3 (range 0.03–13.2 cm3). shows axial and sagittal CT slices for the patient with the largest mismatch (59%) and of a patient with a mismatch of 18%, i.e. the closest to the average mismatch (17%). suggest that the large mismatch may be due to swallowing, since a proportion of GTVPET2 (blue contour) was delineated in the air-filled cavity in oropharynx indicating that the tumor had moved during the PET scan from Day 2. shows the dose-volume histograms (DVHs) from the same two patients (). The dose coverage of the target volumes was very similar. The DVH from the patient with the mismatch of 18% () is impacted by mandible sparing according to the protocol. shows dose coverage statistics for the target volumes (GTVPET and PTVPET) on both PET/CT scans. In one case it was not possible to reach V95% of 95% or more for PTVPET1: this patient had a very large PET positive lymph node, and dose escalation to full dose for both the lymph node and the primary tumor was not possible without unacceptable overdosing of organs at risk. The remaining 23 patients all had V95% > 96% on the primary scan. Some variation in V95% was seen on PTVPET2. The worst discrepancy, with V95% of 56% for PTVPET2, happened because lymph nodes were not assessed as malignant and therefore not delineated in GTVPET1 but were assessed malignant and delineated in GTVPET2. In other words, a new target was delineated on scan 2 and obviously not covered by the plan from scan 1. Upon review, the FDG uptake was very similar on both scans, median SUVmaxs of 19.2 and 20.1 and the difference in delineation is therefore attributable to the interpretation of the scan, rather than changes in the FDG uptake.
Figure 1. CT slices (sagittal and axial) of the patient with the largest mismatch of 59% (A and B) and of a patient with a mismatch of 18% (D and E). The contours are: GTVPET1 (red), GTVPET2 (blue) and the volume receiving 79 Gy (yellow), converted from the dose color wash. Panels C and F illustrate the DVHs from the same two patients with mismatch of 59% and 18% mismatch, respectively. Curve colors are: GTVPET1 (red), GTVPET2 (blue), PTVPET1 (green), PTVPET2 (purple).
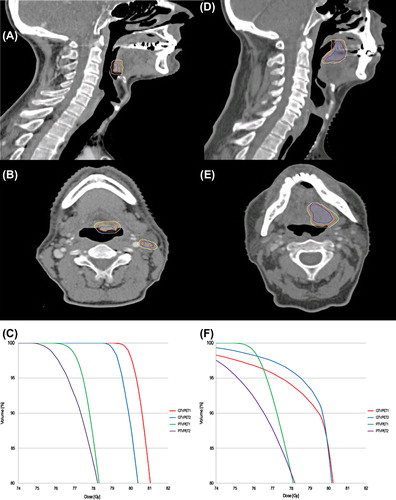
Table II. Target volumes, mean dose, dose distribution and tumor control probability.
In all 24 cases, the manually delineated GTVPET was larger than the MTV on both scans. The median volume ratio (GTV/MTV) was 2.6 and 2.7 in the first and second scan, respectively. The volumes, median mean doses and V95% to PTVMTV1 and PTVMTV2 can be seen in . It was not possible to use the dose response model from Vogelius et al. [Citation17] for PTVMTV1-2 and TCP for these two structures cannot be reported. The largest discrepancy of V95% with MTV as dose painting target, 59%, was also due to inclusion of a suspect lymph node in one scan and not in the other.
The expected probability of tumor control in GTVPET can be seen in . shows the fraction-size adjusted radiation doses to the 24 patients on the second scan as a box-and-whiskers plot on the x-axis and the TCP as a box-and-whiskers plot along the y-axis. The median detriment in TCP was 0.2% when comparing scan 1 to scan 2. Excluding the patient with an extra target defined on Day 2 (the outlier in the box-and-whiskers plot), the difference in TCP for all remaining patients was less than 1%. This should be compared to the expected benefit of dose escalation, which was an increase in TCP in GTVPET of 13%.
Figure 2. Variability in tumor control probability (TCP) as a result of the recorded variability in GTVPET. The gray dot is the probability of tumor control using the current mean dose (68 Gy). The black dot depicts the probability of control from the dose painted plans using the mean dose to the GTVPET from the first scan (GTVPET1). The black lines show the median dose on scan 2 (x-axis) and the resulting median TCP (y-axis). The two box-and-whiskers plots along the axis show the distribution of doses and TCP estimates, with an outlying patient marked as a black cross. The outlying patient had lymph nodes delineated on scan 2 that was not delineated on scan 1 – on review this difference was due to the interpretation of the uptake, rather than variability in uptake. The median detriment in TCP on scan 2 relative to scan 1 is 0.2%.
Discussion
FDG PET/CT target volumes proved to be stable over a three-day time interval before treatment in this prospective scan-rescan study, and the minor variability in FDG delineations had little impact on the dose distribution in a dose painting scenario.
Arguably, the reproducibility of the FDGPET/CT-derived target volume was better than what has been reported from inter-observer variation studies on CT-defined target volumes [Citation18–20]. This variability in target delineation and definition is accentuated across treatment centers [Citation21]. There are other FDG PET “test-retest” studies in the literature [Citation22–25]; none of these, however, assess the spatial reproducibility which is particularly relevant in RT.
Between-observer variability is a separate issue, here the observer was the same for each pair of scans in order to isolate to the largest possible extend the effect of changes in the spatial distribution of FDG uptake. Both primary tumor and lymph nodes were included in the GTVPET if assessed as malignant. The outlier in was due to, one patient had lymph nodes delineated on scan 2 that were not delineated on scan 1 and on review this difference was due to the interpretation of rather variability in FDG uptake, i.e. the lymph nodes were assessed as malignant in one scan but not in the other. While this may not be entirely surprising, it reinforces the point that quality assurance programs for multicenter collaborations should focus on training and consensus in the interpretation of FDG uptake as well as on hardware calibration exercises. Moreover, it should be noted that also with the iso-contours (MTV) lymph nodes were assessed differently in one case.
To bring the magnitude of a mismatch on a relevant scale, TCP estimates were used as a surrogate for clinical relevance of the observed mismatch. TCP showed similar, substantial improvements in the PET positive regions in the first and second scan relative to current dose prescription (). Importantly, the impact of scan-to-scan variability on the expected TCP was very small compared to the expected benefit from FDG-based dose escalation and thus should be manageable in dose painting trials provided that standardized imaging and delineation protocols are used. The purpose of the TCP was to serve as an example and there are limits of the TCP model. First the model is only based on 20 patients [Citation17] and second the model does not account for other prognostic factors, such as smoking status, tumor size and p16 status. The TCP model was a way to estimate the impact of the scan-to-scan variability as a supplement to geometrical measures such as percent-wise overlap or DICE coefficients.
shows that target definition remains challenging regardless of segmentation method. The size of the PET positive tumor volume depends on the segmentation tool [Citation12] and it could be argued that the small impact on mean dose delivered to the dose painting target might be due to the fact that GTVPET was larger than MTV (median volume ratio 2.6), which could mean that the manually defined GTVPET was large enough to accommodate variability in the FDG distribution. To test this idea, the whole replanning exercise was repeated using the iso-contour MTVs; also in this case, the day-to-day change in mean dose to the defined target dose was small.
Tumor hypoxia, measured with the PET tracer FMISO, showed conflicting results in two ”test-retest” studies [Citation7,Citation8] and a third study showed significant impact on dose distribution in dose painting plans [Citation9]. One interpretation of the contrasting findings in the papers may be that hypoxia-PET scans are reproducible if strict scanning protocols and appropriate reconstruction algorithms are used. Clearly, this is a topic for further research. While FDG is not a hypoxic tracer, the FDG avid area is attracting interest as a possible dose-painting target; this underlines the importance of quantifying the variability of tracer uptake and potential impact for dose distribution. In this prospective scan-rescan study the pre-treatment FDG PET/CT target volumes were quite stable and had no relevant impact on dose distribution in a dose painting setting.
Acknowledgments
JHR acknowledges support from the Arvid Nilssons Foundation. SMB is supported in part by grant no. P30 CA 134274-04 from the NCI. Supported by the Global Excellence in Health program of the Capital Region of Denmark and the Kirsten and Freddy Johansen Foundation. The authors report no conflicts of interest. The authors alone are responsible for the content and writing of the paper.
Declaration of interest: The authors report no conflicts of interest. The authors alone are responsible for the content and writing of the paper.
References
- Due AK, Vogelius IR, Aznar MC, Bentzen SM, Berthelsen AK, Korreman SS, et al. Recurrences after intensity modulated radiotherapy for head and neck squamous cell carcinoma more likely to originate from regions with high baseline [18F]-FDG uptake. Radiother Oncol 2014;111:360–5.
- Bentzen SM, Gregoire V. Molecular imaging-based dose painting: A novel paradigm for radiation therapy prescription. Semin Radiat Oncol 2011;21:101–10.
- Troost EGC, Schinagl DA, Bussink J, Oyen WJG, Kaanders JHAM. Clinical evidence on PET-CT for radiation therapy planning in head and neck tumours. Radiother Oncol 2010;96:328–34.
- Vanderstraeten B, Duthoy W, De Gersem W, De Neve W, Thierens H.[18F]fluoro-deoxy-glucose positron emission tomography ([18F]FDG-PET) voxel intensity-based intensity-modulated radiation therapy (IMRT) for head and neck cancer. Radiother Oncol 2006;79:249–58.
- Duprez F, De Neve W, De Gersem W, Coghe M, Madani I. Adaptive dose painting by numbers for head-and-neck cancer. Int J Radiat Oncol Biol Phys 2011;80:1045–55.
- Bentzen SM. Theragnostic imaging for radiation oncology: Dose-painting by numbers. Lancet Oncol 2005;6:112–7.
- Nehmeh SA, Lee NY, Schröder H, Squire O, Zanzonico PB, Erdi YE, et al. Reproducibility of intratumor distribution of (18)F-fluoromisonidazole in head and neck cancer. Int J Radiat Oncol Biol Phys 2008;70:235–42.
- Okamoto S, Shiga T, Yasuda K, Ito YM, Magota K, Kasai K, et al. High reproducibility of tumor hypoxia evaluated by 18F-fluoromisonidazole PET for head and neck cancer. J Nucl Med 2013;54:201–7.
- Lin Z, Mechalakos J, Nehmeh S, Schoder H, Lee N, Humm J, et al. The influence of changes in tumor hypoxia on dose-painting treatment plans based on 18F-FMISO positron emission tomography. Int J Radiat Oncol Biol Phys 2008;70:1219–28.
- Fletcher JW, Djulbegovic B, Soares HP, Siegel BA, Lowe VJ, Lyman GH, et al. Recommendations on the use of 18F-FDG PET in oncology. J Nucl Med 2008;49:480–508.
- Hoeben BAW, Bussink J, Troost EGC, Oyen WJG, Kaanders JHAM. Molecular PET imaging for biology-guided adaptive radiotherapy of head and neck cancer. Acta Oncol 2013;52:1257–71.
- Schinagl DA, Vogel WV, Hoffmann AL, van Dalen JA, Oyen WJG, Kaanders JHAM. Comparison of five segmentation tools for 18F-fluoro-deoxy-glucose-positron emission tomography-based target volume definition in head and neck cancer. Int J Radiat Oncol Biol Phys 2007;69:1282–9.
- Madani I, Duthoy W, Derie C, De Gersem W, Boterberg T, Saerens M, et al. Positron emission tomography-guided, focal-dose escalation using intensity-modulated radiotherapy for head and neck cancer. Int J Radiat Oncol Biol Phys 2007;68:126–35.
- Madani I, Duprez F, Boterberg T, Van de Wiele C, Bonte K, Deron P, et al. Maximum tolerated dose in a phase I trial on adaptive dose painting by numbers for head and neck cancer. Radiother Oncol 2011;101:351–5.
- Berwouts D, Olteanu LAM, Duprez F, Vercauteren T, De Gersem W, De Neve W, et al. Three-phase adaptive dose-painting-by-numbers for head-and-neck cancer: Initial results of the phase I clinical trial. Radiother Oncol 2013; 107:310–6.
- Rasmussen JH, Fischer BM, Aznar MC, Hansen AE, Vogelius IR, Löfgren J, et al. Reproducibility of FDG PET uptake measurements in head and neck squamous cell carcinoma on both PET/CT and PET/MR. Br J Radiol 2015;88:20140655.
- Vogelius IR, Håkansson K, Due AK, Aznar MC, Berthelsen AK, Kristensen CA, et al. Failure-probability driven dose painting. Med Phys 2013;40:081717.
- Van de Steene J, Linthout N, de Mey J, Vinh-Hung V, Claassens C, Noppen M, et al. Definition of gross tumor volume in lung cancer: Inter-observer variability. Radiother Oncol 2002;62:37–49.
- Logue JP, Sharrock CL, Cowan RA, Read G, Marrs J, Mott D. Clinical variability of target volume description in conformal radiotherapy planning. Int J Radiat Oncol 1998;41:929–32.
- Hermans R, Feron M, Bellon E, Dupont P, Van den Bogaert W, Baert AL. Laryngeal tumor volume measurements determined with CT: A study on intra- and interobserver variability. Int J Radiat Oncol 1998;40:553–7.
- Hong TS, Tomé WA, Harari PM. Heterogeneity in head and neck IMRT target design and clinical practice. Radiother Oncol 2012;103:92–8.
- Minn H, Zasadny R, Quint E, Wahl L. Lung cancer: Reproducibility of quantitative measurements for evaluating 2-[F-18]-fluoro-2-deoxy-D-glucose up- take at PET. Radiology 1995;196:167–73.
- Huser DM, Burger IA, Buck A, von Schulthess GK, Burger C. Repeatability of FDG quantification in tumor imaging: Averaged SUVs are superior to SUVmax. Nucl Med Biol 2012;39:666–70.
- De Langen AJ, Vincent A, Velasquez LM, van Tinteren H, Boellaard R, Shankar LK, et al. Repeatability of 18F-FDG uptake measurements in tumors: A metaanalysis. J Nucl Med 2012;53:701–8.
- Frings V, de Langen AJ, Smit EF, van Velden FHP, Hoekstra OS, van Tinteren H, et al. Repeatability of metabolically active volume measurements with 18F-FDG and 18F-FLT PET in non-small cell lung cancer. J Nucl Med 2010;51:1870–7.