
Abstract
Background Self-report questionnaires are widely used to assess changes in quality of life (QoL) during the course of cancer treatment. However, comparing baseline scores to follow-up scores is only justified if patients’ internal measurement standards have not changed over time, that is, no response shift occurred. We aimed to examine response shift in terms of reconceptualization, reprioritization and recalibration among prostate cancer patients.
Material and methods We included 402 newly diagnosed patients (mean age 65 years) and assessed QoL at the beginning of cancer treatment and three months later. QoL was measured with the European Organization for Research and Treatment of Cancer Quality of Life Questionnaire Core 30 (EORTC QLQ-C30). We employed structural equation modeling testing measurement invariance between occasions to disentangle ‘true’ change and change in the measurement model (response shift).
Results We found reprioritization effects for both the Physical Functioning and Role Functioning subscales of the EORTC QLQ-C30, indicating that both had gained importance for representing the latent construct of QoL at follow-up. These effects added to the worsening effect evident in the latent construct, thus rendering observed changes even more pronounced. In addition, we found recalibration effects for both the Emotional Functioning and Cognitive Functioning subscales indicating judgments becoming more lenient over time. These effects counteracted ‘true’ negative changes thus obscuring any substantial changes on the observed level.
Conclusion Our results suggest that changes observed in some subscales of the EORTC QLQ-C30 should not be taken at face value as they may be affected by patients’ changed measurement standards.
Cancer patients may judge their quality of life (QoL) as high as, or even higher than, healthy persons do, a phenomenon coined the ‘well being paradox’ [Citation1]. While this phenomenon may be valued as favorable from a coping perspective, it poses severe threats to QoL measurement. Consider a patient who adapts to his illness by reducing his aspirations regarding his level of functioning. Although no change may have actually occurred at a follow-up assessment, he may judge his level of functioning to be higher against his reduced aspiration level. Consider, conversely, a patient who held the expectation of his functioning to improve. At follow-up, he may judge his level of functioning to be worse although it may not have changed at all. In both cases, changes in QoL scores would be observed in self-reports in the absence of any ‘true’ change. In this paper, we aim to separate both factors, i.e. change of the relevant construct and change of the measurement model.
QoL is conceptualized as a multidimensional construct that is represented by a limited number of components (subscales of questionnaires). Changing internal standards when reporting on QoL at different time points has been termed ‘response shift’ [Citation2]. Response shift may have three facets: (1) Reconceptualization, a qualitative change of the structure of the construct of QoL. That is, some components may be omitted from the construct, while others may be adopted; (2) Reprioritization, a quantitative change of the structure of the construct of QoL. That is, some components may become more important to representing the construct while others may become less important; and (3) recalibration, a change of scaling when assessing the level of a component. That is, scaling anchors may be either raised or lowered, as in the examples presented earlier.
Previous research has documented response shift processes in various cancer populations [e.g. Citation3–5]. However, response shift has only rarely been explored in prostate cancer [e.g. Citation6–9]. In this population, most studies used the then-test to examine recalibration. The then-test is based on a comparison between a baseline measure of QoL and a retrospective judgment of the baseline situation (as it was ‘then’) performed at follow-up. Should differences between both assessments emerge, this is taken as evidence for changed internal standards, i.e. recalibration. Thus, when asked three months after the start of treatment, prostate cancer patients in retrospect judged their pretreatment health to be lower than they had actually judged it at the start of treatment [Citation6]. In this study, patients were also asked directly whether their conception of health had changed meanwhile, but this judgment did not correlate with recalibration effects [Citation6]. Similarly, a study using the then-test found that patients rated their baseline QoL lower in retrospect after four months than they had done previously during the diagnostic and treatment period [Citation7]. Another then-test study evaluated distress, which was rated higher in retrospect after three months than it had been rated at the time of diagnosis [Citation8]. By contrast, another study using the then-test found that prostate cancer patients retrospectively judged their pre-diagnosis QoL better after three months than they had done at the actual time before diagnosis, but this effect changed to the opposite when reevaluating their pre-diagnosis QoL after seven months [Citation9].
However, the interpretation of results from the then-test is not as straightforward. Although the then-test is supposed to tap recalibration, it may be affected also by reprioritization or reconceptualization, which cannot be perfectly disentangled within that method [Citation5]. As previous studies with prostate cancer did not examine all three facets of response shift in the same model, interpretation of findings is hampered, rendering previous research incomplete. The only exception is prior work from our group that examined reconceptualization, reprioritization and recalibration effects after inpatient rehabilitation in prostate cancer, using structural equation modeling [Citation10].
Structural equation modeling seems to be more suitable to grasp response shift processes because it allows for: (1) analyzing all three facets of response shift simultaneously; and (2) disentangling ‘true’ change, that is, change in the underlying latent construct, from change of the measurement model, that is, response shift, as evident in changed relations between the manifest indicators of the latent construct and the latent construct itself.
Our study purpose was to analyze response shift in terms of reconceptualization, reprioritization, and recalibration in prostate cancer patients during the early disease trajectory from the start of treatment until three months later. In doing so, we aimed to quantify the contributions of both ‘true’ change and response shift to any changes observed in the self-report measurements of QoL during the three-month study period. Should we be able to demonstrate response shift effects, comparing follow-up to baseline scores from QoL questionnaires would be misleading as such changes would not only reflect ‘genuine’ changes in the QoL construct, but also changed measurement models. Response shift effects may either counteract actual QoL changes, e.g. turning an actual decrease into an increase, or else amplify changes in the latent construct, e.g. rendering a decrease of QoL, as evident in the latent construct, even more pronounced as evident in the observed questionnaire scores. Thus, the results of our study may provide better evidence in interpreting QoL changes observed in prostate cancer patients during their early illness trajectory.
Material and methods
Study participants
Patient inclusion criteria comprised the evidence of newly diagnosed prostate cancer (ICD-10 C61) and being 18 years of age or older. Patient exclusion criteria comprised the presence of severe physical, cognitive and/or verbal impairments that would interfere with a patient’s ability to give informed consent. All patients who fulfilled the inclusion criteria were contacted by trained research assistants and consecutively recruited at the participating institutions at two German University Medical Centers in Würzburg and Hamburg. Our study complied with the Declaration of Helsinki and was approved by the Ethics Committee of the University of Würzburg. All participants provided written informed consent prior to study entry.
Measures
Patients’ QoL was assessed using the self-reported European Organization for Research and Treatment of Cancer Quality of Life Questionnaire Core 30 (EORTC QLQ-C30) [Citation11]. This instrument is widely used and has excellent reliability and validity. Higher scores in all functional scales indicate better QoL. The EORTC QLQ-C30 was administered twice, at the start of treatment (baseline) and three months later. The baseline assessment was performed during patients’ inpatient stay before surgery and radiotherapy, respectively. For the follow-up assessments, questionnaires were sent to the patients’ homes and prepaid return envelopes were provided. For evaluating the clinical relevance of changes between both measurements, we used the guidelines for interpreting change scores of the EORTC QLQ-C30 for longitudinal differences [Citation12] referring to thresholds of small improvements/deteriorations and no differences (table 4 in [Citation12]). Of note, no overall summary scale is available for the EORTC QLQ-C30. However, we assume that the five functioning subscales, i.e. Physical, Role, Social, Cognitive, and Emotional functioning, respectively, represent an underlying functioning QoL factor. This assumption has been tested empirically and proved tenable [Citation13,Citation14].
Clinical and demographic characteristics were also assessed, either from patients’ charts or by questionnaires.
Structural equation modeling
We examined measurement invariance across the baseline and follow-up models following the structural equation modeling approach proposed by Oort [Citation3,Citation15], which includes four steps.
We defined a model with the five functioning subscales of the EORTC QLQ-C30, i.e. Physical Functioning, Role Functioning, Social Functioning, Cognitive Functioning, and Emotional Functioning, respectively, representing the latent variable QoL at each assessment occasion, and tested whether this model fit the data. This step aimed at examining our basic assumption of the five functioning subscales representing a common underlying factor and that this model shows configural invariance across both measurement occasions, i.e. no reconceptualization occurred.
We then defined a ‘no response shift’ model that posits that the baseline and the follow-up measurement models are invariant. Thus, all respective parameters including factor loadings, intercepts, and residual variances were constrained to be equal across both measurement occasions. As an example, the factor loading of the Physical Functioning subscale on the latent variable QoL at baseline was set to be equal to the factor loading of the Physical Functioning subscale on the latent variable QoL at follow-up. As in the first step, model fit was tested. Should this model fit the data equally well, we would conclude that no response shift was present, and omit further steps.
Should the ‘no response shift’ model not fit the data, a response shift model may be developed. The constraints imposed across occasions in the ‘no response shift’ model are removed step-by-step as long as model fit does not improve further. This process is guided by modification indices and expected parameter changes (EPC) that indicate which parameters should be allowed to vary freely across the occasions to improve model fit [Citation16]. A standardized EPC of >0.1 was interpreted as a miss-specified parameter. After setting a parameter free, we tested whether doing so improved the model fit using the χ2 difference test. We terminated this procedure after no further improvement of model fit was achieved. In this step, reprioritization is indicated by lack of invariance of factor loadings across the two occasions, that is, a subscale may gain (or lose) importance for representing the latent construct. Recalibration is indicated by lack of invariance of the intercepts (uniform recalibration) or residual variances (non-uniform recalibration), i.e. responding to a scale may become easier (or harder) either in a similar way across the whole range of the scale (uniform recalibration) or in a heterogeneous manner across the scale’s range (non-uniform recalibration).
As the three aspects of response shift are assessed simultaneously in this model, the contribution of response shift to the observed scores may be computed in terms of effect sizes (Cohen’s d, [Citation17]). This allows for disentangling partitions of observed QoL changes into those due to changes in the latent variable and those due to changes in the various facets of the measurement model (i.e. response shift).
We used the following goodness-of-fit statistics: comparative fit index (CFI; >0.90 indicates acceptable fit), root-mean-square-error-of-approximation (RMSEA; <0.08 indicates acceptable fit), and standardized-root-mean-square-residual (SRMR; <0.08 indicates acceptable fit). The χ2-test was also computed but it should not be used as a fit criterion as the sample size was large thus producing significant test results even with good model fit [Citation18,Citation19].
All analyses were done using SPSS statistical software version 19 (IBM, Armonk, NY, USA) and Mplus software (Muthén & Muthén, Los Angeles, CA, USA). To estimate parameters, the robust maximum likelihood estimation procedure (MLR estimator) was applied. Missing data was handled using the full information maximum likelihood estimates. JrulePlus [Citation20] was used to select miss-specified parameters.
Results
Sample characteristics
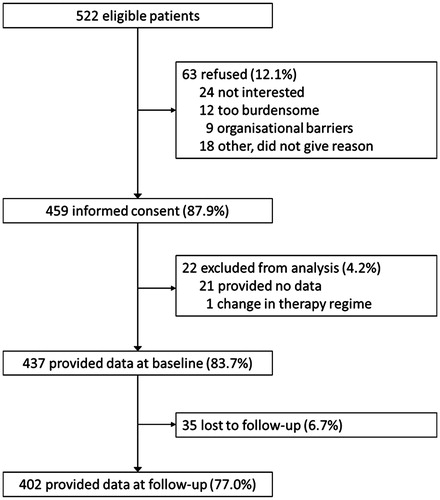
shows the study enrollment. A total of 522 cancer patients fulfilling the inclusion criteria were approached during the recruitment period. Of these, 459 (87.9%) consented to participate, and 437 (83.7%) provided sufficient data at baseline. At three months, 402, i.e. 87.6% of baseline participants, returned follow-up data.
Figure 1. Patient flow. Note. All percentages refer to n = 522 eligible patients.
Sample characteristics are detailed in . The mean age of the participants was 65 years (SD = 7.1). Eighty-three percent were married. About two thirds had received more than basic school education. In most cases, the tumor stage had been classified as T2 (53%) or T3 (34%). The most frequent Gleason score was 7 (69%). The majority of patients (82%) received surgery.
Table 1. Descriptive statistics of the sample.
We analyzed differences in demographic variables between study participants and non-participants. Non-consenting patients and those who dropped out at follow-up did not differ from participants regarding age, education, and other demographic variables. However, those providing incomplete data at baseline were older and more frequently retired than study participants (data not shown).
Observed changes of functioning from start of treatment to three months later
Descriptive statistics of the five EORTC QLQ-C30 functioning subscales at both measurement occasions are given in . Judging from the observed scores, i.e. the manifest indicators of QoL, small deteriorations occurred in four of the five subscales, namely, Physical Functioning, Role Functioning, Social Functioning, and Cognitive Functioning, whereas Emotional Functioning did not change to a relevant degree.
Table 2. Change of observed EORTC QLQ-C30 functioning subscale scores from baseline to 3-months follow-up.
Structural equation modeling
The zero-order correlations of the model variables are displayed in . Correlation coefficients vary between 0.21 and 0.66. Based on these intercorrelations, the four steps of structural equation modeling provided the following results:
The basic model showed an acceptable model fit (CFI = 0.95; RMSEA = 0.071; SRMR = 0.071; χ2=75.6, df = 25, p < 0.001). Thus, the assumption of the five functioning subscales representing an underlying latent factor proved to be tenable.
In contrast, the ‘no response shift’ model assuming measurement invariance across occasions did not fit the data (CFI = 0.82; RMSEA = 0.11; SRMR = 0.23), with the χ2-value three times as large (χ2=231.0, df = 38, p < 0.001). Thus, the assumption that no response shift effects were present was not tenable, warranting the development of a response shift model.
In a step-by-step fashion, six of the 15 restricted parameters of the ‘no response shift’ model were set free until no further significant improvement of the model fit was obtained. Invariance of parameters was not tenable regarding two factor loadings (Physical Functioning, Role Functioning), two intercepts (Cognitive Functioning, Emotional Functioning), and two residual variances (Role Functioning, Social Functioning). Setting these six parameters free to vary between both occasions produced the response shift model (), which fit the data well (CFI = 0.95; RMSEA = 0.065; SRMR = 0.078), with a much lower χ2-value than that of the ‘no response shift’ model (χ2=86.7, df = 32, p < 0.001). Although it is much more parsimonious than the basic model, as considerably fewer parameters had to be estimated, its model fit is equally good. Based on the final model, a worsening of QoL as a latent variable (d= −0.66, p < 0.001) was evident. In detail, response shift effects on the five functioning subscales were as follow:
Physical Functioning: The standardized factor loading at baseline (λ = 0.37) is lower than that at three months (λ = 0.66), which is indicative of reprioritization. At follow-up, patients gave the Physical Functioning component more importance in defining the latent construct of QoL.
Role Functioning: The standardized factor loading at baseline (λ = 0.53) is lower than that at three months (λ = 0.67), indicative of reprioritization, i.e. gain of importance at follow-up. In addition, the residual variance at baseline (ɛ = 236.4) is lower than at three months (ɛ = 362.2), which indicates non-uniform recalibration.
Social Functioning: The residual variance at baseline (ɛ = 215.9) is lower than at three months (ɛ = 307.7), indicating non-uniform recalibration.
Cognitive Functioning: The intercept is lower at baseline (τ = 89.5) than at three months (τ = 93.6). This indicates uniform recalibration. Thus, scale anchors have changed in such a way as to make the items easier to answer, i.e. patients’ aspirations were reduced.
Emotional Functioning: The intercept is lower at baseline (τ = 73.8) than at three months (τ = 88.3), indicating uniform recalibration. Again, at follow-up the items of the scale have become easier to answer, which implies reduced aspirations.
Lastly, we quantified the contributions to observed scores, of ‘true’ change, i.e. change of the latent construct of QoL, and response shift, i.e. changes due to measurement invariance. As can be seen from , response shift effects affected the five functioning subscales to different degrees and in different directions. Regarding Physical Functioning, the observed medium-sized worsening effect was partly due to ‘true’ change, but to a similar degree to reprioritization. A similar picture emerged regarding Role Functioning, with both ‘true’ change and reprioritization accounting for the observed medium-sized change in the negative direction. In contrast, a large positive recalibration effect counteracted the negative ‘true’ change in Emotional Functioning, resulting in a small positive observed change. Similarly, regarding Cognitive Functioning, a small positive recalibration effect reduced the negative ‘true’ change considerably, resulting in a small negative observed effect. Regarding Social Functioning, only a non-uniform recalibration effect was found, which does not influence scale score means.
Figure 2. Structural equation model, with the EORTC QLQ-C30 subscales indicating the latent variable quality of life. Note. Rectangles represent observed variables, circles latent variables, single-headed arrows the impact of one variable on another, and double-headed arrows the covariance between pairs of variables, respectively. The numbers are the parameter estimates of the resulting response shift model: (standardized) factor loadings (λ), (unstandardized) intercepts (τ), residual variances (ɛ) and residual correlations. Parameter estimates separated by a slash represent separate baseline and follow-up assessment estimates; otherwise, unstandardized parameters were constrained to be equal across assessments. Bold numbers indicate response shift. λ indicates factor loadings, τ intercepts, and ɛ residual variances, respectively. CF, Cognitive Functioning subscale; EF, Emotional Functioning subscale; EORTC, European Organization for Research and Treatment of Cancer; PF, Physical Functioning subscale; QoL, quality of life; RF, Role Functioning subscale; SF, Social Functioning subscale.
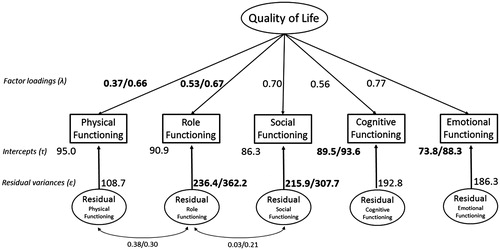
Table 3. Zero-order correlations of the model variables.
Discussion
This study examined the combined effects of the three response shift facets, i.e. reconceptualization, reprioritization and recalibration, in the early course of newly diagnosed prostate cancer, using structural equation modeling. Based on patients’ self-reports on their functioning as assessed by the EORTC QLQ-C30, we found evidence for reprioritization, i.e. higher importance of some subscales for the latent QoL construct at three-month follow-up compared to baseline, and recalibration, i.e. lack of invariance of scaling standards, but not reconceptualization, as no factor loading dropped to zero at follow-up.
In detail, we found that both the Physical Functioning and Role Functioning dimensions gained more importance as indicators of the latent construct of QoL from baseline to three months later, as evident in higher factor loadings at follow-up (reprioritization). This higher priority contributed considerably to observed changes, rendering observed QoL even worse than it would have been based only on ‘true’ change, i.e. genuine worsening of the latent construct, without accompanying changes of internal measurement models.
In contrast, regarding Emotional Functioning and Cognitive Functioning, positive recalibration effects counteracted the negative ‘true’ changes, resulting in only small observed changes. However, without these recalibration effects, medium-sized negative ‘true’ changes would have been observed in both cases. Thus, changing of internal measurement standards made patients perceive their Emotional and Cognitive Functioning in a rosier light at follow-up.
Although the five functioning subscales of the EORTC QLQ-C30 are usually not combined to build a summary score, we assumed that they indicate an underlying QoL factor. This assumption, which is consistent with results from previous studies [Citation13,Citation14], proved tenable. Our results are also in line with studies that found evidence for recalibration response shift in prostate cancer [Citation6–9]. However, we showed that not only recalibration, but also reprioritization simultaneously contributed to observed changes, as our method was, as compared to previous studies, more comprehensive, combining all aspects of response shift in a single quantitative model. Future studies should directly compare the traditional then-test with the structural equation modeling method to examine the hypothesis that the then-test is not only capturing recalibration effects, but also those of reprioritization [Citation5,Citation21].
An earlier study from our group using structural equation modeling to analyze response shift effects in prostate cancer during a three-month period starting at the beginning of inpatient rehabilitation found effects of recalibration only [Citation10]. These effects further augmented positive genuine changes in the Physical Functioning and Role Functioning subscales of the EORTC QLQ-C30, but counteracted positive genuine changes in the Cognitive Functioning subscale. These findings are not in line with our results. This inconsistency may be a consequence of the different periods investigated. During the early treatment phase, as in our study, Physical Functioning and Role Functioning may worsen. Later on, however, during the rehabilitative phase, they may improve and even be overstated against the background of lowered aspirations. However, a study examining response shift across a longer period of the cancer trajectory would clarify this issue.
Regarding the Role Functioning subscale, effect sizes quantifying ‘true’ change and response shift did not sum up to the effect size of the observed score. This might be due to various reasons in need of further clarification. First, while response shift is defined as lack of measurement invariance over time, little is known about the number of invariant indicators in a measurement model of QoL necessary to estimating (latent) differences with minimal bias [Citation22,Citation23]. A further question concerns the impact of correlated residuals in measurement models while specifying response shift. Allowing correlated residuals among indicators is common practice [Citation3] and we modeled residual co-variances among Role Functioning and both Physical Functioning and Social Functioning in accordance with Jelitte [Citation10]. However, the impact of this decision on the different covariance components in our model remains unclear.
Some limitations should be considered. Although our choice of a single underlying factor fitted the data well and was proven by previous research [Citation13,Citation14], other models are conceivable [Citation24]. As structural equation modeling rests upon group statistics, our results pertain to the whole sample of patients and we were not able to examine response shift on an individual level. Another limitation is the short time frame used, which may have prevented detecting response shift processes that may occur in the later disease trajectory [Citation10]. The different contexts of both assessment occasions, that is during the hospital stay at baseline measurement versus at home at follow-up, constitutes a further limitation. This may have added method variance. During their inpatient stay, participants’ attention might have been drawn to aspects of their physical health, while everyday functioning might rather have attracted their attention at home. Regarding terminology, the term of ‘true’ change has been criticized as suggesting response shift processes not to be true [Citation15]. However, we have used the words ‘true’ (or ‘genuine’) in a technical sense. That is, ‘true’ change denotes change of the latent construct, as opposed to change of the measurement model.
Our results are highly relevant as self-report QoL questionnaires, such as the EORTC QLQ-C30, are widely used to assess changes occurring in the course of treatments. Any such changes observed are often interpreted as reflecting ‘true’ changes of QoL. Our study, however, has shown that this is not necessarily the case. Instead, changing measurement models may have affected patients’ self-reports in such a way that the observed values may not be considered directly reflecting ‘genuine’ QoL change. Response shift processes may have either augmented observed change scores, or else reduced, or at times even turned into the opposite. In particular, counteracting response shift trends completely obscured worsened Emotional Functioning across the early treatment period. Thus, physicians should bear in mind that their patients might be emotionally more distressed than they reveal in self-report questionnaires. To conclude, our results suggest that changes in some subscales of the EORTC QLQ-C30 as observed in prostate cancer patients during the early illness trajectory may not be taken at face value without accounting for response shift effects.
Acknowledgments
This study was funded by a grant from the German Cancer Aid (Grant No: 109959). We thank all healthcare teams involved assisting in data collection in all local study centers.
Disclosure statement
The authors report no conflicts of interest. The authors alone are responsible for the content and writing of the paper.
References
- Herschbach P. The “well-being paradox” in quality-of-life research. Psychother Psych Med 2002;52:141–50.
- Sprangers MA, Schwartz CE. Integrating response shift into health-related quality of life research: A theoretical model. Soc Sci Med 1999;48:1507–15.
- Oort FJ, Visser MR, Sprangers MA. An application of structural equation modeling to detect response shifts and true change in quality of life data from cancer patients undergoing invasive surgery. Qual Life Res 2005;14:599–609.
- Sharpe L, Butow P, Smith C, McConnell D, Clarke S. Changes in quality of life in patients with advanced cancer: Evidence of response shift and response restriction. J Psychosom Res 2005;58:497–504.
- Visser MR, Oort FJ, Sprangers MA. Methods to detect response shift in quality of life data: A convergent validity study. Qual Life Res 2005;14:629–39.
- Hinz A, Finck Barboza C, Zenger M, Singer S, Schwalenberg T, Stolzenburg JU. Response shift in the assessment of anxiety, depression and perceived health in urologic cancer patients: An individual perspective. Eur J Cancer Care 2011;20:601–9.
- Serdà I Ferrer B-C, del Valle A, Marcos-Gragera R. Prostate cancer and quality of life: Analysis of response shift using triangulation between methods. J Gerontol Nurs 2014;40:32–41.
- Rees J, Clarke MG, Waldron D, O'boyle C, Ewings P, MacDonagh RP. The measurement of response shift in patients with advanced prostate cancer and their partners. Health Qual Life Outcomes 2005; 3:21–29.
- Korfage IJ, de Koning HJ, Essink-Bot ML. Response shift due to diagnosis and primary treatment of localized prostate cancer: A then-test and a vignette study. Qual Life Res 2007;16:1627–34.
- Jelitte M. Untersuchung von Response-Shift-Einflüssen auf die Erfassung der gesundheitsbezogenen Lebensqualität bei Prostatakrebspatienten in der onkologischen Rehabilitation. Landau: Dissertation, University of Koblenz-Landau, 2010.
- Aaronson NK, Ahmedzai S, Bergman B, Bullinger M, Cull A, Duez NJ, et al. The European Organization for Research and Treatment of Cancer QLQ-C30: A quality-of-life instrument for use in international clinical trials in oncology. J Natl Cancer Inst 1993;85:365–76.
- Cocks K, King MT, Velikova G, de Castro G, Jr, Martyn St-James M, Fayers PM, et al. Evidence-based guidelines for interpreting change scores for the European Organisation for the Research and Treatment of Cancer Quality of Life Questionnaire Core 30. Eur J Cancer 2012;48:1713–21.
- King-Kallimanis BL, ter Hoeven CL, de Haes HC, Smets EM, Koning CC, Oort FJ. Assessing measurement invariance of a health-related quality-of-life questionnaire in radiotherapy patients. Qual Life Res 2012;21: 1745–53.
- Boehmer S, Luszczynska A. Two kinds of items in quality of life instruments: 'Indicator and causal variables' in the EORTC QLQ-C30. Qual Life Res 2006;15:131–41.
- Oort FJ. Using structural equation modeling to detect response shifts and true change. Qual Life Res 2005;14:587–98.
- Saris WE, Satorra A, van der Veld WM. Testing structural equation models or detection of misspecifications? Structural Equation Modeling 2009;16:561–82.
- Cohen J. Statistical Power Analysis for the Behavioral Sciences, 2nd ed. Hillsdale NJ: Lawrence Erlbaum Associates; 1988.
- Kline RB. Principles and Practice of Structural Equation Modelling, 2nd ed. New York: Guilford; 2005.
- Steiger JH. Understanding the limitations of global fit assessment in structural equation modelling. Personal Individ Diff 2007;42:893–8.
- Oberski DJ. Jrule for Mplus. Version 0.91. http://wiki.github.com/daob/JruleMplus/[accessed April 30, 2015].
- Schwartz CE, Rapkin BD. Understanding appraisal processes underlying the thentest: A mixed methods investigation. Qual Life Res 2012;21:381–8.
- Steenkamp JBEM, Baumgartner H. Assessing measurement invariance in cross-national consumer research. J Consum Res 1998;25:78–90.
- Steinmetz H. Analyzing observed composite differences across groups - Is partial measurement invariance enough? Methodology 2013;9:1–12.
- Donaldson GW. Structural equation models for quality of life response shifts: Promises and pitfalls. Qual Life Res 2005;14:2345–51.