
Abstract
Worldwide, the fat composition of spreads and margarines (“spreads”) has significantly changed over the past decades. Data on fat composition of US spreads are limited and outdated. This paper compares the fat composition of spreads sold in 2013 to that sold in 2002 in the USA. The fat composition of 37 spreads representing >80% of the US market sales volume was determined by standard analytical methods. Sales volume weighted averages were calculated. In 2013, a 14 g serving of spread contained on average 7.1 g fat and 0.2 g trans-fatty acids and provided 22% and 15% of the daily amounts recommended for male adults in North America of omega-3 α-linolenic acid and omega-6 linoleic acid, respectively. Our analysis of the ingredient list on the food label showed that 86% of spreads did not contain partially hydrogenated vegetable oils (PHVO) in 2013. From 2002 to 2013, based on a 14 g serving, total fat and trans-fatty acid content of spreads decreased on average by 2.2 g and 1.5 g, respectively. In the same period, the overall fat composition improved as reflected by a decrease of solid fat (from 39% to 30% of total-fatty acids), and an increase of unsaturated fat (from 61% to 70% of total-fatty acids). The majority of US spreads no longer contains PHVO and can contribute to meeting dietary recommendations by providing unsaturated fat.
Introduction
The composition of fat-based food products such as vegetable oil spreads and margarines (“spreads”) has evolved over the last decades (Upritchard et al. Citation2005; Ahuja et al. Citation2009; Downs et al. Citation2013). This evolution began as the result of both technological developments and new health insights. Spreads are produced from liquid vegetable oils, high in polyunsaturated fat, through an emulsion of water into oil. A small amount of solid fat is needed to prevent the water droplets from separating and to create an emulsion with the right stability, functionality, and texture. Typically, either tropical oils, generally high in saturated fat, or partially hydrogenated oils, containing trans fat, have been used as the source of solid fat.
Awareness of the effects of solid fat on coronary heart disease started to develop in the 1950s. This led in the 1980s to public health recommendations in both the USA and the UK to reduce saturated fat consumption to less than 10% of total energy (Select Committee on Nutrition and Human needs Citation1977; National Advisory Committee on Nutritional Education Citation1983). After focusing on saturated fat, during the 1990s, new studies showed that trans fat had adverse effects on blood lipids and risk of coronary heart disease (Mensink & Katan Citation1990; Willett et al. Citation1993; Ascherio et al. Citation1999). As a result of these findings, public health recommendations released in the new century advised limiting both saturated fat and trans fat in the diet. In 2005, the Dietary Guidelines for Americans advised the public for the first time to limit trans fat to less than one percent of calories (U.S. Department of Health and Human Services & U.S. Department of Agriculture Citation2005), mirroring the conclusions of reports issued by the Institute of Medicine (Citation2002/2005), the joint WHO/FAO expert consultation (Citation2003) and the European Food Safety Authority (EFSA) (Citation2004).
Recognizing the significance of these findings, food manufacturers began the reformulation of their products to reduce solid fat in spreads. Studies from Europe show that the fat composition of vegetable oil spreads has substantially changed over the last two decades (Ratnayake et al. Citation2007; Ricciuto et al. Citation2009; Kroustallaki et al. Citation2011; Meremäe et al. Citation2012; Ritvanen et al. Citation2012) due to the removal of partially hydrogenated vegetable oils (PHVO), which contain trans fat produced from industrial hydrogenation. The decrease of trans fat in foods in Europe was mainly achieved through industry initiatives (IMACE Citation2015). In North America, significant changes to the composition of spreads over the past 10 years were accelerated by initiatives aimed at restricting the trans fat content of foods, including nutrition labeling and banning of trans fat in restaurants (L'Abbé et al. Citation2009; Downs et al. Citation2013; Arcand et al. Citation2014). Despite the attention for trans fat in foods, reliable data on fat composition of spreads on the US market are limited (Satchithanandam et al. Citation2004; Albers et al. Citation2008; Doell et al. Citation2012; Otite et al. Citation2013).
Therefore, we conducted a survey to assess the fat composition of modern vegetable oil spreads as marketed in the USA in 2013. The secondary objective of this study was to evaluate the changes in fat composition of US spreads over the past decade.
Methods
Product selection
Sales volume data for vegetable oil spreads was obtained from Nielsen (NY, USA) in both September 2010 and September 2013 for the preceding 52 weeks. Sales volume data were used to select top selling branded products for those two periods in the US marketplace. Between September 2010 and September 2011, for each selected product, six consumer units originating from different lots were bought across the Unites States: two from the Central, two from the Western and two from the Eastern states. We obtained 32 branded products representing >75% of the sales volume in 2010–2011. Additionally, we selected 12 products from seven major retailers across the country (“private label products”). The selection of private label products was dependent on in-store availability and not determined by market share. Overall, we sampled 44 products in 2011 (“2011 sample”).
Between 2011 and 2013 the industry continued with reformulation work to eliminate the use of PHVO. To quantify these changes, an additional set of product samples was collected in New Jersey between September 2013 and January 2014. We purchased 37 branded products representing >80% of the sales volume in 2012–2013. Additionally, we selected nine private label products from three retailers based on in-store availability. Overall, we sampled 46 products in 2013 (“2013 sample”). For this period, for each selected product, we sampled only one consumer unit from one single lot because the inter-lot coefficient of variation (CV) for all fatty acids measured in 2011 found small variability between different lots. (For each product assessed in 2011, within the six consumer units from six different lots that were sampled, the CV was lower than 5% for all fatty acids, but for trans fatty acids the CV was 14%).
Fatty acid analysis & Label Assessment
The fatty acid composition of the 2011 and 2013 samples was measured by Silliker Inc. (Allentown, PA, USA). The exception was for those products containing plant sterol esters, the fatty acid composition of which was measured by Covance Laboratories (Madison, WI, USA). The determination was conducted using the AOAC 996.06 method (AOAC International Citation2012). After adding a known amount of internal standard, fatty acids were saponified, methylated and methyl esters were extracted. Then, the methyl esters of the fatty acids were analyzed by capillary gas chromatography using external standards for quantitation.
From the measured fatty acid composition, the following classes of fatty acids were summed: total fat (calculated as triglycerides), total-fatty acids, monounsaturated fatty acids (cis-isomers), polyunsaturated fatty acids (cis-isomers), saturated fatty acids and trans-fatty acids. The amount of unsaturated fat was calculated as the sum of monounsaturated and polyunsaturated fatty acids and the amount of solid fat as the sum of saturated and trans-fatty acids. Total fat and fatty acid classes were expressed in g per 100 g fresh weight of edible food (g/100 g) and in g per 14 g fresh weight of edible food (g/14 g). Fourteen gram was chosen as a portion because it is the typical serving size for spreads in the USA. In addition, fatty acids were expressed as a percentage of total-fatty acids in order to assess the fatty acid composition of products independently of the total-fat content. We also calculated the ratio of stearic acid (C18:0) to total saturated fatty acids as an indicator of differences in the composition of specific saturated fatty acids. For the 2013 sample, from the label of each product, we additionally examined the ingredient list and the Nutrition Facts label. From the ingredient list we determined the presence of PHVO, knowing that, at the time of our study, the Food and Drug Administration regulations required PHVO to be listed unless used as a process aid in incidental amounts. From the Nutrition Facts label we assessed whether trans fat was reported as zero or different from zero, knowing that, in the USA, food products can be labeled as 0 g trans fat when they contain less than 0.5 g trans fat per serving (FDA, 21CFR101.9, revised in Citation2015).
Assessment of time trends
For assessing time trends, we searched for surveys reporting the fat composition of US spreads from nationally representative samples and obtained from analytical determinations. We found four studies that assessed the fat composition of spreads in the USA, but only one met our inclusion criteria. Otite and colleagues (Citation2013) documented the progress in reducing trans fat for 11 US spreads between 2007 and 2011, by assessing the Nutrition Facts label and the ingredient list of products on sale in major US grocery stores. In 2009 and 2010, Doell and colleagues screened the Nutrition Facts label and the ingredient list of 38 spreads on sale in the US marketplace and selected based on market share. In 2006, Albers and colleagues (Citation2008) surveyed the Nutrition Facts label of 24 US spreads sampled in Minneapolis (Albers et al. Citation2008). Satchithanandam and colleagues (Citation2004) assessed analytically the fat composition of seven US market leader products, which were on sale in the US marketplace in 2002. This last survey met both inclusion criteria and therefore it was the only one selected to quantify time trends (Satchithanandam et al. Citation2004).
Data analysis
For both the 2011 and the 2013 samples, the analysis of branded products was conducted separately from the analysis of private label products because the sample of branded products was based on market share, while the sample of private label products was based on in-store availability. For branded products, sales volume weighted averages were calculated in order to describe the fat composition of vegetable oil spreads sold in the US market in a way that reflected what people were likely to buy and consume in 2011 and in 2013. For private label products, arithmetic averages were calculated. Both branded and private label products assessed in 2013 were divided in the following product types: tubs, sticks, or sprays; regular or light products; products with or without PHVO (PHVO-free). For the assessment of time trends, we used sales volume weighted averages for both the 2013 and 2011 samples and arithmetic averages for the 2002 sample (Satchithanandam et al. Citation2004), due to the fact that sales volume data were not available for this sample. However, Satchithanandam and colleagues stated that they only included products with a high market share, so that the arithmetic averages for the 2002 sample should be close to the sales volume weighted averages at that time. Data are presented as average ± standard deviation, and minimum and maximum are reported when relevant.
Results
The fat composition of each of the 37 branded and 9 private label spreads that were assessed in the US market in 2013 is presented in . Of the 37 branded spreads, 29 were soft spreads in a tub format, 2 were in a spray format and 6 were hard spreads in a stick format. Seven branded spreads were labeled as “light” (all tubs), 4 contained PHVO (2 tubs and 2 sticks), and 2 had trans fat different from zero in the Nutrition Facts label (all sticks). Of the 9 private label spreads, 6 were soft spreads in a tub format and 3 were spreads in a stick format. Six private label spreads contained PHVO (3 tubs and 3 sticks) and 4 had trans fat different from zero in the Nutrition Facts label (1 tub and 3 sticks). At the time of the sampling, some manufacturers and retailers declared trans fat as zero for their whole portfolio, some declared trans fat as zero only for their soft products in a tub, and some were selling no products with trans fat declared as zero.
Table 1. Total fat and fatty acid composition of spreads and margarines in the US market in 2013Table Footnotea.
presents the sales-weighted averages for the fat composition of different product categories for the sample of branded spreads in 2013. The average total fat content of branded spreads as available in the US marketplace in 2013 and weighted by sales volume was 7.1 ± 1.2 g per 14 g serving (range: 5.0–12.4 g). One 14 g serving of branded spreads contained on average 0.2 ± 0.5 g of trans fatty acids (range: 0.0–1.6 g), 1.8 ± 0.5 g of saturated fatty acids (range: 0.8–4.6 g), 1.8 ± 0.6 g of monounsaturated fatty acids (range: 1.1–5.1 g), 3.0 ± 0.7 g of polyunsaturated fatty acids (range: 1.1–4.2 g), 0.3 ± 0.1 g of α-linolenic acid (range: 0.2 –0.6 g) and 2.6 ± 0.6 g of linoleic acid (range: 0.9–3.6 g).
Table 2. Total fat and fatty acid composition of different product types of branded spreads and margarines as sold in the US market in 2013Table Footnotea.
On average, in 2013, light branded spreads had 24% less total fat than regular branded spreads with a similar fatty acid composition. Branded spreads in a stick format contained on average 7% more fat than branded spreads in a tub format and had a different fat composition: solid fat (saturated plus trans-fatty acids) was greater in stick spreads than in tub spreads (38.0% versus 27.3% of total-fatty acids), as a result of the higher percentage of trans-fatty acids (11.7% versus 0.3% of total-fatty acids), while unsaturated fat (monounsaturated plus polyunsaturated fatty acids) was lower in stick products than in tub spreads (62.0% versus 72.7% of total-fatty acids). When weighting the data by sales volume, 86% of all branded spreads was free of PHVO (46% of stick spreads, 99% of soft spreads in a tub or spray format). Spreads containing PHVO had a total-fat content similar to PHVO-free spreads, but a different fat composition. Compared to PHVO-free spreads, spreads with PHVO had a higher percentage of trans-fatty acids (21.5% versus 0.3% of total-fatty acids), a higher percentage of solid fat (42.3% versus 27.9% of total-fatty acids), and a lower percentage of unsaturated fat (57.8% versus 72.1%). Spreads with PHVO also had a higher ratio of C18:0 to total-saturated fatty acids (0.43 vs 0.17) (data not shown), probably as a consequence of some saturation of C18:2 to C18:0 during the partial hydrogenation process of liquid vegetable oils.
reports the arithmetic averages for the fat composition of different product categories for the nine private label spreads that were selected in 2013 based on in-store availability. Compared to branded spreads, private label spreads contained on average more total fat (8.6 versus 7.1 g/14 g serving) and more trans-fatty acids (10.0% versus 3.2% of total-fatty acids). Similarly to branded spreads, private label spreads containing PHVO had a higher percentage of trans-fatty acids, a higher percentage of solid fat and a lower percentage of unsaturated fat than private label PHVO-free spreads. The detailed fat composition of the 46 spreads assessed in 2013 and of the 44 spreads assessed in 2011 are reported in Supplemental Tables S1-S3.
Table 3. Total fat and fatty acid composition of different product types of private label spreads and margarines in the US market in 2013Table Footnotea.
and show the time trends of the fat composition of spreads as sold in the US marketplace from 2002 (Satchithanandam et al. Citation2004) to 2011 and 2013. Compared to 2002, total fat decreased from 9.3 ± 0.9 g (mean ± SD) to 7.4 ± 1.3 g in 2011 and to 7.1 ± 1.2 g in 2013 (). Trans-fatty acids decreased both on a per serving basis (from 1.7 ± 0.4 in 2002 to 0.5 ± 0.7 in 2011 and 0.2 ± 0.5 g in 2013) and as a percentage of total-fatty acids (from 19.2 ± 5.2% in 2002 to 6.7 ± 9.3% in 2011 and 3.2 ± 7.3% in 2013). Saturated fatty acids remained constant on a per serving basis and slightly increased as a percentage of fatty acids (from 19.5 ± 5.2% in 2002 to 24.6 ± 4.1% in 2011 and 26.7 ± 3.7% in 2013). Polyunsaturated fatty acids changed very little between 2002 and 2013 on a per serving basis, but increased as a percentage of total-fatty acids (from 31.1 ± 3.7% in 2002 to 44.3 ± 9.2% in 2013). illustrates that solid fat (saturated + trans-fatty acids) decreased by 23% from 38.7 ± 2.9% in 2002 to 29.9 ± 5.8% of total-fatty acids in 2013, while the percentage of unsaturated fat (monounsaturated + polyunsaturated fatty acids) increased by 14% from 61.3 ± 2.9% in 2002 to 70.1 ± 5.8% of total-fatty acids in 2013.
Figure 1. Unsaturated fat and solid-fat content (% of total-fatty acids) in spreads available in the USA: trend from the year 2002 to 2013. The seven products sampled in 2002 were selected based on market share (Satchithanandam et al. Citation2004); the products sampled in 2011 and in 2013 represent >75% of the market, and are weighted by their sales volume. The analysis of fatty acids was done by gas chromatography. Notes: solid fat: sum of saturated fatty acids and trans-fatty acids; unsaturated fat: sum of monounsaturated fatty acids and polyunsaturated fatty acids; spreads: spreads and margarines.
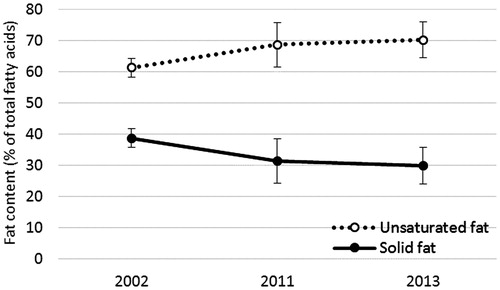
Table 4. Total fat and fatty acid composition of spreads and margarines as sold in the US market in 2002, 2011 and 2013Table Footnotea.
Discussion
Summary of the findings
In the present survey, we showed that one 14 g serving of spreads sold in the US marketplace in 2013 contained on average 7.1 g of fat, of which 0.2 g trans-fatty acids, 1.8 g saturated fatty acids, 1.8 g monounsaturated fatty acids and 2.9 g polyunsaturated fatty acids. The vast majority of branded spreads and virtually all branded soft spreads in 2013 were PHVO-free. When comparing different product types, we found that light (low-fat) spreads had a similar fatty acid composition to regular spreads, regardless of the lower fat content. Products in a stick format (wrapper) contained more solid fat than products in a tub since more solid fat is needed to make a stick with acceptable product properties. The sample of private label products had a higher amount of trans-fatty acids than branded products, with most of the products containing PHVO. In general, spreads declaring PHVO on the ingredient list had a higher percentage of trans-fatty acids, a higher percentage of solid fat and a lower percentage of unsaturated fat than PHVO-free spreads. We found that the average fat composition of US spreads substantially changed over the last 10 years. From 2002 to 2013, the total-fat content decreased by 2.2 g per serving (23% reduction), while trans-fatty acids decreased by 1.5 g per serving (86% reduction). As a percentage of total-fatty acids, solid fat significantly decreased, mainly due to a decrease of trans-fatty acids, while unsaturated fat increased, mainly driven by polyunsaturated fatty acids.
Strengths and weaknesses
This is the first time that a representative analytical product survey was conducted to assess the fat composition of vegetable oil spreads sold in the United States. Previous reports were either based on a limited sample set or based on information reported on the food label in the Nutrition Facts label and in the ingredient list. Our 2013 survey covered more than 80% of the market share by volume. From these market share data, sales weighted averages were calculated, which are more relevant than arithmetic averages because they better reflect what people buy and eat. This approach is recognized by various governmental public health authorities, which, for example, used sales-weighted averages to set category-based targets for sodium in the UK, Canada and the city of New York (New York City Health Department Citation2010; Health Canada Citation2012; Wyness et al. Citation2012).
This survey has some limitations. It was not possible to include private label products in the sales weighted averages, as market share data could not be obtained. The selection of private label products depended on in-store availability and therefore the sample of private label products was less representative and of a more narrow range. However, the products that were purchased represented the leading spreads of the main national grocery chains and therefore the most likely to be purchased by shoppers who select private label products. The products selected in 2013 were sampled from the North East rather than nationally and only a single consumer unit was analyzed for each product. The coefficient of variation of the more comprehensive sample taken in 2011 found little variation within products, supporting the idea that the sample obtained in 2013 (including one consumer unit per product) can be considered representative. Finally, when comparing the results of our 2013 survey with the results of the 2002 survey (Satchithanandam et al. 2004), it is important to note that these two surveys differ for sampling methods and number of products tested.
Our findings in the context of the existing literature
The present study shows that the trans-fat content and the use of PHVO as an ingredient in US spreads substantially changed between 2002 and 2013. In 2013, the majority of soft spreads were no longer made using PHVO, and contained low levels of trans-fatty acids. In this 2013 survey, the average trans-fatty acid content of PHVO-free spreads was 0.3% (of total-fatty acids). In the past decade, four other studies assessed the trans-fat content and the presence of PHVO in spreads in the US market (Satchithanandam et al. Citation2004; Albers et al. Citation2008; Doell et al. Citation2012; Otite et al. Citation2013). While these studies differed in sample size, representativeness and in methods of determining trans fat composition, they provide a reference point for recent changes to the fat composition of spreads. The survey conducted in 2002, representing the fat composition of spreads before the mandatory labeling of trans fat in 2006, reported that none of the seven spread products assessed were labeled as containing 0 g trans fat (<0.5 g trans fat per serving) and the average trans-fat content was 19% of total fat (Satchithanandam et al. Citation2004). In other words, all products were produced using PHVO and contained significant amounts of trans fat. In 2006, a survey assessed 24 US spreads and reported that 16 products (66%) were labeled as containing 0 g trans fat (<0.5 g per 14 g serving), and that the average trans-fat content was 6.6% of total fat (Albers et al. Citation2008). These results demonstrate that significant reformulation to reduce trans fat in the USA occurred as a result of the mandatory trans-fat labeling. Otite and colleagues assessed changes from 2007 to 2011 of 11 spreads (nine sticks and two tubs) that were labeled as containing trans fat in 2007. In that study, from 2007 to 2011, the average amount of trans fat per 14 g serving decreased only by 19% (from 2.0 g to 1.6 g) indicating little reformulation in that sample including mainly stick products. Products surveyed between 2009 and 2010 by Doell and colleagues (2012) found that 71% of US spreads were labeled as containing 0 g trans fat (<0.5 g trans fat per serving), corresponding to 27 out of 38 products. In 2013, we found that 35 out of the 37 assessed branded spreads (95%) were labeled as containing 0 g trans fat (<0.5 g trans fat per serving). The two branded products still containing more than 0.5 g trans fat per serving were in a stick format (wrapper). We also found that the average trans-fatty acids content in branded products decreased from 6.7% of total-fatty acids in 2011 to 3.2% in 2013. Overall, these data show that efforts to reformulate soft spreads in a tub format started before the introduction of the mandatory labeling of trans fat in 2006 and continued through 2013. However, the reformulation of stick products started later and is still not completed. Among branded spreads in a stick format in our 2013 sample, four out of six products did not contain PHVO. This confirms that the technology to make sticks without PHVO has been developed, but that reformulation is still taking place (Wesdorp et al. Citation2014).
Finally, the private label products that we sampled in 2013, including both soft spreads in a tub and stick products, contained more trans-fatty acids than branded products, with six out of nine products manufactured using PHVO. In June 2015, the Food and Drug Administration (FDA) released its final determination that partially hydrogenated oils are no longer Generally Recognized as Safe (GRAS) and has set a compliance period of 3 years (FDA Citation2015). This regulation will require that the remaining partially hydrogenated oils found in spreads to be removed over the next 3 years.
Concerns have been voiced that food manufacturers may replace trans fat with saturated fat in order to keep solid fat content high (Eckel et al. Citation2007). In the present study it was found that, whilst trans fat decreased from 2002 to 2013, the absolute saturated fat content of spreads remained stable, resulting in an absolute reduction in solid fat (saturated fatty acids plus trans fatty acids). An improvement in quality of the overall fat composition of spreads was achieved through technical innovations in emulsion technologies that require less solid fat to achieve good product properties (Wesdorp et al. Citation2014). Without these technical developments, trans fat would have been replaced by other solid (saturated) fat. The results of two other North American studies confirm that, over the past 10–15 years, supermarket and restaurant foods decreased trans fat without concomitantly increasing saturated fat (Ratnayake et al. Citation2009; Mozaffarian & Jacobson Citation2010).
We also compared our results with those of the USDA-FNDDS Reference Data (USDA-NNDSR, 2014; USDA-Standard Reference, 2015) and found that the USDA-FNDDS Reference Data indicate a higher total-fat content per serving. According to the USDA-FNDDS Reference Data, the trans-fatty acid amounts of stick and tub products are, respectively, ∼20% and 7% of total-fatty acids, while these are 12% and 0.3% of total-fatty acids in our 2013 survey. In addition, the content of both saturated and polyunsaturated fatty acids is somewhat lower and the content of monounsaturated fatty acids is somewhat higher according to the USDA-FNDDS Reference Data. It should be noted that the current Reference Data do not yet reflect the significant changes in the fatty acid composition of spreads that took place in recent years, and therefore an update is highly recommended.
While the solid fat content of spreads declined, the unsaturated fat content, as a proportion of total-fatty acids, increased. In North America, it is recommended to limit saturated fat to 7–10% of energy and to consume at least 5–10% of energy from polyunsaturated fat (U.S. Department of Agriculture and U.S. Department of Health and Human Services Citation2010; Food and Nutrition Board, Institute of Medicine Citation2002/2005). For male adults in North America, the recommended daily intakes of the essential polyunsaturated fatty acids omega-3 α-linolenic acid and omega-6 linoleic acid are 1.6 g and 17 g, respectively (Food and Nutrition Board, Institute of Medicine Citation2002/2005). To achieve these intakes, it is recommended to consume non-tropical vegetable oils as a substitute for foods high in saturated fat, such as butter and meat fat (Health Canada Citation2007; Eckel et al. Citation2014; Vannice & Rasmussen Citation2014; Dietary Guidelines Advisory Committee Citation2015). Vegetable oil spreads are made from liquid vegetable oils such as soybean, canola and sunflower oils, rich in monounsaturated and omega-3 and omega-6 polyunsaturated fatty acids and small amounts of solid fat are needed to create a stable emulsion with a specific texture. In fact, some countries specifically recommend “0 g trans fat” vegetable oil soft spreads as a replacement for animal fat (Health Canada Citation2007; Australian government Citation2013). These recommendations are supported by a large body of evidence on the benefits of replacing saturated fat with similar amounts of unsaturated fat for primary prevention of coronary heart disease (Mensink et al. Citation2003, Jakobsen et al. Citation2009; Mozaffarian et al. Citation2010; Farvid et al. Citation2014). The present study shows that one 14 g serving of the average spread in the US market in 2013 provides 22% and 15% of the recommended daily intakes for male adults in North America of omega-3 α-linolenic acid and omega-6 linoleic acid, respectively. Moreover, replacing one 14 g serving of butter with one serving of PHVO-free spread, will reduce the intake of saturated fatty acids from 7.3 to 1.9 g (∼70%), and will increase the intake of unsaturated fatty acids from 3.4 to 4.9 g (∼40%) (USDA-Standard Reference, 2015, code 01001). Thus, modern PHVO-free spreads can significantly contribute to the intake of recommended levels of healthy fats.
Finally, in the present study we found that total-fat content of US spreads decreased between 2002 and 2013. This can be explained by a gradual reduction of fat in regular spreads, following consumer demand for lower fat products, and by an increased proportion of light products on the market. In a survey in 2002 (Satchithanandam et al. Citation2004), no light (lower-fat) products were sampled indicating the relatively small presence of this type of product on the market at that time. In our 2013 survey, light products represented more than 15% of the market share.
Conclusion
This national 2013 survey shows that the fat quality of vegetable-oil-based spreads in the US substantially improved over the last decade. This is reflected by a significant removal of trans fat, a decrease in solid fat (saturated-fatty acids plus trans-fatty acids), and an increase in the proportion of unsaturated fat. In 2013, the majority of US branded spreads (86% by sales volume), and in particular soft spreads in a tub format (99% by sales volume), no longer contained partially hydrogenated vegetable oils. The fatty-acid composition of spreads as sold in 2013 was in line with dietary recommendations. Modern spreads can contribute to an overall healthy diet by providing healthy, unsaturated fat. As a result of the FDA determination in June 2015 that partially hydrogenated oils are not GRAS, a further reduction of trans fat from partially hydrogenated oils is expected over the next 3 years in the food supply including spreads.
Funding information
The study was financially supported by Unilever US Inc.
Supplemental Tables S1-S3
Download PDF (417.7 KB)Disclosure statement
All authors are employees of Unilever. Unilever markets food products made of vegetable oils, including spreads.
Related Research Data
References
- Ahuja JKC, Lemar L, Goldman JD, Moshfeg AJ. 2009. The impact of revising fats and oils data in the US food and nutrient database for dietary studies. J Food Comp Anal. 22:S63–S67.
- Albers MJ, Harnack LJ, Steffen LM, Jacobs DR. 2008. 2006 marketplace survey of trans-fatty acid content of margarines and butters, cookies and snack cakes, and savory snacks. J Am Diet Assoc. 108:367–370.
- AOAC. 2012. Official method no. 996.06, official methods of analysis of the AOAC international (modified). 19th ed. Gaithersburg, Maryland: AOAC international.
- Arcand J, Scourboutakos MJ, Au JT, L'abbe MR. 2014. Trans fatty acids in the Canadian food supply: an updated analysis. Am J Clin Nutr. 100:1116–1123.
- Ascherio A, Katan MB, Zock PL, Stampfer MJ, Willett WC. 1999. Trans fatty acids and coronary heart disease. N Engl J Med. 340:1994–1998.
- Australian Government, National Health and Medical Research Council and Department of Health and Aging. 2013. Eat for health. Australian Dietary Guidelines; [cited 2015 Dec]. Available from: http://www.eatforhealth.gov.au/sites/default/files/files/the_guidelines/n55a_australian_dietary_guidelines_summary_131014.pdf.
- Dietary Guideline Advisory Committee. 2015. Scientific report of the 2015 dietary guidelines advisory committee. Advisory report to the secretary of health and human services and the secretary of agriculture; [cited 2015 Dec]. Available from: https://ods.od.nih.gov/pubs/2015_DGAC_Scientific_Report.pdf.
- Doell D, Folmer D, Lee H, Honigfort M, Carberry S. 2012. Updated estimate of trans fat intake by the US population. Food Addit Contam Part a Chem Anal Control Expo Risk Assess. 29:861–874.
- Downs SM, Thow AM, Leeder SR. 2013. The effectiveness of policies for reducing dietary trans fat: a systematic review of the evidence. Bull World Health Organ. 91:262–269H.
- Eckel RH, Borra S, Lichtenstein AH, Yin-Piazza SY, Trans Fat Conference Planning Group. 2007. Understanding the complexity of trans fatty acid reduction in the American diet: American heart association trans fat conference 2006: report of the trans fat conference planning group. Circulation. 115:2231–2246.
- Eckel RH, Jakicic JM, Ard JD, de Jesus JM, Houston Miller N, Hubbard VS, Lee IM, Lichtenstein AH, Loria CM, Millen BE, et al. American College of Cardiology/American Heart Association Task Force on Practice Guidelines. 2014. 2013 AHA/ACC guideline on lifestyle management to reduce cardiovascular risk: a report of the American college of cardiology/American heart association task force on practice guidelines. J Am Coll Cardiol. 63:2960–2984. (Epub 2013 Nov 12. Erratum in J Am Coll Cardiol 2014 Jul 1;63(25 Pt B):3027–3028).
- EFSA Panel on Dietetic Products, Nutrition and Allergies (NDA). 2004. Opinion of the scientific panel on dietetic products, nutrition and allergies [NDA] related to the presence of trans fatty acids in foods and the effect on human health of the consumption of trans fatty acids The EFSA J. 81:1–49.
- Farvid MS, Ding M, Pan A, Sun Q, Chiuve SE, Steffen LM, Willett WC, Hu FB. 2014. Dietary linoleic acid and risk of coronary heart disease: a systematic review and meta-analysis of prospective cohort studies. Circulation. 130:1568–1578.
- FDA, Department of Health and Human Services. 2015. Final determination regarding partially hydrogenated oils. Federal register, Volume 80, N. 116, June 17, 2015 Notice. Available from: https://www.gpo.gov/fdsys/pkg/FR-2015-06-17/pdf/2015-14883.pdf
- Food and Nutrition Board, Institute of Medicine. 2002/2005. Dietary reference intakes for energy, carbohydrate, fiber, fat, fatty acids, cholesterol, protein, and amino acids. Washington, D.C : The National Academies Press; [cited 2015 Jan 20]. Available from: http://www.nal.usda.gov/fnic/DRI/DRI_Energy/energy_full_report.pdf.
- Health Canada. 2007. Eating well with Canada’s food guide; [cited 2015 Dec]. Available from: http://www.hc-sc.gc.ca/fn-an/alt_formats/hpfb-dgpsa/pdf/food-guide-aliment/print_eatwell_bienmang-eng.pdf.
- Health Canada. Bureau of Nutritional Sciences. Food directorate. Health products and food branch. 2012. Guidance for the food industry on reducing sodium in processed foods; [cited 2015 Jan 20]. Available from: http://www.hc-sc.gc.ca/fn-an/alt_formats/pdf/legislation/guide-ld/2012-sodium-reduction-indust-eng.pdf.
- IMACE, European Margarine Association. 2015. Health effects of margarines and fat spreads. Available from: http://www.imace.org/files/files/FINAL-IMACE-Scientific-dossier-Health-effects-of-margarine-scientific-overview.pdf.
- Jakobsen MU, O'reilly EJ, Heitmann BL, Pereira MA, Bälter K, Fraser GE, Goldbourt U, Hallmans G, Knekt P, Liu S, et al. 2009. Major types of dietary fat and risk of coronary heart disease: a pooled analysis of 11 cohort studies. Am J Clin Nutr. 89:1425–1432.
- Joint WHO/FAO expert consultation on diet, nutrition and the prevention of chronic diseases (2002: Geneva, Switzerland). 2003. Diet, nutrition and the prevention of chronic diseases: report of a joint WHO/FAO expert consultation, Geneva, 28 January – 1 February 2002. WHO technical report series.
- Kroustallaki P, Tsimpinos G, Vardavas CI, Kafatos A. 2011. Fatty acid composition of Greek margarines and their change in fatty acid content over the past decades. Int J Food Sci Nutr. 62:685–691.
- L'abbé MR, Stender S, Skeaff CM, Ghafoorunissa Tavella M. 2009. Approaches to removing trans fats from the food supply in industrialized and developing countries. Eur J Clin Nutr. 63:S50–S67.
- Mensink RP, Katan MB. 1990. Effect of dietary trans fatty acids on high-density and low-density lipoprotein cholesterol levels in healthy subjects. N Engl J Med. 323:439–445.
- Mensink RP, Zock PL, Kester AD, Katan MB. 2003. Effects of dietary fatty acids and carbohydrates on the ratio of serum total to HDL cholesterol and on serum lipids and apolipoproteins: a meta-analysis of 60 controlled trials. Am J Clin Nutr. 77:1146–1155.
- Meremäe K, Roasto M, Kuusik S, Ots M, Henno M. 2012. Trans fatty acid contents in selected dietary fats in the Estonian market. J Food Sci. 77:T163–T168.
- Micha R, Khatibzadeh S, Shi P, Fahimi S, Lim S, Andrews KG, Engell RE, Powles J, Ezzati M, Mozaffarian D. Global Burden of Diseases Nutrition and Chronic Diseases Expert Group NutriCoDE. 2014. Global, regional, and national consumption levels of dietary fats and oils in 1990 and 2010: a systematic analysis including 266 country-specific nutrition surveys. BMJ. 348:g2272.
- Mozaffarian D, Micha R, Wallace S. 2010. Effects on coronary heart disease of increasing polyunsaturated fat in place of saturated fat: a systematic review and meta-analysis of randomized controlled trials. PLoS Med. 7:e1000252.
- Mozaffarian D, Jacobson MF. 2010. Food reformulations to reduce trans fatty acids. N Engl J Med. 362:2037–2039.
- National Advisory Committee on Nutritional Education (NACNE). 1983. A discussion paper on proposals for nutritional guidelines for health education in Britain. London: Health education council.
- New York City Health Department. National Sodium Reduction Initiative. Packaged food categories and targets. 2010; [cited 2015 Jan 25]. Available from: http://www.nyc.gov/html/doh/downloads/pdf/cardio/packaged-food-targets.pdf.
- Otite FO, Jacobson MF, Dahmubed A, Mozaffarian D. 2013. Trends in trans fatty acids reformulations of US supermarket and brand-name foods from 2007 through 2011. Prev Chronic Dis. 10:120198.
- Ratnayake WMN, Gagnon C, Dumais L, Lillycrop W, Wong L, Meleta M, Calway P. 2007. Trans fatty acid content of Canadian margarines prior to mandatory trans fat labelling. J Am Oil Chem Soc. 84:817–825.
- Ratnayake WMN, L’abbe MR, Mozaffarian D. 2009. Nationwide product reformulations to reduce trans fatty acids in Canada: when trans fat goes out, what goes in? Eur J Clin Nutr. 63:808–811.
- Ricciuto L, Lin K, Tarasuk V. 2009. A comparison of the fat composition and prices of margarines between 2002 and 2006, when new Canadian labelling regulations came into effect. Public Health Nutr. 12:1270–1275.
- Ritvanen T, Putkonen T, Peltonen K. 2012. A comparative study of the fatty acid composition of dairy products and margarines with reduced or substituted fat content. Food Nutr Sci. 3:1189–1196.
- Satchithanandam S, Oles CJ, Spease CJ, Brandt MM, Yurawecz MP, Rader JI. 2004. Trans, saturated, and unsaturated fat in foods in the United States prior to mandatory trans-fat labeling. Lipids. 39:11–18.
- Select committee on nutrition and human needs. 1977. Dietary goals for the United States. 1st ed. Washington: US Govt Print Off.
- Stone NJ, Robinson JG, Lichtenstein AH, Bairey Merz CN, Blum CB, Eckel RH, Goldberg AC, Gordon D, Levy D, Lloyd-Jones DM, et al. American College of Cardiology/American Heart Association Task Force on Practice Guidelines. 2014. 2013 ACC/AHA guideline on the treatment of blood cholesterol to reduce atherosclerotic cardiovascular risk in adults: a report of the American college of cardiology/american heart association task force on practice guidelines. J Am Coll Cardiol. 63:2889–2934. (Epub 2013 Nov 12. Erratum in J Am Coll Cardiol. 2014. 63(25 Pt B):3024–3025).
- Upritchard JE, Zeelenberg MJ, Huizinga H, Verschuren PM, Trautwein EA. 2005. Modern fat technology: what is the potential for heart health? Proc Nutr Soc. 64:379–386.
- US Department of Agriculture, Agricultural Research Service, Nutrient Data Laboratory. USDA national nutrient database for standard reference, release 28. Version current; [cited 2015 Sep]. Available from: http://www.ars.usda.gov/nea/bhnrc/ndl.
- U.S. Department of Agriculture and U.S. Department of Health and Human Services. 2010. Dietary Guidelines for Americans, 2010. 7th ed. Washington DC: U.S. Government Printing Office.
- U.S. Department of Agriculture and U.S. Department of Health and Human Services. 2005. Dietary Guidelines for Americans, 2005. 6th ed. Washington, DC: U.S. Government Printing Office.
- U.S. Department of Agriculture, Agricultural Research Service. 2014. USDA food and nutrient database for dietary studies 2011–2012. Food surveys research group home page. Available from: http://www.ars.usda.gov/ba/bhnrc/fsrg.
- U.S. Department of Agriculture, Agricultural Research Service. 2014. USDA national nutrient database for standard reference, release 28. Nutrient data laboratory home page. Available from: http://www.ars.usda.gov/nutrientdata.
- Vannice G, Rasmussen H. 2014. Position of the academy of nutrition and dietetics: dietary fatty acids for healthy adults. J Acad Nutr Diet. 114:136–153. (Erratum in J Acad Nutr Diet. 2014. 114:644).
- Wesdorp LH, Melnikov SM, Gaudier EA. 2014. Trans fats replacement solutions in Europe. Urbana, IL: AOCS Press.
- Willett WC, Stampfer MJ, Manson JE, Colditz GA, Speizer FE, Rosner BA, Sampson LA, Hennekens CH. 1993. Intake of trans fatty acids and risk of coronary heart disease among women. Lancet. 341:581–585.
- Willett WC, Ascherio A. 1994. Trans fatty acids: are the effects only marginal? Am J Public Health. 84:722–724.
- Wyness LA, Butriss JL, Stanner SA. 2012. Reducing the population's sodium intake: the UK Food Standards Agency's salt reduction programme. Public Health Nutr. 15:254–261.