
Abstract
Dysregulation of the biological stress response system has been implicated in the development of psychological, metabolic, and cardiovascular disease. Whilst changes in stress response are often quantified as an increase or decrease in cortisol levels, three different patterns of stress response have been reported in the literature for the Trier Social Stress Test (TSST) (reactive-responders (RR), anticipatory-responders (AR) and non-responders (NR)). However, these have never been systematically analyzed in a large population-based cohort. The aims of this study were to examine factors that contribute to TSST variation (gender, oral contraceptive use, menstrual cycle phase, smoking, and BMI) using traditional methods and novel analyses of stress response patterns. We analyzed the acute stress response of 798, 18-year-old participants from a community-based cohort using the TSST. Plasma adrenocorticotrophic hormone, plasma cortisol, and salivary cortisol levels were quantified. RR, AR, and NR patterns comprised 56.6%, 26.2%, and 17.2% of the cohort, respectively. Smokers were more likely to be NR than (RR or AR; adjusted, p < 0.05). Overweight and obese subjects were less likely to be NR than the other patterns (adjusted, p < 0.05). Males were more likely to be RR than NR (adjusted, p = 0.05). In addition, we present a novel AUC measure (AUCR), for use when the TSST baseline concentration is higher than later time points. These results show that in a young adult cohort, stress-response patterns, in addition to other parameters vary with gender, smoking, and BMI. The distribution of these patterns has the potential to vary with adult health and disease and may represent a biomarker for future investigation.
Introduction
Dysregulation of the biological stress response system via the hypothalamic-pituitary-adrenal (HPA) axis has been implicated in the development of cardiovascular, metabolic, and mental health problems (Arlt & Stewart, Citation2005; Chrousos & Kino, Citation2007). However, it is important to first clarify the range of stress responses within a normal population and their relationship to factors contributing to that variation.
In a healthy human volunteer, the normal HPA axis response following a stress-inducing stimulus involves the release of adrenocorticotrophic hormone (ACTH) from the pituitary into the circulation within minutes. ACTH binds to its adrenal gland receptor resulting in cortisol secretion. The Trier Social Stress Test (TSST), is a standardized laboratory procedure for measuring an individual’s response to a psychosocial stress by stimulating reproducible increases in cortisol (Foley & Kirschbaum, Citation2010; Kirschbaum & Hellhammer, Citation2000; Kirschbaum et al., Citation1993a). Factors contributing to TSST variation in normal healthy populations include gender, oral contraceptive (OC) use, menstrual cycle phase, smoking, and obesity (Kudielka & Wust, Citation2010), although not all studies are in agreement with the size and direction of the effects.
Males generally display higher ACTH and cortisol responses compared with females not taking OC (Kirschbaum et al., Citation1999) although this is not always the case (Rohleder et al., Citation2001). Females taking OC show higher plasma cortisol responses but not salivary cortisol responses to stress compared with females not taking OC (Kirschbaum et al., Citation1999) though it is rare for studies to measure all three levels of the hormonal stress response. With regard to the menstrual cycle, HPA responses have been reported to be higher in the luteal phase (Felmingham et al., Citation2012; Kirschbaum et al., Citation1999), in the follicular phase (Huang et al., Citation2015; Maki et al., Citation2015) or show no change (Childs et al., Citation2010; Duchesne & Pruessner, Citation2013). Long-term smokers generally display a reduced or blunted HPA response compared with nonsmokers (Back et al., Citation2008; Childs & De Wit, Citation2009; Kirschbaum et al., Citation1993b; Rohleder & Kirschbaum, Citation2006). Finally, there are conflicting results on the impact of BMI with studies showing both a higher cortisol response with obesity (Benson et al., Citation2009) and a blunted cortisol response with increasing BMI (Jones et al., Citation2012).
Clearly most analyses identify a shift in the response curve up or down. Here we highlight a novel method, dependent instead on the particular shape of the hormonal stress response. Recently, there have been separate reports identifying distinct patterns of stress response apparent in the TSST data. For example, up to 30% of TSST participants do not show a notable increase in HPA axis activity with the TSST and have been termed “non-responders” (NR) (Kudielka et al., Citation2007). This distinct pattern of “non-responsiveness” has been found in patients with panic disorder (Petrowski et al., Citation2010), premenstrual syndrome (Huang et al., Citation2015), adverse early life events (Elzinga et al., Citation2008) and other negative health outcomes (Fries et al., Citation2005; Phillips et al., Citation2013), suggesting that this pattern of response may convey risk and warrants further study. People with high baseline HPA hormone levels, who appear to mount an HPA response in anticipation of a stressful event have been termed “anticipatory-responders” (AR) compared with those who respond at the time of the stressful event, “reactive-responders” (RR) (Engert et al., Citation2013). AR rates of 20–40% have been found in healthy men aged 18–30 in a modified TSST protocol (Engert et al., Citation2013). The anticipatory response pattern has been associated with PTSD (Bremner et al., Citation2003) and may vary with other disease states. While there has been some subgroup analysis in the literature of high- and low responders (Schommer et al., Citation2003) and responders versus NR in the menstrual cycle (Maki et al., Citation2015), to our knowledge, no previous study has analyzed TSST data in terms of these three stress response patterns. In addition, we specifically perform TSST measurements in an unselected teenage population to gain insight into the “normal” range of stress-induced HPA-activation. At this age, after puberty, the HPA axis reaches a new set-point and long-term HPA functioning is established (Mccormick & Mathews, Citation2010).
The first aim of this study was to investigate factors contributing to TSST variation across three levels of the HPA axis in a normal young adult cohort of large sample size to help resolve differences in the literature. These factors include gender, OC use, menstrual cycle, smoking, and BMI. Our second aim was to analyze the relationship between individual stress response patterns (RR, AR, and NR) and the same factors contributing to TSST variation. A novel AUC calculation is described, AUCR (with respect to concentration range) and multiple parameters were examined, essential to our understanding of the stress response and to facilitate comparison to other studies (Juster et al., Citation2012). We hypothesized that the distribution of these patterns would vary with gender, OC use, menstrual cycle, smoking, and BMI.
Materials and methods
Study design and participants
Participants included 1137 males and females from the 18-year follow-up of the Western Australian Pregnancy Cohort (Raine) Study (Newnham et al., Citation1993). At 18 years of age, participants were invited to attend and complete the TSST. Ethics approval for this study was obtained from the University of Western Australia Human Research Ethics Committee. All procedures were carried out with written informed consent from the participants. Prior to analysis, 116 individuals were sequentially eliminated for the following reasons: unable to complete TSST (n = 2); unusable blood/saliva samples (n = 3); severe menstrual pain (n = 1); pregnancy (n = 2); lactation (n = 2); type-1 diabetes (n = 4); use of exogenous steroids (n = 7); neuroactive medications (n = 22); anti-depressants (n = 19); or other medications affecting the HPA axis (n = 2); fainting (n = 15); or younger siblings of other participants violating assumptions of statistical independence of data (n = 37). Of the 1021 participants eligible for analysis, 806 had both blood and saliva collected and were used in the initial analyses.
Trier Social Stress Test protocols
The TSST was used to assess participant’s stress responses. All subjects arrived between midday and 3 p.m. for participation in the TSST between 1 p.m. and 4 p.m. to minimize the effects of diurnal variation in cortisol. Participants were instructed to refrain from eating or drinking for at least 1 h before their appointment and time of last meal/drink was recorded. Participants agreeing to have blood collected had an intravenous cannula inserted by an anesthetist 15 min after arrival. This was followed by a 45-min rest period during which participants completed a questionnaire relating to any illnesses, medication use, recent physical activity, smoking habits, timing and regularity of menstrual cycles, and OC use. Height and weight were measured for calculation of BMI. After resting for 45 min, blood samples were taken just prior to the Test (0 min), after completing the Test (15 min) and then at 25, 35, 45, 60, 75, and 105 min. Saliva samples were collected at 0, 15, 35, and 105 min. The test itself took 15 min to complete and consisted of 3-min preparation time alone, a free speech interview (5 min) and an arithmetic task (5 min) as per established protocols (Kirschbaum et al., Citation1993a; Kudielka et al., Citation2007). The test was performed in front of a non-responsive panel audience of three or four adults wearing formal clothing with a dummy video camera and mock audio equipment recording the interview and task. The panel reported on the participant’s response to the interview: (i) confident during interview, minimal prompting required; (ii) some prompting required to complete the interview; (iii) significant prompting required to the complete interview; and (iv) non-cooperative or not responsive to interview questions. Similarly, all panel members reported on the individual’s response to the arithmetic challenge: (i) willing to complete the task; (ii) mildly anxious while completing the task; (iii) became anxious/frustrated after incorrect answers, and (iv) non-cooperative or refused to complete task. Following the test, participants were debriefed on the goal of the study and the nature of the stressor. There is variation in the literature with regard to reporting TSST time points. We report time zero as the start of the TSST (Kirschbaum et al., Citation1993a).
Laboratory analysis of plasma and saliva
Blood was collected in BD Vacutainers containing EDTA (Becton, Dickinson and Company, Franklin Lakes, NJ) and saliva was obtained using Salivette collection devices (Sarstedt, Germany). Biological samples were kept on ice during the test, then centrifuged, aliquoted, and frozen at −80 °C until assayed. Total plasma cortisol and free salivary cortisol were quantified using the GammaCoatTM 125I cortisol radioimmunoassay (RIA) kit (DiaSorin, Stillwater, MN). Concentrations were converted from μg/dl to nmol/L by multiplying by 27.59. Plasma ACTH was measured by 125I immunoradiometric (IRMA) assay (DiaSorin, Stillwater, MN) as per the manufacturer’s instructions. All samples were assayed in duplicate against an appropriate standard curve and were repeated with additional dilutions, where required. For all assays, the intra and inter-assay variability was <10%. Inter-assay coefficients of variation for total and free cortisol, used in the criteria assigning participants to pattern groups, were 6.60% and 4.52% respectively.
TSST pattern groups
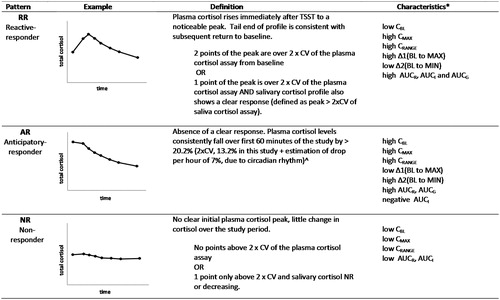
Naming of stress response patterns is aligned with previous reports of distinct response patterns in the literature (Engert et al., Citation2013; Schommer et al., Citation2003). The primary parameter used for stress pattern determination was the plasma total cortisol measured at eight regularly spaced time points. Additional information was derived from the secondary parameters of salivary cortisol and plasma ACTH. A set of criteria for the grouping of TSST patterns was developed and refined from examination of the literature and response data and is shown in . Briefly, a reactive response was defined as an increase in cortisol from baseline of greater than 2× the coefficient of variation (CV) of the cortisol assays (van Cauter & Refetoff, Citation1985), in this case 13.2% for the plasma cortisol assay and 9.04% for the salivary cortisol assay. This is in contrast to the use of an absolute increase in cortisol (e.g. 55.2 nmol/L and 2.5 nmol/L for total and salivary cortisol respectively) used by other studies (Engert et al., Citation2013; Petrowski et al., Citation2010), which may not effectively take individual baseline variation into consideration. An anticipatory response was defined as a drop from baseline of greater than 20.2% within the first 60 min; 20.2% was derived from twice the CV of the plasma cortisol assay (13.2%) plus an estimation of afternoon cortisol changes due to diurnal variation (approximately 7% per hour) obtained from the literature for blood (Cizza et al., Citation2012; Selmaoui & Touitou, Citation2003) and saliva (Heaney et al., Citation2012; Stone et al., Citation2001). NR did not show reactive or anticipatory responses. A small subset of eight individuals were unable to be categorized and displayed very unusual patterns. Due to the small numbers of participants in this category, it has been excluded from analyses, resulting in a final number of 798 used in the analyses presented.
Figure 1. Definitions of TSST stress response patterns. CV: coefficient of variation (*for a graphical representation of these parameters, see Supplementary Figure 1). ^Estimation of 7% plasma cortisol drop per hour due to circadian rhythm in the afternoon (Cizza et al., Citation2012; Selmaoui & Touitou, Citation2003); 7% salivary cortisol drop per hour (Heaney et al., Citation2012; Stone et al., Citation2001).
TSST parameter measures
Cortisol data from the TSST were reported using established definitions including: initial baseline concentration (CBL); peak concentration after stress (CMAX); change in concentration from baseline to maximum (Δ1(BL to MAX) = CMAX minus CBL); area under the curve above zero (with respect to ground)(AUCG) (Pruessner et al., Citation2003); and area under the curve above baseline (with respect to increase) (AUCI) both calculated using the trapezoidal rule (Pruessner et al., Citation2003). In addition, a number of additional variables were created to describe different aspects of the TSST data which include: minimum concentration (CMIN); concentration range (CRANGE = CMAX minus CMIN); change in concentration between baseline and minimum (Δ2(BL to MIN) = CBL minus CMIN); area under the curve (with respect to range) (AUCR). This calculation uses CMIN as the lower reference point for the area instead of CBL. See supplementary for a visual representation of these parameters.
Covariates
Gender and OC use were combined to create a single variable with three categories: males, females not taking the OC, and females taking the OC. BMI was categorized into underweight, normal, overweight, and obese as per standard definitions (Cole & Lobstein, Citation2012; Cole et al., Citation2000). Smoking status was analyzed as a simple dichotomous variable (smoker/non-smoker). In girls who reported regular cycles, menstrual cycle was divided into three categories; early follicular (day 1–8, reflecting low levels of estrogen and progesterone); ovulatory (day 9–19, reflecting high levels of estrogen and lower levels of progesterone) and late luteal (day 20–28, reflecting lower levels of estrogen and high levels of progesterone).
Statistical analysis
Cohort descriptive statistics were compared using t-tests for continuous variables and χ2-tests for categorical variables. Comparisons of TSST parameters were performed using non-parametric Kruskal–Wallis and Mann–Whitney U tests due to the asymmetrical distribution of the data.
General linear models (GLMs)/ANOVAs with repeated measures were used to assess differences between specified groups. In these analyses, a normal distribution was obtained through log transformation of ACTH and cortisol concentrations. Values were back-transformed after analysis to produce geometric means. These data are presented in graphical format. Differences between group TSST profiles were calculated using group by time effects consistent with similar studies. Greenhouse–Geisser corrections for sphericity were used where appropriate. Logistic regression models were used to determine the odds of being in a particular response group for analyses of gender group, smoking, and BMI. Menstrual cycle was not included as it showed no significant contribution to the univariate or multivariate models and would diminish female group sizes.
Results
Of the original 2868 participants, 2086 (73%) were eligible to be contacted at the age 18 review; 782 had withdrawn from the study, were lost to follow up or had died. Of these, 1137 adolescents participated in the TSST. This study focuses on 798 individuals with complete information for all three biomarkers (plasma ACTH, plasma cortisol, and salivary cortisol). Characteristics of study participants are shown in . Participants were just >18 years of age with slightly higher numbers of males than females. Males smoked significantly more than females and one third of females were taking OCs.
Table 1. Characteristics of Raine Study Trier Social Stress Test participants used in analyses.
TSST longitudinal analyses
We analyzed total results using GLM/ANOVA with repeated measures analysis to allow comparison with previous studies (). ACTH levels were significantly different across the three gender groups, F(4.2, 1620.6) = 4.11, p = 0.002. ACTH was consistently higher in males than females, and females on OC displayed lower ACTH levels compared with females not on OC. These data are supported by changes in CBL, CMAX, CMIN, CRANGE, AUCR, Δ1, and Δ2 (Supplementary Table 1). In contrast, for total cortisol levels, females on OC had higher levels than males who in turn had higher levels than females not on OC, F(6.2, 2322.9) = 9.96, p < 0.001 (see for supporting information). Salivary cortisol was consistently higher in males than females, F(4.4, 1664.4) = 7.24, p < 0.001; there were no differences between females taking and not-taking OC (see Supplementary for mathematical parameters). With regard to menstrual cycle, the changes in stress response over the early follicular, mid-ovulatory, and late luteal phases were not significant ().
Figure 2. TSST profiles with menstrual cycle, smoking, and obesity. Mean responses for ACTH, plasma cortisol, and salivary cortisol at each time point are shown with standard error bars.
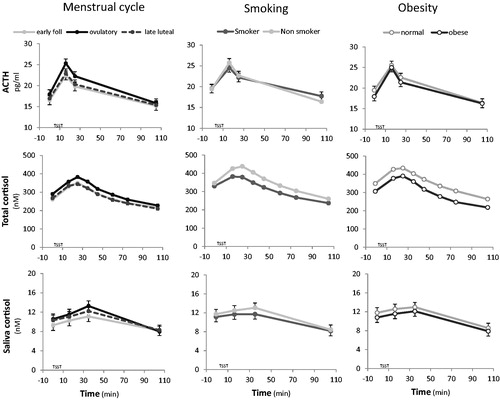
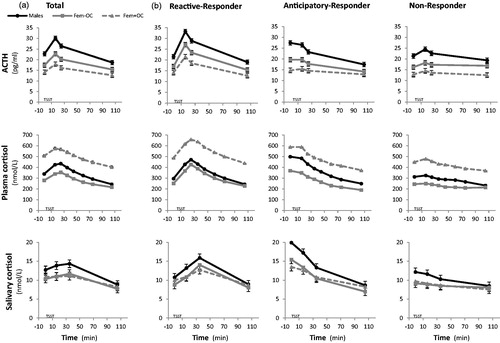
Figure 3. TSST response patterns by gender group. Mean responses for ACTH, plasma cortisol, and salivary cortisol at each time point are shown (a) with standard error bars for the total population and (b) separately for reactive, anticipatory, and non-responder patterns. Dark circles with solid lines represent males; gray squares with solid lines represent females not on OC; gray squares with dashed lines represent females taking OC.
The influence of smoking and obesity are also shown in . In smokers, ACTH and total plasma cortisol TSST profiles were significantly attenuated in comparison to nonsmokers, F(2.1, 1607.3) = 5.4, p = 0.004; F(3.1, 2305.5) = 3.22, p = 0.02, respectively. In addition, smokers showed reductions in mathematical parameters including significantly lower plasma cortisol CMAX (Mann–Whitney U = 7.2, p = 0.007), CMIN (U = 5.2, p = 0.02), AUCR (U =9.5, p = 0.002), AUCG (U =8.3, p = 0.005) and significantly lower plasma ACTH AUCR (U =5.2, p = 0.02) and CRANGE (U =4.4, p = 0.04), compared with nonsmokers. We saw no significant difference in salivary cortisol, F(2.24, 1670.9) = 1.16, p = 0.32 between smoking groups. We also found significantly reduced total plasma cortisol in obese participants compared with those with normal weight, F(3.08, 1563) = 3.18, p = 0.02. ACTH and salivary cortisol levels were not influenced by BMI, F(2.1, 1118.6) = 1.25, p = 0.29; F(2.25, 1165.6) = 0.04, p = 0.97, respectively. There were no significant dose-dependent responses across BMI categories and no significant differences in the mathematical parameters.
TSST stress response patterns
The RR pattern was observed in 56.7% of participants, followed by 26.3% AR pattern and 17.0% with NR pattern of those who had total plasma cortisol measured (). In univariate analyses, the distribution of RR, AR, and NR patterns was significantly different between males and females, smokers and nonsmokers, and across BMI groups. A greater proportion of males than females were RR; conversely more females than males were NR (p = 0.002). Compared with nonsmokers, fewer smokers were RR and more were AR and NR (p = 0.03). As BMI increased, a greater proportion of participants were RR with the highest proportion of NR seen in underweight participants (p = 0.01). In RR, the ACTH peak (15 min) preceded total plasma cortisol peak (25 min) which preceded the salivary cortisol peak (35 min), as expected (Kirschbaum et al., Citation1993b). There were no significant differences in the distributions of response patterns with the panel’s report on interview or arithmetic performance, the participant’s appointment time or time of last meal (data not shown).
Using traditional longitudinal analyses (ANOVA with repeated measures), the three stress response patterns were significantly different from each other for ACTH, F(4.2, 1591.5) = 91.9, p = <0.001, total plasma cortisol, F(6.9, 2565.9) = 159, p < 0.001, and salivary cortisol, F(4.9, 1819.2) = 149.1, p < 0.001.
presents the ACTH, plasma cortisol and salivary cortisol for the total cohort () and for the individual response groups () stratified by gender group. The influence of gender and OC use can clearly be seen in ACTH, total plasma cortisol and salivary cortisol levels. If all response groups are analyzed together (), sub-group effects of anticipatory and NR are not visible when the study numbers are sufficiently large. Logistic regression models examining the effect of gender, OC use, smoking, and BMI on TSST pattern group are presented in . We modeled the odds of being in NR versus (RR or AR) as both the AR and RR groups appear able to mount a clear HPA stress response. Smokers were more likely to be NR than RR/AR, after adjusting for sex, OC use, and BMI. Conversely, overweight and obese individuals were less likely to be NR than RR/AR and more likely to be a RR (after adjusting for gender group and smoking). Similar results were seen when AR was excluded and NR was compared with RR. Males had higher odds of being a RR (and lower odds of being a NR), compared with females not taking OC, after adjusting for smoking status and BMI.
Table 2. Distribution characteristics of TSST patterns by sex, OC use, smoking, and BMI.
Table 3. Logistic regression models.
Table 4. Total plasma cortisol TSST mathematical parameters by gender and stress response pattern.
Descriptive data characterizing the gender groups and TSST patterns (RR, AR, NR) are presented in (plasma cortisol), Supplementary Table 1 (ACTH) and Supplementary Table 2 (salivary cortisol). In this population, CMIN occurred at the end of the test, on the final sample in approximately 70% of cases. This suggests that the initial baseline sample is not the true baseline. For this reason, we describe a new AUC calculation, with respect to range (AUCR) instead of increase (AUCI). AUCR showed significant differences between gender groups across ACTH, plasma and salivary cortisol, while the traditional AUCI did not (see and Supplementary Tables 1 1 and 2). Significant differences were found in stress response patterns across all parameters except for CMIN (see for a summary of these differences).
Discussion
We have conducted the TSST in a large community-acquired population of young adults and here we report on the effects of gender, OC use, menstrual cycle, smoking, and BMI and describe data in terms of traditional and novel TSST parameters. Many of these factors have been investigated in studies with smaller sample sizes that do not examine the HPA axis at three levels (ACTH, plasma cortisol and salivary cortisol) and produce inconsistent results in the literature. Further, we define, characterize and analyze three patterns of stress hormone response; RR, AR, and NR and introduce a novel AUC calculation. The application of this approach to TSST data may represent a new biomarker to add to the established descriptive parameters describing TSST data.
When traditional methods of analysis (ANOVA with repeated measures) were used to examine the impact of gender on the TSST, our data were consistent with previous reports of higher ACTH, plasma, and salivary cortisol levels in males compared with females not taking OC (Kirschbaum et al., Citation1999). The potential modulating effects of corticosteroid-binding globulin (CBG) in women (Kirschbaum et al., Citation1999) and complex interactions between sex steroids and the regulation of glucocorticoid and mineralocorticoid receptors (Kudielka & Kirschbaum, Citation2005) may contribute to this consistently reported variation.
We found increased total plasma cortisol levels in females taking OC but unchanged salivary-free cortisol and decreased ACTH responses to stress compared with women not on OC. The increase in plasma cortisol is in part explained by the up-regulation of CBG by estrogen, resulting in a higher cortisol binding capacity (Kirschbaum et al., Citation1999). However, the ACTH and salivary cortisol data indicates OC use is potentially linked to HPA alterations at the level of ACTH, suggesting changes to pituitary sensitivity or cortisol feedback mechanisms from the high levels required to saturate CBG and maintain the same biologically active compartment. This is in contrast to previous studies showing no change in ACTH and lower salivary cortisol in women on OC, resulting in the conclusion that young women have a heightened adrenocortical sensitivity to ACTH (Kirschbaum et al., Citation1999; Kudielka & Kirschbaum, Citation2005). These differences may be due to the age of the women, length of time on OC or sample sizes. In support of our finding of reduced ACTH response in females taking OC, Kumsta et al. (Citation2007) found that high CBG levels in women were associated with reduced ACTH.
CBG levels may also vary over the menstrual cycle, increasing in response to estrogen (Coolens & Heyns, Citation1989). However, we did not find significant differences in ACTH, plasma, or salivary cortisol across the early follicular, ovulatory, or late luteal phases of the menstrual cycle. This suggests CBG does not vary enough to induce a significant change in total cortisol. We would therefore expect salivary cortisol, as a marker of free cortisol, to remain similar across the menstrual cycle. A recent report linking premenstrual syndrome with blunted cortisol stress reactivity suggests additional confounders may exist within the menstrual cycle data (Huang et al., Citation2015). We should note that this study was not designed to assess menstrual phase and as such we do not have hormone measures confirming estrogen/progesterone status and must make assumptions about cycle phase. Nonetheless, others who have investigated menstrual cycle using a similar method to us also found no change in ACTH or cortisol but did find alterations in cardiac index and epinephrine responses to the TSST over the menstrual cycle suggesting changes in other aspects of the sympathetic nervous system may be more prominent across the menstrual cycle (Gordon & Girdler, Citation2014).
Smokers have been shown to display an attenuated response to the TSST compared with nonsmokers (Kirschbaum et al., Citation1993a; Rohleder & Kirschbaum, Citation2006), a finding we confirm in this study. Nicotine is thought to activate the HPA axis via stimulation of nicotinic receptors in the brain; however, with chronic exposure to nicotine through smoking, desensitization occurs (Rohleder & Kirschbaum, Citation2006). While it is unclear how this attenuated HPA responsiveness is mediated, changes in glucocorticoid receptor level have been proposed (Kirschbaum et al., Citation1993a; Rohleder & Kirschbaum, Citation2006).
The relationship between increasing BMI/obesity and response to psychosocial stress has produced contradictory results in the literature (Benson et al., Citation2009; Jones et al., Citation2012). In traditional analyses, we found obese (but not overweight) participants displayed lower total plasma cortisol but similar salivary cortisol and ACTH responses to stress, compared with participants with normal BMI. In obesity, basal circulating cortisol levels are often normal or low-normal despite an elevation in the cortisol secretion rate (Bjorntorp & Rosmond, Citation2000). This is likely due to an increase in the rate of removal of cortisol from the circulation (Lottenberg et al., Citation1998). In women, cortisol reactivity to acute stress appears to alter with body fat distribution with more pronounced differences in central obesity (Epel et al., Citation2000). Differing patterns of fat distribution along with study sample sizes may contribute to some extent to the discrepancies in the literature relating TSST results to BMI.
Following the seminal publication of the TSST method in 1993 (Kirschbaum et al., Citation1993a), the majority of TSST studies have utilized approaches using ANOVA with repeated measures analyses to compare groups of interest. In addition, parameters such as areas under the curve (Pruessner et al., Citation2003) and peak hormone increase relative to baseline have proven very useful and can be used to compare results between publications. In general, differences in the stress response have been shown as a relative shift up or down in the hormone response curve. This study describes a novel approach to examining TSST data, in particular, the shape of the response curve. The three patterns identified include RR, AR, and NR to be used in conjunction with the previously established parameters.
A response to the TSST is often defined as an increase from baseline above an absolute value (for example, 2.5 mmol/L salivary cortisol). We suggest that a response be designated as the relative increase (twice the coefficient of assay variation), as originally recommended by the commonly cited article (van Cauter & Refetoff, Citation1985) instead of an absolute increase. This method increases transferability across different laboratories and takes assay variation and initial baseline levels into consideration. Others have also recently suggested reconsidering the use of the 2.5 mmol/L absolute increase with salivary cortisol (Miller et al., Citation2013).
We observed RR, AR, and NR rates of 56.6%, 26.2%, and 17.2%, respectively. In each response group, the same stress pattern was generally observed across ACTH, total plasma, and salivary-free cortisol. This RR rate is lower than the reported 70%–85% for the TSST in adult populations, possibly due to our use of updated response criteria in a younger population and the higher proportion of the study population with the AR pattern. There is some prior indication that the anticipatory response is much higher in adolescents (13–20 years) than in children (Evans et al., Citation2013). The presence of this early “anticipatory” rise in ACTH and cortisol levels may dull/dampen the stress response to the TSST as part of a ceiling effect in relation to the law of initial value (Block & Bridger, Citation1962). Both the RR and AR appear able to mount an HPA response, unlike the NR, and combined they account for 83% of our sample, in keeping with TSST responder estimates in adult populations.
When we examined gender using the stress response patterns, we found males were significantly more likely to be RR than NR and more likely to be RR than AR, compared with females not taking OC, after adjustment. This is consistent with males showing a greater HPA response to stress and the suggestion that females may show greater changes in other physiological responses to stress such as corticolimbic reactivity and heart rate (Ordaz & Luna, Citation2012)
Analyzing the stress response patterns (RR, AR, NR) in logistic regression analyses, we did not find clear relationships between females on and off OC or across the menstrual cycle. However, smokers were more likely to be NR than (RR or AR) and more likely to be AR than RR, after adjustment. This is consistent with the blunted HPA response to acute stress found with chronic nicotine exposure, that is, similar to the NR pattern (Childs & De Wit, Citation2009).
With regard to BMI, we found what appears to be a dose-dependent effect with the shape of the TSST response curve. Overweight and obese participants showed increased odds of being RR versus being NR. The relationship with underweight participants was hampered by low numbers but odds ratios tend to support the opposite association; increased odds of being NR versus RR. This is interesting as the majority of analyses do not show a dose-dependent response with BMI, and HPA axis differences are limited to obese versus normal subjects. The increased rate of removal of cortisol from the circulation results in higher basal HPA activity and this may explain the increased RR rates with increasing BMI. In support of this, obese men who reduced their weight have been shown to produce more attenuated responses to the TSST (Therrien et al., Citation2010).
The stress response patterns described in this study can be characterized using traditional and novel mathematical parameters and are best used in conjunction with these measures as they describe different elements of the HPA axis response to a psychological challenge. The RR and AR patterns reveal a higher global exposure to glucocorticoids. The AR pattern may convey an increased sensitivity to stress and potentially has a greater exposure to glucocorticoids if the AUC was measured from when the HPA response actually began. Unlike Engert et al. (Citation2013), we did not see higher cortisol peaks in the AR group. Nonetheless, the AR pattern is likely to be a form of RR with the HPA response commencing prior to the TSST in anticipation of the challenge. There is evidence to support this hypothesis, with individuals demonstrating increased anticipatory stress effects when they undertake subsequent TSSTs, demonstrating higher plasma cortisol, ACTH, and heart rate in the succeeding tests (Schommer et al., Citation2003). While ARs show an early rise in glucocorticoids, they may also have a reduced recovery time (Juster et al., Citation2012). Compared with RR, AR were more likely to be female and to be a smoker. There is evidence of a relationship between AR and PTSD (Bremner et al., Citation2003) and between NRs and panic disorder (Petrowski et al., Citation2010), premenstrual syndrome (Huang et al., Citation2015), attempted suicide (Melhem et al., Citation2015), adverse early life events (Elzinga et al., Citation2008), and other negative health outcomes (Fries et al., Citation2005; Phillips et al., Citation2013). Future studies using the response patterns alongside traditional TSST measures should investigate whether ARs or NRs differ with regard to life stressors, psychological traits such as self-esteem, anxiety and rumination and markers of mental, metabolic and cardiovascular health.
This study involved the creation of a novel AUC calculation. We found that approximately 70% of our participants displayed their lowest stress hormone level (CMIN) at the final point of measurement, 90-min post-TSST, and this led us to develop a novel AUC calculation taking CMIN into account. AUCR (with respect to range) detected significant differences across gender groups and smokers versus nonsmokers when compared with AUCI, which showed no significant changes. This suggests that AUCR may be a more sensitive measure as it assumes that basal hormone levels approximate CMIN and not CBASELINE. This may be useful to researchers when participants commence the TSST with higher hormone levels than subsequent time points, as illustrated in AR. Another benefit of AUCR involves the generation of positive values for ease of interpretation, while AUCI calculations can result in negative areas (Grice & Jackson, Citation2004).
When the three response patterns were characterized by traditional descriptors of TSST data, the only measure found not to differ between the three groups was CMIN. This also suggests that CMIN may be more indicative of basal cortisol levels than CBASELINE. This finding requires replication in future studies but does imply that the three patterns have similar basal resting hormone levels; they may differ only in their response to an impending challenge. Further, it reiterates that the initial hormone measures in the TSST are often not representative of basal HPA levels as they are affected by the participants’ anticipation of the impending challenge (Kudielka et al., Citation2007). This emphasizes the potential value of the novel AUCR calculation mentioned above.
A strength of this study lies in its evaluation of the TSST assessment in a large number of young adult participants from a well-characterized community population. Further, we have measured the HPA axis at three levels and described a novel “pattern” approach to analyzing TSST results. When interpreting the results of this study, two issues deserve consideration; the absence of a sample taken on immediate arrival, and the requirement for cannulation of participants. The analysis of samples taken prior to the TSST, during the initial rest phase, would have allowed a more comprehensive assessment of arrival/anticipatory dynamics. The change in cortisol in the first hour after arrival has been correlated with the subsequent response to challenge (Balodis et al., Citation2010). Nonetheless, the TSST protocols we used between 2008 and 2010 are consistent with those used by others and recommended in the literature (Kirschbaum et al., Citation1999, Kudielka et al., Citation2007). Recently a modified TSST protocol to specifically measure the anticipatory response has been developed (Engert et al., Citation2013) and will be valuable for future studies. The second issue involves measurement of cortisol and ACTH from blood using cannulation which is a more invasive procedure than collecting saliva-only, before and after the TSST. Cannulation carries the potential for a cortisol response independent of the TSST. Our participants had at least 45 min rest after cannulation prior to a challenge, consistent with recommendations and other studies (Epel et al., Citation2000; Kirschbaum et al., Citation1999; Kudielka et al., Citation2007). While it is tempting to speculate that there may be more anticipatory responders with cannulation, this does not explain the relative absence of this pattern in the TSST literature. The period of adolescence is associated with many changes in the HPA axis and it is possible that the reaction to cannulation may be heightened in this age group. It is worth noting that we did not assess cognitive/emotional state at the time of the TSST and it is possible that this may contribute to some of the differences observed. Finally, it is possible that the pulsatile nature of cortisol secretion may impact the response to a stressor (Young et al., Citation2004). Extensive work in rats suggests that the rising/secretory phase of the pulse yields a corticosterone response to a stressor while the HPA axis appears relatively inhibited during the falling phase (Windle et al., Citation1998). These results differ between rat strains and it is difficult to extrapolate these data to humans. Others have found similar, although habituating, cortisol responses to the TSST on retesting, which suggests that the pulsatile nature of cortisol release does not significantly interfere with individual response to the TSST (Petrowski et al., Citation2012).
Conclusions
We have used a community-based sample population of 798 teenagers to describe in detail the acute response of the HPA axis to a psychological challenge. In addition to examining traditional measures of the TSST data, we have used novel mathematical data to describe the TSST response and have characterized the three patterns of stress hormone response; RR, AR, and NR. Results demonstrate that the stress response patterns vary with risk factors contributing to TSST variation. The influence of gender, smoking, and BMI on stress response patterns suggests there is the potential for the patterns to vary with health and disease. Therefore, the use of these patterns alongside traditional measures, may give greater insight into the stress response in future studies.
Supplementary materials available online
ISTS_1146672_Supp.zip
Download Zip (103 KB)Acknowledgements
We would especially like to thank Anke van Eekelen and Karen Bosel for their management of the TSST review, Blagica Penova-Veselinovic for her technical expertise, Carol Wang for her statistical skills, and also colleagues from the University of Trier, for their detailed protocols and help in initially establishing the TSST. In addition, we thank the Raine Study participants who took part in this study, the Raine Study Team for cohort co-ordination and data collection.
Declaration of interest
The authors declare that there are no conflicts of interest that could be perceived as prejudicing the impartiality of the research reported. The authors alone are responsible for the content and writing of the article.
The year 18 TSST review and this study were supported by the Canadian Institutes of Health Research (Lye et al., MOP 82893). C.H. was supported by scholarships from the Australian Government, Raine Study, and Women and Infants’ Research Foundation. Authors thank the National Health and Medical Research Council (NHMRC) and the Telethon Kids Institute for their longstanding funding and support of the study. Core funding for the Western Australian Pregnancy Cohort (Raine) Study is provided by the Raine Medical Research Foundation, The University of Western Australia, The Telethon Kids Institute, UWA Faculty of Medicine, Dentistry and Health Sciences, The Women and Infants’ Research Foundation, and Curtin University
Related Research Data
References
- Arlt W, Stewart PM. (2005). Adrenal corticosteroid biosynthesis, metabolism, and action. Endocrinol Metab Clin North Am 34(2):293–313
- Back SE, Waldrop AE, Saladin ME, Yeatts SD, Simpson A, Mcrae AL, Upadhyaya HP, et al. (2008). Effects of gender and cigarette smoking on reactivity to psychological and pharmacological stress provocation. Psychoneuroendocrinology 33(5):560–8
- Balodis IM, Wynne-Edwards KE, Olmstead MC. (2010). The other side of the curve: examining the relationship between pre-stressor physiological responses and stress reactivity. Psychoneuroendocrinology 35(9):1363–73
- Benson S, Arck PC, Tan S, Mann K, Hahn S, Janssen OE, Schedlowski M, Elsenbruch S. (2009). Effects of obesity on neuroendocrine, cardiovascular, and immune cell responses to acute psychosocial stress in premenopausal women. Psychoneuroendocrinology 34(2):181–9
- Bjorntorp P, Rosmond R. (2000). Obesity and cortisol. Nutrition 16(10):924–36
- Block JD, Bridger WH. (1962). The law of initial value in psychophysiology: a reformulation in terms of experimental and theoretical considerations. Ann NY Acad Sci 98(4):1229–41
- Bremner JD, Vythilingam M, Vermetten E, Adil J, Khan S, Nazeer A, Afzal N, et al. (2003). Cortisol response to a cognitive stress challenge in posttraumatic stress disorder (PTSD) related to childhood abuse. Psychoneuroendocrinology 28(6):733–50
- Childs E, De Wit H. (2009). Hormonal, cardiovascular, and subjective responses to acute stress in smokers. Psychopharmacology (Berl) 203(1):1–12
- Childs E, Dlugos A, De Wit H. (2010). Cardiovascular, hormonal, and emotional responses to the TSST in relation to sex and menstrual cycle phase. Psychophysiology 47(3):550–9
- Chrousos GP, Kino T. (2007). Glucocorticoid action networks and complex psychiatric and/or somatic disorders. Stress 10(2):213–19
- Cizza G, Ronsaville DS, Kleitz H, Eskandari F, Mistry S, Torvik S, Sonbolian N, et al. (2012). Clinical subtypes of depression are associated with specific metabolic parameters and circadian endocrine profiles in women: the power study. PLoS One 7(1):e28912
- Cole TJ, Bellizzi MC, Flegal KM, Dietz WH. (2000). Establishing a standard definition for child overweight and obesity worldwide: international survey. BMJ 320(7244):1240–3
- Cole TJ, Lobstein T. (2012). Extended international (IOTF) body mass index cut-offs for thinness, overweight and obesity. Pediatr Obes 7(4):284–94
- Coolens JL, Heyns W. (1989). Marked elevation and cyclic variation of corticosteroid-binding globulin: an inherited abnormality? J Clin Endocrinol Metab 68(2):492–4
- Duchesne A, Pruessner JC. (2013). Association between subjective and cortisol stress response depends on the menstrual cycle phase. Psychoneuroendocrinology 38(12):3155–9
- Elzinga BM, Roelofs K, Tollenaar MS, Bakvis P, Van Pelt J, Spinhoven P. (2008). Diminished cortisol responses to psychosocial stress associated with lifetime adverse events a study among healthy young subjects. Psychoneuroendocrinology 33(2):227–37
- Engert V, Efanov SI, Duchesne A, Vogel S, Corbo V, Pruessner JC. (2013). Differentiating anticipatory from reactive cortisol responses to psychosocial stress. Psychoneuroendocrinology 38(8):1328–37
- Epel ES, Mcewen B, Seeman T, Matthews K, Castellazzo G, Brownell KD, Bell J, Ickovics JR. (2000). Stress and body shape: stress-induced cortisol secretion is consistently greater among women with central fat. Psychosom Med 62(5):623–32
- Evans BE, Greaves-Lord K, Euser AS, Tulen JH, Franken IH, Huizink AC. (2013). Determinants of physiological and perceived physiological stress reactivity in children and adolescents. PLoS One 8(4):e61724
- Felmingham KL, Fong WC, Bryant RA. (2012). The impact of progesterone on memory consolidation of threatening images in women. Psychoneuroendocrinology 37(11):1896–900
- Foley P, Kirschbaum C. (2010). Human hypothalamus-pituitary-adrenal axis responses to acute psychosocial stress in laboratory settings. Neurosci Biobehav Rev 35(1):91–6
- Fries E, Hesse J, Hellhammer J, Hellhammer DH. (2005). A new view on hypocortisolism. Psychoneuroendocrinology 30(10):1010–16
- Gordon JL, Girdler SS. (2014). Mechanisms underlying hemodynamic and neuroendocrine stress reactivity at different phases of the menstrual cycle. Psychophysiology 51(4):309–18
- Grice JE, Jackson RV. (2004). Letter to the Editor: two formulas for computation of the area under the curve represent measures of total hormone concentration versus time-dependent change. A Letter to the Editor in response to J.C. Preussner, et al. (2003) Psychoneuroendocrinology 28, 916-931. Psychoneuroendocrinology 29(4):563–4; author reply 564–566
- Heaney JL, Phillips AC, Carroll D. (2012). Aging, health behaviors, and the diurnal rhythm and awakening response of salivary cortisol. Experimental Aging Res 38(3):295–314
- Huang Y, Zhou R, Wu M, Wang Q, Zhao Y. (2015). Premenstrual syndrome is associated with blunted cortisol reactivity to the TSST. Stress 18(2):160–8
- Jones A, Mcmillan MR, Jones RW, Kowalik GT, Steeden JA, Deanfield JE, Pruessner JC, et al. (2012). Adiposity is associated with blunted cardiovascular, neuroendocrine and cognitive responses to acute mental stress. PLoS One 7(6):e39143
- Juster RP, Perna A, Marin MF, Sindi S, Lupien SJ. (2012). Timing is everything: anticipatory stress dynamics among cortisol and blood pressure reactivity and recovery in healthy adults. Stress 15(6):569–77
- Kirschbaum C, Hellhammer DH. Salivary cortisol. In: Fink G, editor. Encyclopedia of stress. Vol. 3. San Diego, CA: Academic Press; 2000. p 379–84
- Kirschbaum C, Kudielka BM, Gaab J, Schommer NC, Hellhammer DH. (1999). Impact of gender, menstrual cycle phase, and oral contraceptives on the activity of the hypothalamus-pituitary-adrenal axis. Psychosom Med 61(2):154–62
- Kirschbaum C, Pirke KM, Hellhammer DH. (1993a). The ‘Trier Social Stress Test’ – a tool for investigating psychobiological stress responses in a laboratory setting. Neuropsychobiology 28(1–2):76–81
- Kirschbaum C, Strasburger CJ, Langkrar J. (1993b). Attenuated cortisol response to psychological stress but not to CRH or ergometry in young habitual smokers. Pharmacol Biochem Behav 44(3):527–31
- Kudielka BM, Kirschbaum C. (2005). Sex differences in HPA axis responses to stress: a review. Biol Psychol 69(1):113–32
- Kudielka BM, Wust S. (2010). Human models in acute and chronic stress: assessing determinants of individual hypothalamus-pituitary-adrenal axis activity and reactivity. Stress 13(1):1–14
- Kudielka BM, Wüst S, Kirschbaum C, Hellhammer DH. Trier Social Stress Test. In: Fink G, editor. Encyclopedia of stress. 2nd ed. New York: Academic Press; 2007. p 776–81
- Kumsta R, Entringer S, Hellhammer DH, Wust S. (2007). Cortisol and ACTH responses to psychosocial stress are modulated by corticosteroid binding globulin levels. Psychoneuroendocrinology 32(8–10):1153–7
- Lottenberg SA, Giannella-Neto D, Derendorf H, Rocha M, Bosco A, Carvalho SV, Moretti AE, et al. (1998). Effect of fat distribution on the pharmacokinetics of cortisol in obesity. Int J Clin Pharmacol Ther 36(9):501–5
- Maki PM, Mordecai KL, Rubin LH, Sundermann E, Savarese A, Eatough E, Drogos L. (2015). Menstrual cycle effects on cortisol responsivity and emotional retrieval following a psychosocial stressor. Horm Behav 74:201–8
- Mccormick CM, Mathews IZ. (2010). Adolescent development, hypothalamic-pituitary-adrenal function, and programming of adult learning and memory. Prog Neuro-Psychopharmacol Biol Psychiatry 34(5):756–65
- Melhem NM, Keilp JG, Porta G, Oquendo MA, Burke A, Stanley B, Cooper TB, et al. (2015). Blunted HPA axis activity in suicide attempters compared to those at high risk for suicidal Behavior. Neuropsychopharmacology. [Epub ahead of print]. DOI: 10.1038/npp.2015.309
- Miller R, Plessow F, Kirschbaum C, Stalder T. (2013). Classification criteria for distinguishing cortisol responders from nonresponders to psychosocial stress: evaluation of salivary cortisol pulse detection in panel designs. Psychosom Med 75(9):832–40
- Newnham JP, Evans SF, Michael CA, Stanley FJ, Landau LI. (1993). Effects of frequent ultrasound during pregnancy: a randomised controlled trial. Lancet 342(8876):887–91
- Ordaz S, Luna B. (2012). Sex differences in physiological reactivity to acute psychosocial stress in adolescence. Psychoneuroendocrinology 37(8):1135–57
- Petrowski K, Herold U, Joraschky P, Wittchen HU, Kirschbaum C. (2010). A striking pattern of cortisol non-responsiveness to psychosocial stress in patients with panic disorder with concurrent normal cortisol awakening responses. Psychoneuroendocrinology 35(3):414–21
- Petrowski K, Wintermann GB, Siepmann M. (2012). Cortisol response to repeated psychosocial stress. Appl Psychophysiol Biofeedback 37(2):103–7
- Phillips AC, Ginty AT, Hughes BM. (2013). The other side of the coin: blunted cardiovascular and cortisol reactivity are associated with negative health outcomes. Int J Psychophysiol 90(1):1–7
- Pruessner JC, Kirschbaum C, Meinlschmid G, Hellhammer DH. (2003). Two formulas for computation of the area under the curve represent measures of total hormone concentration versus time-dependent change. Psychoneuroendocrinology 28(7):916–31
- Rohleder N, Kirschbaum C. (2006). The hypothalamic-pituitary-adrenal (HPA) axis in habitual smokers. Int J Psychophysiol 59(3):236–43
- Rohleder N, Schommer NC, Hellhammer DH, Engel R, Kirschbaum C. (2001). Sex differences in glucocorticoid sensitivity of proinflammatory cytokine production after psychosocial stress. Psychosom Med 63(6):966–72
- Schommer NC, Hellhammer DH, Kirschbaum C. (2003). Dissociation between reactivity of the hypothalamus-pituitary-adrenal axis and the sympathetic-adrenal-medullary system to repeated psychosocial stress. Psychosom Med 65(3):450–60
- Selmaoui B, Touitou Y. (2003). Reproducibility of the circadian rhythms of serum cortisol and melatonin in healthy subjects: a study of three different 24-h cycles over six weeks. Life Sci 73(26):3339–49
- Stone AA, Schwartz JE, Smyth J, Kirschbaum C, Cohen S, Hellhammer D, Grossman S. (2001). Individual differences in the diurnal cycle of salivary free cortisol: a replication of flattened cycles for some individuals. Psychoneuroendocrinology 26(3):295–306
- Therrien F, Drapeau V, Lalonde J, Lupien SJ, Beaulieu S, Dore J, Tremblay A, Richard D. (2010). Cortisol response to the Trier Social Stress Test in obese and reduced obese individuals. Biol Psychol 84(2):325–9
- van Cauter E, Refetoff S. (1985). Evidence for two subtypes of Cushing’s disease based on the analysis of episodic cortisol secretion. N Engl J Med 312(21):1343–9
- Windle RJ, Wood SA, Shanks N, Lightman SL, Ingram CD. (1998). Ultradian rhythm of basal corticosterone release in the female rat: dynamic interaction with the response to acute stress. Endocrinology 139(2):443–50
- Young EA, Abelson J, Lightman SL. (2004). Cortisol pulsatility and its role in stress regulation and health. Front Neuroendocrinol 25(2):69–76