
Abstract
Context: Ultrapure oligochitosans (UOCs) have recently been reported as efficient nonviral vectors for corneal and retinal gene delivery. However, the influence of some physicochemical factors on the transfection efficiency, such as the pH, remains unclear. Deeper in vitro research of these factors could provide valuable information for future clinical applications.
Objective: The aim of this study is to determine the influence of the pH decrease on the transfection efficiency of UOC/pDNA polyplexes in HEK293 and ARPE19 cells.
Materials and methods: We elaborated self-assembled UOC/pCMS-EGFP polyplexes. The influence of the most important factors on the particle size and the zeta potential was studied by an orthogonal experimental design. We evaluated, in vitro, the cellular uptake and the transfection efficiency by flow cytometry, and the cytotoxicity of the vectors by CCK-8 assay.
Results and discussion: The pH of the medium strongly influences the physicochemical properties of the polyplexes, and by its modulation we are able to control their superficial charge. A significant increase on the cellular uptake and transfection efficiency of UOCs was obtained when the pH was acidified. Neither of our UOC/pCMS-EGFP polyplexes caused cytotoxicity; however, cells treated with Lipofectamine 2000™ showed decreased cell viability.
Conclusion: This kind of UOC vectors could be useful to transfect cells that are in an acidic environment, such as tumor cells. However, additional in vivo studies may be required in order to obtain an effective and safe medicine for nonviral gene therapy purpose.
Introduction
One of the essential prerequisites for gene therapy success relies on the development of safe and effective vectors. Nowadays, vectors can be classified into two main groups: viral and nonviral. Viral gene delivery systems are the most effective ones to transfect cells due to their natural properties to infect cells and deliver genetic material with high transfection efficiency. However, the use of viral vectors has many safety concerns, such as immunogenicity, mutagenicity, oncogenic effects and toxicity (Glover et al., Citation2005; Wang et al., Citation2011). Therefore, nonviral vectors, such as chitosan, have been raising demanding attention as a safer alternative for human gene therapy.
Since Mumper et al. reported in 1995 the use of chitosan as a gene delivery system (Mumper et al., Citation1995), numerous authors have studied this polymer as a nonviral vector for nucleic acid (NA) delivery (Mao et al., Citation2010). Compared to other cationic polymers, chitosan has favorable characteristics, such as biocompatibility, biodegradability, low immunogenicity and reduced cytotoxicity (Borchard, Citation2001). Moreover, thanks to the amine groups, chitosans are positively charged, which allows the formation of nanoscale complexes by electrostatic interaction with anionic NAs, named polyplexes (Layman et al., Citation2009; Mao et al., Citation2010).
According to the physicochemical characteristics of the chitosan, in vitro transfection efficiency of chitosan/pDNA polyplexes highly depends on the molecular weight (MW) and the degree of deacetylation (DDA) of the polymer. Polyplexes elaborated with high-MW chitosans are very stable and excellent extracellular DNA protectors, but they show, at the same time, low buffer capacity and transfection efficiency (Lu et al., Citation2009). According to the DDA, high-DDA chitosan vectors have shown better DNA-binding capacity and more efficient transfection than complexes formed with low-DDA chitosan (Kim et al., Citation2007). For this reason, we have used Novafect O15 and O25 ultrapure oligochitosans (UOCs), which have been previously reported as efficient nonviral vectors for gene delivery in vitro and in vivo (Klausner et al., Citation2010; Puras et al., Citation2013a,b).
In addition to DDA and MW, the in vitro transfection efficiency of chitosan/pDNA polyplexes is highly sensitive to the pH of the culture medium. According to Zhao et al. (Citation2006), the optimum pH for the transfection of chondrocytes, using chitosan/pDNA polyplexes, oscillates between 6.8 and 7.0. While pH values lower than 6.5 increase the cytotoxicity, pH values higher than 7.2 provoke the dissociation of free plasmid from the polyplex, reducing the transfection efficiency (Ishii et al., Citation2001). Recently, extensive work has been carried out to explore the influence of medium acidification on the in vitro transfection capacity of chitosan-based vectors (Lavertu et al., Citation2006; Nimesh et al., Citation2010). However, no research has been conducted with polyplexes elaborated by oligomeric chitosan molecules (<10 kDa).
Therefore, the main objective of this work was to evaluate the influence of the pH decrease, to nontoxic limit value (6.5), on the in vitro cellular uptake and transfection efficiency of UOC/pDNA polyplexes in HEK293 and ARPE19 cells. For this purpose, several in vitro assays were performed with self-assembled UOC/pCMS-EGFP polyplexes. First, an orthogonal (23) experimental design was performed to characterize the transfection system in terms of size and zeta potential. Second, a study related to the buffer capacity of the polymers was conducted. Third, the optimal formulation for next experiments was determined by measuring the transfection efficiency and cell viability of the vectors at different N/P ratios (the molar ratios between all protonable amino groups of chitosan and the phosphate groups of pDNA); finally, the influence of the pH decrease on both cellular uptake and transfection efficiency was evaluated at the optimum N/P ratio.
Materials and Methods
Materials
UOC O15 and O25 (MWs of 5.7 and 7.3 kDa, respectively, DDA ≥97% and endotoxin levels ≤0.05 EU/mg) and polymeric water-soluble high-MW glutamate salt chitosan G214 (MW of 340 KDa and DDA ≥90%) were purchased from NovaMatrix/FMC (Sandvika, Norway). HEK293 cells, ARPE19 cells and Eagles’s Minimal Essential medium with Earle’s BSS and 2 mM 1-glutamine (EMEM) were bought from the American Type Culture Collection (ATCC, Teddington, UK). Dulbecco’s Modified Eagle’s Medium Han’s Nutrient Mixture F-12 (1:1) medium was purchased from GIBCO (San Diego, CA). Opti-MEM® I reduced medium, antibiotic/antimicotic solution and Lipofectamine™ 2000 were purchased from Invitrogen (Life Technologies, Paisley, UK). The plasmid pCMS-EGFP, which encodes the EGFP, was purchased from BD Biosciences Clontech (Palo Alto, CA) and amplified by Dro Biosystems S.L. (San Sebastian, Spain). For cellular uptake experiments, pCMS-EGFP plasmid was labeled with fluorescein isothiocyanate (FITC) by Darebio S.L (Alicante, Spain). Phosphate buffer saline (PBS), MES and Cell Counting Kit-8 (CCK-8) were purchased from Sigma-Aldrich (Madrid, Spain). Dapi Fluoromont-G was obtained from SouthernBiotech, and Alexa Fluor 488 Phalloidin was bought from Life Technologies (Paisley, UK).
Preparation of UOC/pCMS-EGFP polyplexes
UOC/pCMS-EGFP polyplexes were prepared by the self-assembly method with a final DNA concentration of 13.2 μg/ml. Previous to the polyplex formation, pCMS-EGFP and UOC stock solutions were diluted with ultrapure water to obtain final concentrations of 0.5 and 2 mg/ml, respectively. Fixed volumes of UOC solution were added to the DNA solution under vortex mixing (1200 rpm) for 15 s and were allowed to stabilize at room temperature for 30 min (Puras et al., Citation2013a,b). This incubation period was chosen in order to avoid the aggregation of the polyplexes, since it is reported that the physical stability of this kind of nonviral vectors is time dependent (Anchordoquy & Koe, Citation2000).
Fractional factorial experiment
In order to evaluate the influence of the pH of the solution (pH = X1), salt concentration of the solution ([NaCl] = X2) and N/P ratio (N/P ratio = X3) on the size and zeta potential of the system (UOC/pCMS-EGFP polyplexes), a two-level (low level and high level) three-variable fractional factorial experiment was designed, also known as orthogonal experimental design. To analyze the factorial design, the original measurement units for the experimental variables (uncoded units) were transformed into code units, −1 (low level) and +1 (high level) ().
Table 1. Experimental trials and interactions transformed into code units.
The number of experimental runs that had to be carried out for an orthogonal experimental design is 8 (23). The responses, particle size and zeta potential, for each experimental combination, were expressed as nm and mV, respectively (). The effects of the variables upon the responses could depend on the other studied variables. This phenomenon is called interaction, which is included in the table of experimental trials as an additional column (). In the orthogonal experimental design, we can find these three interactions: X1X2, X1X3, X2X3. The effect of each variable and each interaction () was calculated by the following equation:
Table 2. Experimental trials and response in terms of size and zeta potential for O15 and O25 UOC.
Table 3. Effects and interactions on size and zeta potential of the UOC/pCMS-EGFP polyplexes.
Measurements of size and zeta potential
The measurements of size and zeta potential were carried out as previously described by Puras et al. (Citation2013a,b) using a Zetasizer NanoZS (Malvern Instruments, UK). All measurements were carried out in triplicate. The particle size reported as hydrodynamic diameter was obtained by cumulative analysis. Only data that met the quality criteria according to the software program DTS 5.0 (Zetasizer Nano system, Malvern Instruments, UK) were included in the study.
Buffer capacity assay
The buffer capacity of our cationic polymers was determined by the acid–base titration assay. The samples were prepared as follows: 0.1 mg/ml of each chitosan solution was prepared in 10 ml of 150 mM NaCl, and each sample solution was titrated by 0.1 M NaOH to a pH 10. Then, samples were titrated again with 0.1 M HCl solution, in order to obtain mixtures with different pH values. A Crison pH-Meter GLP 21 was used for the measurements.
In vitro transfection assays
For transfection studies, HEK293 and ARPE19 cells were seeded without antibiotic/antimicotic on 24-well plates at a density of 150,000 and 100,000 cells per well, respectively, and allowed them to adhere to reach 70–90% of confluence at the time of transfection.
In order to determine the optimal formulation for the following in vitro assays, we studied the transfection efficiency of the polyplexes at N/P ratios ranging from 10 to 60 in HEK293 cells. For this purpose, formulations were prepared after mixing 1:1 polyplexes (containing 1.65 μg of the pCMS-EGFP) and hypertonic transfection medium (Opti-MEM® I, containing 580 mM of mannitol) at pH 7.4. After 4 h of incubation with the vectors at 37 °C, the transfection medium was removed and replaced with complete medium. Cells were allowed to grow 72 h before processing them for fluorescent microscopy and flow cytometry analysis. Experiments with Lipofectamine™ 2000/pCMS-EGFP complexes were prepared at a 2/1 ratio (w/w) according to the manufacturer’s protocol and were used as our positive controls.
Next transfection assays were designed to evaluate the pH influence on the transfection efficiency of the selected formulations in HEK293 and ARPE19. In this case, the transfection assay was carried out following the procedure described in the preceding paragraph, but including also transfection at pH 6.5.
Analysis of EGFP expression
Qualitative expression of EGFP was analyzed using an inverted microscope equipped with an attachment for fluorescent observation (model EclipseTE2000-S, Nikon). Flow cytometry analysis was conducted using a FACSCalibur system flow cytometer (Becton Dickinson Biosciences, San Jose, CA). By the end of the incubation period, cells were detached with 300 μl of 0.05% trypsin/EDTA. After detachment, complete medium was added to inhibit trypsin activity. Then, cells were centrifuged at 1500 ×g, and the supernatant was discarded. Cells were resuspended in cold PBS, diluted in FACSFlow liquid and transferred to specific flow cytometer tubes to quantify EGFP expression in live cells. For each sample 10,000 events were collected. Transfection efficiency was quantified by measuring the fluorescence of EGFP at 525 nm (FL1). Control samples (nontransfected cells) were displayed on a dot plot of forward scatter against side scatter to establish a collection gate and exclude cells debris and dead cells. The samples containing Lipofectamine-transfected cells were used as a control to compensate FL2 signal in FL1 channel. Transfection data were normalized using Lipofectamine™ 2000 (mean ± SD; n = 3).
Cell uptake studies
For cell uptake studies, HEK293 and ARPE19 cells were manipulated as described in the section “In vitro transfection assays” for transfection experiments. Then, the regular growth media was removed from the well and the cells were exposed to polyplexes, containing 1.65 μg of the pCMS-EGFP labeled with fluorescein isothiocyanate (FITC-pCMS-EGFP), at both pH. After 4 h of incubation with the vectors at 37 °C, the transfection medium was removed and cells were washed with PBS and fixed with formaldehyde 4% for the quantitative and qualitative analysis, by flow cytometry (FACSCalibur, Becton Dickinson Biosciences, San Jose, CA) and fluorescence microscopy (Eclipse TE200-S, Nikon Instruments Europe B.V., Amstelveen, The Netherlands), respectively. Each formulation was analyzed by triplicate.
To obtain cellular uptake quantitative data, cells were analyzed after 4 h of incubation by flow cytometry at 525 nm (FL1) after detachment from the wells. Ten thousand events were collected for each sample. Cellular uptake data were expressed as the percentage of FITC-positive cells.
For the qualitative study, cells were seeded in coverslips containing plates and treated with the vectors. After 4 h of incubation, preparations were mounted on Dapi Fluoromount-G for their posterior analysis. Images were examined under the microscope.
Cell viability and cytotoxicity
Potential cytotoxicity of selected UOC/pDNA polyplexes was determined quantitatively by BD Via-Probe kit and CCK-8 assays and qualitatively by analyzing cell morphology under microscope observation after phalloiding staining.
In order to determine the optimal formulation for the following in vitro assays, BD Via-Probe kit assay was performed. The measurements were performed at 72 h on the same selected samples as those used in the transfection efficiency studies (see section “In vitro transfection assays”). The BD Via-Probe kit reagent (5 μl) was added to each sample, and after 10 min of incubation, fluorescence of dead cells was measured at 650 nm (FL3) on a FACSCalibur system flow cytometer. Control samples (cells incubated at pH 7.4 without polyplexes) were used as controls to compensate FL2 signal in FL3 channel.
Once the optimal formulation was determined, the cytotoxicity of the selected polyplexes was evaluated by the commercially available CCK-8, which measures cellular dehydrogenase activity. Briefly, HEK293 and ARPE19 cells were seeded onto 96-well plates at a density of 25,000 and 10,000 cells per well, respectively, and allowed to adhere to reach 70–90% of confluence. Then, 50 μl of different formulations were added to the cells. After 4 h of incubation at 37 °C, the medium containing the formulations was replaced with 100 μl of complete medium and cells were further incubated for 72 h under the same conditions. Then, 10 μl of the CCK-8 solution reagent was added to each well and the plate was incubated at 37 °C for 3 h. The absorbance was measured at 450 nm using a microplate reader (Multiscan EX, Labsystems, Helsinki, Finland). Results were expressed as relative cell viability (%) compared to control cells (untreated cells): [Fluorescence]sample/[Fluorescence]control × 100.
For cell morphology analysis, HEK293 and ARPE19 cells were stained with Alexa Fluor 488 phalloidin following the manufacturer's protocol. Briefly, after 4 h of incubation with polyplexes, cells were washed with PBS and fixed with 4% formaldehyde. Then, Alexa fluor 488 phalloidin stock solution was added and cells were incubated for 40 min at room temperature. Afterward, they were washed again and the preparations were mounted on Dapi Fluoromount-G for their posterior analysis under the microscope.
Results and discussion
Effects and interactions of medium pH, salt concentration and chitosan/DNA N/P ratio
The most important physicochemical properties that affect the in vitro transfection efficiency of chitosan/pDNA polyplexes are the size and the zeta potential. However, the exact influence of factors like medium pH and salt concentration and N/P ratio on these properties remains unclear (Gao et al., Citation2009). For this reason, an orthogonal experimental design was chosen to address the effect of these three factors. The design matrix of uncoded values for the factors and the responses, in terms of size and zeta potential, are shown in . Moreover, the effects and the interactions of the factors are shown in .
As observed in , the interaction values for the particle size are high, explaining that the effect of each factor on the particle size depends on the rest of the analyzed factors. The clearest data showing dependence between two factors could be observed in the X1X2 interaction for the particle size of O15 polyplexes, whose value was −128.12. This means that depending on whether the pH of the medium is acidic or basic, the effect of N/P ratio on the particle size of O15 polyplexes is just the opposite. For example, when the osmolarity value is low, the increment of the N/P ratio from 10 to 60 at pH value of 6.2 increases the size, while at pH 7.2 it decreases. As observed in , the independent effects of each factor in the particle size indicate that the increase of the pH from 6.5 to 7.4 increases the size of the polyplexes (+180.37 nm for O15 and +28.73 nm for O25); the increase of the N/P ratio from 10 to 60 reduces the size (−139.98 nm for O15 and −85.31 nm for O25) and the increase of salt concentration from 10 to 150 mM hardly affects the particle size (−21.93 nm for O15 and +13.31 nm for O25). However, there are certain results in conflict with the above-mentioned independent effects. For example, there is an increase in the particle size when the N/P ratio is raised from 10 to 60, as it is the case of trials 1 and 3 for O15, and trials 5 and 7 for O25 (). Therefore, due to the strong interactions that exist between the three factors, it is essential to do an overall analysis of the variables in order to describe the exact behavior of the system.
Some authors suggest that the transfection efficiency of chitosan/pDNA nanoparticles does not depend on the size in the range of 250–1300 nm (Duceppe & Trabrizian, Citation2010). On the contrary, Lavertu et al. (Citation2006) showed that polyplexes around 700 nm in diameter were able to produce higher EGFP expression in HEK293 cells comparing with smaller ones (280 nm). In addition, other authors have demonstrated that the final size of the polyplex can affect transfection, as the endocytic pathways differ with regard to the size of the endocytic vesicle (Conner & Schmid, Citation2003). Due to these conflicting results, most of the research groups support the theory that the final size of the polyplex is not as important as the zeta potential on the stability of suspensions, on the adhesion of particle systems onto biological surfaces and therefore on the transfection efficiency. Consequently, we suggest that the investigation of the zeta potential is the main issue in the design of efficient nonviral vectors for gene delivery purposes, being necessary a positive zeta potential for an efficient in vitro transfection (Lee et al., Citation2004; Duceppe & Trabrizian, Citation2010).
As observed in , UOC/pCMS-EGFP polyplexes have a positive surface charge. This is explained by the residual protonated amine groups of UOC that do not take part in the neutralization with the negatively charged phosphate groups of the pDNA. Furthermore, it should be stressed out the absence of interactions for the zeta potential, which explains that the effect of each factor on the zeta potential of the polyplexes is independent. Regarding the effect of the pH on the zeta potential, it is clearly observed from that an increase in the pH value from 6.2 to 7.2 results in a decrease of the zeta potential of 12.86 and 14.91 mV for both UOC O15 and O25, respectively.
Moreover, although it is a weaker effect, an increase in the suspension buffer salt concentration decreases the superficial charge of the polyplexes. Regarding the N/P ratio, it does not significantly affect the zeta potential. This could be due to the selected low N/P ratio (N/P 10), which might be too high to observe differences in zeta potential results. However, we should take into consideration that the behavior of the polyplexes elaborated with UOC could be different from what it has been observed with other higher MW chitosans. Accordingly, as it has been described for Novafect O15 and O25 chitosans, no significant differences have been observed in the zeta potential values when the N/P ratio raises from 10 to 60 (Klausner et al., Citation2012; Puras et al., Citation2013a,b).
This dependence of the zeta potential on the pH and the salt concentration is consistent with the results obtained in trials 6 and 8, where almost electrostatically neutral polyplexes were found at pH value of 7.2 and [NaCl] of 150 mM, while superficial charge became highly positive at pH 6.2 and [NaCl] 10 mM. Similarly, other authors have also concluded that the charge of chitosan/pDNA complexes strongly depends on the pH and salt content of the suspension medium (Lee et al., Citation2004; Nimesh et al., Citation2010).
Buffer capacity of UOCs
Endosomal release of the pDNA is one of the most important steps that must be overcome to avoid lysosomal degradation. It has been reported that the capacity to escape from the endosome depends on the intrinsic buffer capacity of the vector system (Tripathi et al., Citation2012). As reported by the literature, chitosans have a modest buffering capacity comparing with other cationic synthetic polymers, such as chitosan-based oligoamine polymers and polyethylenimine, which reduces its biomedical applications (Lu et al., Citation2009).
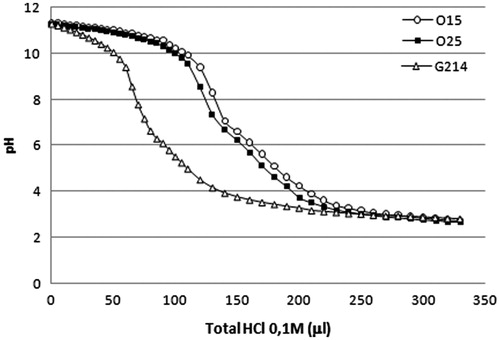
Despite the poor buffering capacity of chitosans, we hypothesized that this quality could be improved with the use of oligomeric chitosans (<10 kDa), such as O15 and O25. Accordingly, as observed in , our data indicate that UOCs have significantly higher buffer capacity compared to the high-MW chitosan (G214), which is more significant in the pH interval between 9 and 3. This is in agreement with a study that showed that the buffer capacity of chitosan copolymers decreased when the MW of chitosan was increased (Lu et al., Citation2009).
Figure 1 Acid–base titration profiles of O15 UOC, O25 UOC and G214 chitosan in 150 mM NaCl solution.
Selection of the optimal formulation by transfection and viability assays in HEK293 cells
In order to establish the best formulations for the following studies, HEK293 cells were transfected by both UOC polyplexes at N/P ratios from 10 to 60. As reported by other authors, the relative percentage of transfected cells strongly depends on the N/P ratio of chitosan polyplexes (de Martimprey et al., Citation2009; Strand et al., Citation2010). In our work, the maximum relative percentage of EGFP-positive cells was obtained at N/P ratios of 10, 20 and 30, while the lowest transfection level was at N/P of 60 ().
Figure 2 EGFP expression and cell viability in HEK293 cells after the transfection with O15 and O25 UOC/pCMS-EGFP polyplexes at N/P ratios from 10 to 60. Transfection data were normalized to Lipofectamine 2000™.
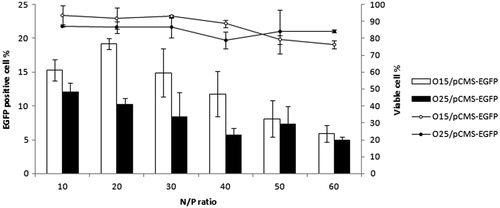
According to the results obtained by BD Via-Probe kit assay, the increment of N/P ratio seems to affect negatively the viability of the cells. Therefore, taking into account the transfection and viability results, formulations elaborated at N/P ratio of 20 were selected as the most suitable for next in vitro assays.
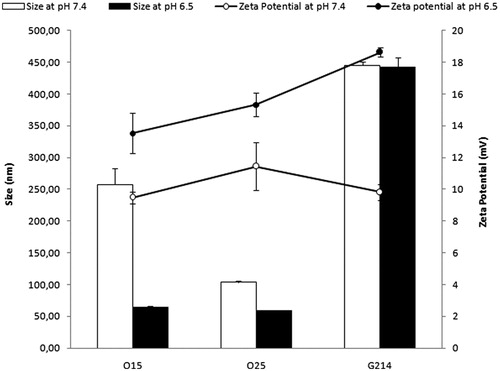
The hydrodynamic diameter and superficial charge of the polyplexes were determined in the selected formulations. As it is observed in , medium acidification from 7.4 to 6.5 reduces the particle size of all the polyplexes, especially the ones elaborated with O15 and O25 UOC. In relation to the superficial charge, polyplexes elaborated at pH 6.5 have a significantly higher zeta potential, compared to those formed at pH 7.4. Comparing the polyplexes elaborated with O15 and O25 UOC with those formed with G214 chitosan, it is clearly observed that when the MW of the chitosan is higher, the particle size and zeta potential of the formed vectors increase. These results are in accordance with those previously published (Huang et al., Citation2004).
Figure 3 Size and zeta potential of O15 and O25 UOQ/pCMS-EGFP and G214/pCMS-EGFP polyplexes (N/P ratio of 20) at pH 7.4 and 6.5.
Cellular uptake of the FITC-pCMS-EGFP
The cell uptake is the first cellular barrier that influences the transfection efficiency of polyplex (Yue et al., Citation2011). To evaluate the internalization of FITC-pCMS-EGFP in HEK293 and ARPE19 cell lines, the cellular uptake experiments were carried out with three different formulations based on O15, O25 and G214 at pH 7.4 and 6.5 and N/P of 20.
According to our results, cell uptake of FITC-pCMS-EGFP by both cell types strongly depends on the pH value, being higher at pH 6.5 in both cell lines (). The higher cellular uptake at pH 6.5 can be explained by the strong increase of the zeta potential after medium acidification, as observed in . In accordance with other authors, we have concluded that the positive superficial charge of the polyplexes allows the electrostatic interaction with the negatively charged cell membrane, increasing the percentage of the cellular uptake (Nimesh et al., Citation2010; Yue et al., Citation2011; Kang et al., Citation2012).
Figure 4 Cellular uptake of FITC-labeled pCMS-EGFP delivered by UOC polyplexes (N/P = 20). Percentage of FITC-positive cells treated with O15 and O25 UOC and G214 chitosan at pH 6.5 and 7.4 in HEK293 (A1) and ARPE19 (A2) cell lines. Fluorescent images of FITC-pCMS-EGFP uptake: O15 UOC/FITC-pCMS-EGFP at pH 7.4 in HEK293 (B1); O25 UOC/FITC-pCMS-EGFP at pH 7.4 in HEK293 (B2); G214/FITC-pCMS-EGFP at pH 7.4 in HEK293 (B3); O15 UOC/FITC-pCMS-EGFP at pH 6.5 in HEK293 (B4); O25 UOC/FITC-pCMS-EGFP at pH 6.5 in HEK293 (B5); G214/FITC-pCMS-EGFP at pH 6.5 in HEk293 (B6); O15 UOC/FITC-pCMS-EGFP at pH 7.4 in ARPE19 (B7); O25 UOC/FITC-pCMS-EGFP at pH 7.4 in ARPE19 (B8); G214/FITC-pCMS-EGFP at pH 7.4 in ARPE19 (B9); O15 UOC/FITC-pCMS-EGFP at pH 6.5 in ARPE19 (B10); O25 UOC/FITC-pCMS-EGFP at pH 6.5 in ARPE19 (B11); G214/FITC-pCMS-EGFP at pH 6.5 in ARPE19 (B12).
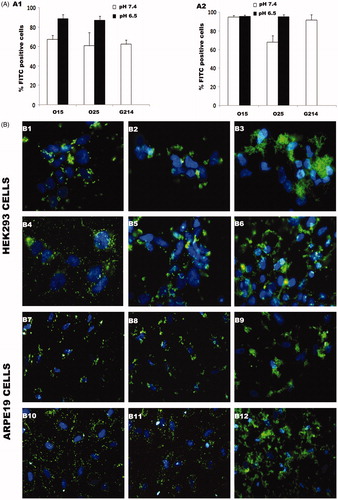
Furthermore, as it can be observed in , polyplexes elaborated at pH 6.5 present a smaller particle size compared to those formed at pH 7.4, especially with O15 and O25 UOCs. This reduction of the particle size could also explain the higher cellular uptake achieved at pH 6.5. Surprisingly, in ARPE19 cells, polyplexes elaborated with O15 UOC at pH 7.4 shown a similar cellular uptake to those at pH 6.5. These polyplexes elaborated at pH 7.4 have a particle size around 250 nm, which is significantly higher than the rest of the UOC-based polyplexes. In addition, polyplexes formed with G214 chitosan, which particle size is above 400 nm, shown around 90% of cellular uptake. These results suggest that the particle size is not a critical factor for the cellular uptake process in ARPE19 cells. Thus, the influence of the particle size may be different depending on the tested cell line, as Conner & Schmid (Citation2003) concluded. In addition, it should be highlighted the lower cellular uptake obtained in HEK293 cells compared to ARPE19 cells. Based on these results, we suggest the possibility of a large-cell-type-dependent internalization of the polyplexes. However, for a better understanding of this issue, more specific assays about the internalization procedure of the polyplexes line are needed.
Huang et al. (Citation2004) reported that the MW of the chitosan also influences the cellular uptake. According to them, the uptake of chitosan nanoparticles by A549 cells fell by 26% when chitosan MW decreased from 213 to 10 kDa. Contrary to these results, we observed that the polyplexes elaborated with oligomeric chitosans (O15 and O25) presented a similar cellular uptake compared to those elaborated with high MW G214, especially in HEK293. Despite the apparent importance of the MW on the cellular uptake, these authors claimed that chitosan DDA has a higher influence, describing a 41% decrease when DDA was lowered from 88 to 46%. This could explain why the cellular uptake for G214 (DDA of 92%) was not higher than that obtained with UOCs (DDA 99%). Moreover, other authors have concluded that the MW of the cationic polymer does not influence on the cellular uptake of the polyplexes (Layman et al., Citation2009), which reinforce the higher importance of chitosan DDA on this process.
Influence of pH decrease on the transfection efficiency of UOC/pCMS-EGFP polyplexes
According to literature, the transfection efficiency presented by chitosan-based gene carriers is not sufficient for practical applications, and, therefore, its improvement has become the main goal in many research works (Wang et al., Citation2011). In addition, the determination of the best formulation conditions for an efficient in vitro transfection is a critical step in the development of clinically relevant chitosan-based nonviral gene carriers (Strand et al., Citation2005). For this reason, we measured the relationship between the experimental parameters and the transfection capacity of UOC/pCMS-EGFP polyplexes in HEK293 and ARPE19 cells.
The efficacy of gene delivery is strictly controlled by the ability of the polymer to bind, protect and release its pDNA cargo (Strand et al., Citation2010). An accurate balance between DNA-binding capacity and DNA release must be achieved. Transfection efficiency is hampered by great binding strengths between chitosan carrier and its pDNA cargo (Alatorre-Meda et al., Citation2011). We have recently described that after agarose gel electrophoresis assay, cationic UOCs are able to complex, release and protect the pDNA in a N/P ratio range from 10 to 30 (Ishii et al., Citation2001; Puras et al., Citation2013a,b).
We have recently demonstrated that the transfection efficiency of UOC/pDNA polyplexes drastically increases, in HEK293 cells, when pH slightly decreases from 7.4 to 7.1. However, O25 UOC/pDNA polyplexes were not able to transfect ARPE19 cells, neither at pH 7.4 nor at pH 7.1 (Puras et al., Citation2013a,b). For this reason, we decided to further decrease the pH, to nontoxic limit value (6.5), with the aim of improving the in vitro results obtained at pH 7.1.
Surprisingly, the chitosan/plasmid complexes elaborated by Ishii et al. were unable to transfect SOJ cells at pH 6.5, while at pH 7 the transfection efficiency was optimal. In, contrary, according to our results, a significant increment of EGFP-positive cells occurs when the pH is acidified from 7.4 to 6.5, with both UOCs and in both cell lines (). This is in agreement with previously reported results in HEK293 and ARPE19 cells (Sato et al., Citation2001; Nimesh et al., Citation2010). Nevertheless, polyplexes based on high-MW G214 chitosan did not show transfection in any of the conditions (data not shown), although they present high cellular uptake levels. This could be explained in part due to the low capacity of these high-MW chitosan to release the DNA (Supplementary Figure S1) once inside the cell, as it has been reported it in the literature (Klausner et al., Citation2012). Furthermore, it must be highlighted that the significant increase in transfection efficiency is observed in ARPE19 cells using UOCs at pH 6.5, since this cell line was not transfected at pH 7.4.
Figure 5 Transfection efficiency of O15 and O25 UOC/pCMS-EGFP polyplexes (N/P = 20) at different pH values in HEK293 (A1) and ARPE19 cells (A2). Transfection data were normalized to Lipofectamine 2000™. Flow cytometry histograms (FL1/events) comparing transfection efficiencies at pH values of 6.5 and 7.4: HEK293 cells transfected with O15 UOC/pCMS-EGFP polyplexes (B1); HEK293 cells transfected with O25 UOC/pCMS-EGP polyplexes (B2); ARPE19 cells transfected with O15 UOC/pCMS-EGFP polyplexes (B3); ARPE19 cells transfected with O25 UOC/pCMS-EGFP polyplexes (B4). Overlay of phase contrast image with fluorescent illumination (GFP channel) to evaluate transfection efficiency: HEK293 cells transfected with O15 UOC vectors at pH 7.4 (C1); HEK293 cells transfected with O15 UOC vectors at pH 6.5 (C2); HEK293 cells trasnfected with O25 UOC vectors at pH 7.4 (C3); HEK293 cells transfected with O25 UOC vectors at pH 6.5 (C4); ARPE19 cells transfected with O15 UOC vectors at pH 7.4 (C5); ARPE19 cells trasnfected with O15 UOC vectors at pH 6.5 (C6).
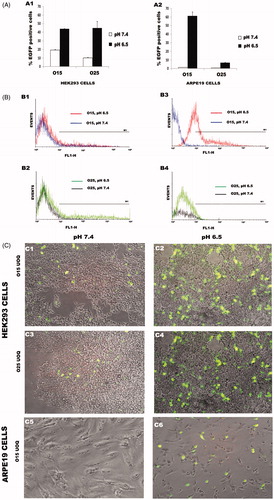
As confirmed with zeta measurements, at a lower pH value UOC/pCMS-EGFP polyplexes have more positive surface charge (), which favors the binding with the negatively charged cell membrane and the penetration into the cell (), resulting in a better transfection efficiency ().
It has been described that highly protonated chitosan complexes (+21 mV) cannot release from the endosome, which hampers the gene expression (Ishii et al., Citation2001). Despite the positive superficial charge (around +15 mV) of our UOC-based carriers, we suggest that they have enough ability for proton absorption, facilitating the rupture of the endosomal vesicles and the release of the polyplex into the cytoplasm. The lack of transfection observed with G214 polyplexes could be explained by the low buffer ability of G214 chitosan, which enables endosomal escape (Panyam & Labhasetwar, Citation2003; Lu et al., Citation2009).
Furthermore, O15 UOC polyplexes showed higher relative percentage of EGFP-positive cells compared to O25 UOC in ARPE19 cells at pH 6.5. This significant increase in transfection did not correspond to cell uptake results. Some authors have reported that differences in the intracellular trafficking and nuclear transport of the delivered pCMS-EGFP could explain the absence of correlation between the amount of internalized pCMS-EGFP and the level of transgene expression (Strand et al., Citation2010). However, this hypothesis should be verified in future experiments by tracing the localization of endosomes and DNA with fluorescent probes.
These in vitro transfection results support the potential use of UOC-based polyplexes for delivering genetic materials into cells, which are in an acidic environment; For instance, one of the most direct application of these polyplexes could be their local administration in tumor tissues, where the pH is more acidic than the physiological value (Tannock & Rotin, Citation1989; Han et al., Citation2010; Noh et al., Citation2010; Salva et al., Citation2010; Huang et al., Citation2012). In addition, considering the lower pH value of the vitreous humor, these polyplexes could be administered by intravitreous injection, achieving considerable gene expression levels (Bassnett & Duncan, Citation1985; Puras et al., Citation2013a,b).
Cell viability and cytotoxicity
To assess the potential citotoxicity of the UOC/pCMS-EGFP polyplexes and the influence of pH decrease on cell viability, CCK-8 assay was performed. It revealed the low cytotoxicity of UOC/pCMS-EGFP polyplexes after 72 h (). Slightly lower cell viability was observed in cells treated with polyplexes at pH 6.5, in both HEK293 and ARPE19 cell lines. This decreased viability could be explained by the increment of the superficial charge of polyplexes at pH 6.5. It has been demonstrated that the cytotoxicity is related to the interaction between polyplexes and cell membranes, which is higher with positively charged polyplexes (Nimesh et al., Citation2010). Cells incubated with Lipofectamine™ 2000 transfection reagents showed a considerable lower cellular dehydrogenase activity in comparison to cells transfected with polyplexes, which confirms the cytotoxic effect of Lipofectamine 2000™ on HEK293 and ARPE19 cells.
Figure 6 Cell viability and morphology of HEK293 and ARPE19 cells after transfection with O15 and O25 UOC vectors (N/P = 20) and Lipofectamine 2000™. Influence of pH on cell viability of HEK293 and ARPE19 cells by CCK-8 assay (A). Phalloidin and DAPI staining of HEK293 and ARPE19 cells after 4 h transfection; HEK293 cells transfected with O25 UOC vectors at pH value of 6.5 (B1); HEK293 cells tranfected with O25 UOC vectors at pH value of 7.4 (B2); HEK293 cells transfected with Lipofectamine 2000™ (B3); ARPE19 cells transfected with O25 UOC vectors at pH value of 6.5 (B4); ARPE19 cells transfected with O25 UOC vectors at pH value of 7.4 (B5); ARPE 19 cells transfected with Lipofectamine 2000™ (B6).
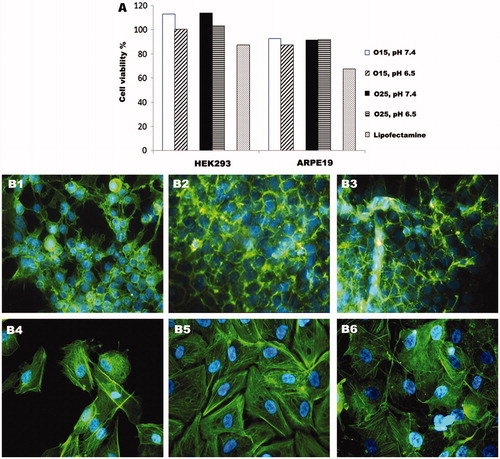
Actin–phalloiding staining did not show morphological disorders of cells transfected with UOC/pCMS-EGFP at pH 7.4 (). When the experiments were carried out at pH 6.5 values, cell morphology was slightly affected, especially in ARPE19 cells (, although cell viability assays did not demonstrate cytotoxicity. As it can be seen in , after the treatment with Lipofectamine 2000™, the morphology of HEK293 and ARPE19 cells completely changed, which indicates the higher toxicity of this lipidic vectors compared to UOC-based vectors.
In resume, our results indicate a very low toxic effect of the UOC/pCMS-EGFP polyplexes on these cells, regardless of the pH of the incubation medium.
Conclusion
In this study we found that the pH value of the medium clearly affects the physicochemical properties of our UOC/pCMS-EGFP polyplexes, turning them more positively charged when we acidified the medium. The strong increase of the zeta potential enhances the electrostatic interaction between the vectors and cell membrane, improving the cellular uptake and the transfection efficiency in both HEK293 and ARPE19 cells. Buffer capacity of UOCs contributes to an efficient intracellular trafficking compared to high-MW counterparts. Neither of our UOC/pCMS-EGFP vectors caused toxicity in our experimental conditions. However, cells treated with Lipofectamine 2000™ showed decreased cell viability. These results demonstrated the relevance of understanding the physicochemical behavior of UOC-based vectors for its biomedical application. Accordingly, this kind of vectors could be useful to transfect cells that are in an acidic environment, such as tumor cells. However, additional in vivo studies may be required in order to obtain an effective and safe medicine for nonviral gene therapy purpose.
Declaration of interest
The authors report no conflicts of interest. The authors alone are responsible for the content and writing of this article.
Supplementary Figure S1
Download PDF (304.1 KB)Acknowledgements
This project was partially supported by the University of the Basque Country UPV/EHU (UFI 11/32), Basque Government (call for the support of consolidated research groups in the Basque University System and predoctoral BFI-2011-226 grant) and Mexican Government (Grant of the National Council of Science and Technology, CONACYT; Reg. 217101). Technical and human support provided by SGIker (UPV/EHU) is gratefully acknowledged.
References
- Alatorre-Meda M, Taboada P, Hartl F, et al. (2011). The influence of chitosan valence on the complexation and transfection of DNA: the weaker the DNA–chitosan binding the higher the transfection efficiency. Colloids Surface B Biointerfaces 82:54–62
- Anchordoquy TJ, Koe G.S. (2000). Physical stability of nonviral plasmid-based therapeutics. J Pharm Sci 89:289–96
- Bassnett S, Duncan G. (1985). Direct measurement of pH in the rat lens by ion-sensitive microelectrodes. Exp Eye Res 40:585–90
- Borchard G. (2001). Chitosans for gene delivery. Adv Drug Deliv Rev 52:145–50
- Conner SD, Schmid SL. (2003). Regulated portals of entry into the cell. Nature 422:37–44
- de Martimprey H, Vauthier C, Malvy C, Couvreur P. (2009). Polymer nanocarriers for the delivery of small fragments of nucleic acids: oligonucleotides and siRNA. Eur J Pharm Biopharm 71:490–504
- Duceppe N, Trabrizian M. (2010). Advances in using chitosan-based nanoparticles for in vitro and in vivo drug and gene delivery. Expert Opin Drug Deliv 7:1191–207
- Gao Y, Zhang Z, Chen L, et al. (2009). Chitosan N-betainates/DNA self-assembly nanoparticles for gene delivery: in vitro uptake and transfection efficiency. Int J Pharm 371:156–62
- Glover DJ, Lipps HJ, Jans DA. (2005). Towards safe, non-viral therapeutic gene expression in humans. Nat Rev Genet 6:299–310
- Han HD, Mangala L.S, Lee J.W, et al. (2010). Targeted gene silencing using RGD-labeled chitosan nanoparticles. Clin Cancer Res 16:3910–22
- Huang M, Khor E, Lim L. (2004). Uptake and cytotoxicity of chitosan molecules and nanoparticles: effects of molecular weight and degree of deacetylation. Pharm Res 21:344–53
- Huang Z, Dong L, Chen J, et al. (2012). Low-molecular weight chitosan/vascular endothelial growth factor short hairpin RNA for the treatment of hepatocellular carcinoma. Life Sci 91:1207–15
- Ishii T, Okahata Y, Sato T. (2001). Mechanism of cell transfection with plasmid/chitosan complexes. Biochimica et Biophysica Acta (BBA) – Biomembranes 1514:51–64
- Kang HC, Samsonova O, Kang S, Bae YH. (2012). The effect of environmental pH on polymeric transfection efficiency. Biomaterials 33:1651–62
- Kim T, Jiang H, Jere D, et al. (2007). Chemical modification of chitosan as a gene carrier in vitro and in vivo. Prog Polym Sci 32:726–53
- Klausner EA, Zhang Z, Chapman RL, et al. (2010). Ultrapure chitosan oligomers as carriers for corneal gene transfer. Biomaterials 31:1814–20
- Klausner EA, Zhang Z, Wong SP, et al. (2012). Corneal gene delivery: chitosan oligomer as a carrier of CpG rich, CpG free or S/MAR plasmid DNA. J Gene Med 14:100–8
- Lavertu M, Méthot S, Tran-Khanh N, Buschmann MD. (2006). High efficiency gene transfer using chitosan/DNA nanoparticles with specific combinations of molecular weight and degree of deacetylation. Biomaterials 27:4815–24
- Layman J, Ramirez S, Green M, Long T. (2009). Influence of polycation molecular weight on poly(2-dimethylaminoethyl methacrylate)-mediated DNA delivery in vitro. Biomacromolecules 10:1244–52
- Lee DW, Powers K, Baney R. (2004). Physicochemical properties and blood compatibility of acylated chitosan nanoparticles. Carbohydr Polym 58:371–7
- Lu B, Wang C, Wu D, et al. (2009). Chitosan based oligoamine polymers: synthesis, characterization, and gene delivery. J Control Release 137:54–62
- Mao S, Sun W, Kissel T. (2010). Chitosan-based formulations for delivery of DNA and siRNA. Adv Drug Deliv Rev 62:12–27
- Mumper RJ, Wang J, Claspell JM, Rolland AP. (1995). Novel polymeric condensing carriers for gene delivery. Proc Intl Symp Control Rel Bioact Mater 22:178–9
- Nimesh S, Thibault M, Lavertu M, Thibault M. (2010). Enhanced gene delivery mediated by low molecular weight chitosan/DNA complexes: effect of pH and serum. Mol Biotechnol 46:182–96
- Noh SM, Park MO, Shim G, et al. (2010). Pegylated poly-l-arginine derivatives of chitosan for effective delivery of siRNA. J Control Release 145:159–64
- Panyam J, Labhasetwar V. (2003). Biodegradable nanoparticles for drug and gene delivery to cells and tissue. Adv Drug Deliv Rev 55:329–47
- Puras, G, Zarate, J, Aceves, M, et al. (2013a). Low molecular weight oligochitosans for non-viral retinal gene therapy. Eur J Pharm Biopharm 83:131--40
- Puras G, Zarate J, Díaz-Tahoces A, et al. (2013b). Oligochitosan polyplexes as carriers for retinal gene delivery. Eur J Pharm Sci 48:323–31
- Salva E, Kabasakal L, Eren F, et al. (2010). Chitosan/short hairpin RNA complexes for vascular endothelial growth factor suppression invasive breast carcinoma. Oligonucleotides 20:183–90
- Sato T, Ishii T, Okahata Y. (2001). In vitro gene delivery mediated by chitosan. Effect of pH, serum, and molecular mass of chitosan on the transfection efficiency. Biomaterials 22:2075–80
- Strand S, Danielsen S, Christensen B, Vårum K. (2005). Influence of chitosan structure on the formation and stability of DNA–chitosan polyelectrolyte complexes. Biomacromolecules 6:3357–66
- Strand SP, Lelu S, Reitan NK, et al. (2010). Molecular design of chitosan gene delivery systems with an optimized balance between polyplex stability and polyplex unpacking. Biomaterials 31:975–87
- Tannock IF, Rotin D. (1989). Acid pH in tumors and its potential for therapeutic exploitation. Cancer Res 49:4373–84
- Tripathi SK, Goyal R, Kumar P, Gupta KC. (2012). Linear polyethylenimine-graft-chitosan copolymers as efficient DNA/siRNA delivery vectors in vitro and in vivo. Nanomed Nanotechnol Biol Med 8:337–45
- Wang CK, Chan LW, Johnson RN, et al. (2011). The transduction of Coxsackie and Adenovirus Receptor-negative cells and protection against neutralizing antibodies by HPMA-co-oligolysine copolymer-coated adenovirus. Biomaterials 32:9536–45
- Yue Z, Wei W, Lv P, et al. (2011). Surface charge affects cellular uptake and intracellular trafficking of chitosan-based nanoparticles. Biomacromolecules 12:2440–6
- Zhao X, Yu S, Wu F, et al. (2006). Transfection of primary chondrocytes using chitosan-pEGFP nanoparticles. J Control Release 112:223–8