
Abstract
This study aimed to improve the dissolution rate and oral bioavailability of valsartan (VAL), a poorly soluble drug using solid dispersions (SDs). The SDs were prepared by a freeze-drying technique with polyethylene glycol 6000 (PEG6000) and hydroxypropylmethylcellulose (HPMC 100KV) as hydrophilic polymers, sodium hydroxide (NaOH) as an alkalizer, and poloxamer 188 as a surfactant without using any organic solvents. In vitro dissolution rate and physicochemical properties of the SDs were characterized using the USP paddle method, differential scanning calorimetry (DSC), X-ray diffractometry (XRD) and Fourier transform-infrared (FT-IR) spectroscopy, respectively. In addition, the oral bioavailability of SDs in rats was evaluated by using VAL (pure drug) as a reference. The dissolution rates of the SDs were significantly improved at pH 1.2 and pH 6.8 compared to those of the pure drug. The results from DSC, XRD showed that VAL was molecularly dispersed in the SDs as an amorphous form. The FT-IR results suggested that intermolecular hydrogen bonding had formed between VAL and its carriers. The SDs exhibited significantly higher values of AUC0–24 h and Cmax in comparison with the pure drug. In conclusion, hydrophilic polymer-based SDs prepared by a freeze-drying technique can be a promising method to enhance dissolution rate and oral bioavailability of VAL.
Introduction
Poorly water-soluble drugs often suffer from limited or irreproducible clinical response due to their low solubility and dissolution rate. A possible way of overcoming the challenges of reduced bioavailability caused by low solubility of poorly soluble drug is to alter the physical properties of active ingredient by preparation of solid dispersions (SDs) (Zerrouk et al., Citation2001; Palmieri et al., Citation2002; Lee et al., Citation2005). SDs can be defined as molecular mixtures of poorly water-soluble drugs and hydrophilic polymers, which present a drug release profile that is driven by the polymer properties. A transformation of drug crystallinity, a change in drug particle size and a better wettability exerted by the hydrophilic carrier resulted in an improved dissolution rate of active ingediant in vitro and in vivo (Mura et al., Citation2002; Purvis et al., Citation2006; Dai et al., Citation2007).
Numerous technologies have been widely attempted to prepare SDs, such as melting method, solvent-evaporation method and solvent-wetting method (Yamashita et al., Citation2003; Miller et al., Citation2007; Joe et al., Citation2010). However, there are some limitations of using these methods such as the degradation of drug due to the requirement of relatively high preparation temperatures, and the toxicity associated with the use of organic solvents. Freeze-drying is an industrial method which can keep the physical and chemical characters and biological activity of preparations and preserve the long-term stability (Tsinontides et al., Citation2004). Moreover, the drying process has clear influence on the surface of SD powders, which results in enhanced water uptake and wettability.
Valsartan (VAL) is an orally effective angiotensin II receptor antagonist (Criscione et al., Citation1993; Dina & Jafari, Citation2000) with low bioavailability of about 23∼39% in humans, which is mainly due to its poor aqueous solubility at low pH (Israili, Citation2000). The dissolution rate of VAL is limited by its low solubility under non-buffered or acidic conditions, while it is rapid and complete at pH 5.0 and above (Flesch et al., Citation1997). Furthermore, the carboxyl group of VAL mainly results in poor absorption in the gastrointestinal tract (Mbah, Citation2005).
In recent years, there has been increasing attention for incorporation of pH modifiers into the SDs to enhance the solubility and dissolution of the drug, whose solubility is dependent on pH (Riis et al., Citation2007). Moreover, pH modifiers can alter the microenvironmental pH and also change the drug crystallinity, resulting in an amorphous form because of intermolecular hydrogen bonding interactions (Tran, et al., Citation2008; Marasini et al., Citation2013). However, for these SDs, organic solvents such as ethanol were routinely used during the preparing process for dissolving the poorly water-soluble drugs.
In order to improve the dissolution and oral bioavailability of VAL, a hydroxypropyl methylcellulose (HPMC)-based SD has recently been reported (Yan et al., Citation2012). Although this VAL SD was prepared using water as a solvent, its clinical application might be greatly limited due to the potential irritations on gastrointestinal mucosa caused by the ionic surfactant (sodium lauryl sulfate) in SD. Therefore, it is essential to develop a novel SD system with less potential toxicity and no environmental pollutants, which is suitable for the clinical use and the large production.
In this study, novel organic solvent free SDs containing VAL were prepared by a freeze-drying technique using PEG6000 and HPMC 100KV as hydrophilic polymers, NaOH as an alkalizer (pH modifier) and poloxamer 188 as a surfactant. In vitro dissolution rate and physicochemical properties of SDs were investigated and in vivo oral bioavailability of SDs in rats was also evaluated to gain further insights into the absorption potential.
Materials and methods
Materials
Valsartan (VAL) was obtained from EuraPharm Co. (Suwon, Korea). Polyethylene glycol (PEG6000) and sodium hydroxide (NaOH) were purchased from Sinopharm Chemical Reagent Co. (Shanghai, China). Poloxamer 188 (Lutrol®F68) was kindly supplied by Chineway Pharmaceutical Tech. Co. (Shanghai, China). Hydroxypropyl-methylcellulose (HPMC 100KV) was supplied by Colorcon Co. (Shanghai, China). All reagents were of analytical grade except methanol and acetonitrile of chromatographic grade.
Preparation of solid dispersions and physical mixtures
The SDs containing VAL were prepared by a freeze-drying technique. The detailed compositions of SDs are shown in . Briefly, VAL, PEG6000 (or HPMC 100KV) and poloxamer 188 were accurately weighed and dissolved in 0.8 moL/mL NaOH solution with a continuous stirring. The resulting solutions were then frozen in vials at −70 °C and then freeze-dried using a lyophilizer (ChristAlpha1-4LSC, Osterode, Germany). After the freeze drying, the solid masses were grinded and sieved to obtain a particle size fraction of 125–500 µm. On the other hand, the corresponding physical mixtures (PMs) were also prepared by using a mortar until VAL and excipients well mixed.
Table 1. Formulation composition of SDs containing VAL (unit: g).
Drug content analysis
The SDs equivalent to 80 mg of VAL were dissolved in methanol and filtered through PTFE (0.45 μm) membrane filter. The VAL concentration in filtrate was determined by a high performance liquid chromatography (HPLC, Shimadzu LC-20A, Kyoto, Japan) at 265 nm on a Phenomenex® C18 (4.6 mm × 150 mm, 5 μm) column. Acetonitrile/water/acetic acid (60:40:0.1; v/v) was used as mobile phase at a flow rate of 1.4 mL/min. The column temperature was 35 °C and the injection volume was 20 μL (Cao et al., Citation2012).
Scanning electron microscopy
Samples were detected by S-4700 (Hitachi, Tokyo, Japan) scanning electron microscope in high vacuum mode. Samples were coated with gold for 180 s using a JEOL JFC-1100 sputter coater (Jeol, Tokyo, Japan) under argon atmosphere and then imaged at ambient temperature at 15 kV and observed at magnifications of 500×.
Differential scanning calorimetry
Differential scanning calorimetry (DSC) measurement was performed using a SDT 2960 Simultaneous DSC-TGA (TA Instruments, New Castle, DE). All samples (1–2 mg) were accurately weighted and placed in perforated aluminium pans. The samples were heated under nitrogen gas purge from 20 to 200 °C at a rate of 10 °C/min. The reference pan was left empty and sealed in the same way.
X-ray diffraction
X-ray diffraction (XRD) patterns were recorded using a X Pert-Pro MPD diffractometer (PANalytical B.V., Almelo, Netherlands) with a copper anode (Cu Ka radiation, 40 kV, 40 mA). Samples of powder were placed into channeled stages, and the diffraction profiles were measured from 5° to 50° with a scanning speed of 4°/min in a 2 theta range.
Fourier transform-infrared spectroscopy
Fourier transform-infrared (FT-IR) spectra of samples were recorded using a ProStar LC240 spectrophotometer (Thermo Electron Corporation, Waltham, QC). Samples were compressed into KBr disks in a hydraulic press in order to prepare sample-KBr-blends. KBr pellets were characterized from 400 to 4000 cm−1 and with a resolution of 2 cm−1.
In vitro dissolution study
Dissolution studies were carried out using the USP paddle method at 37 °C in a RCZ-6B2 dissolution tester (Shanghai, China) at 50 rpm with 900 mL of simulated gastric (pH 1.2) and intestinal (pH 6.8) fluids as dissolution media. The SDs (equivalent to 80 mg of VAL) and pure drug were filled into the hard gelatin capsules, respectively, and then exposed to the dissolution media for 2 h. The samples were taken out at predetermined time points (10, 20, 30, 45, 60, 90 and 120 min) and then filtered through a membrane filter (0.45 μm). In order to maintain the constant volume of dissolution media, an equivalent amount of fresh medium was added after each sample (5 mL) collection. The VAL concentration in dissolution samples was determined by a HPLC method as described above.
Bioavailability study
Animal experiment
Fifteen male Sprague–Dawley rats weighing 300–320 g were obtained from Shanghai Slac Laboratory Animal Co. Ltd. Prior to the experiments, the rats had free access to normal standard chow diet and tap water. All experiments were approved by the Institutional Animal Care and Use Committee of Soochow University. The rats were randomly divided into three different groups (n = 5, per group) and fasted for 12 h prior to the experiments. At the day of experiment, VAL (pure drug), SD1 and SD3 suspended in 0.5% of aqueous methylcellulose solution were given to each group of rats via an oral gavage at a dose equivalent to 7.2 mg VAL/kg of body weight, respectively. Blood samples (0.5 mL) were collected from the right femoral artery at 0.83, 0.25, 0.5, 1, 2, 4, 6, 8, 12 and 24 h after dosing and then centrifuged at 1500 × g for 10 min. Plasma samples were stored at −40 °C until being analyzed by HPLC.
Treatment of plasma samples
Twenty microliters of butyl-p-hydroxybenzoate (10 µg/mL) as an internal standard (IS) was added to 200 µL of each plasma sample and voltexed for 5 s. A hundred microliters hydrochloric acid and 1 mL of diethyl ether was added to the mixture and then agitated for 5 min using a vortex mixer. Thereafter, the mixture was centrifuged at 1500 × g for 10 min. The organic phase was transferred into a tube and evaporated under a gentle stream of nitrogen in a dry-thermo unit at room temperature. The residue was then reconstituted with 0.1 mL methanol and 20 µL of the resulting solution was injected into the HPLC system.
HPLC conditions
Chromatographic separation was performed on HPLC (Agilent LC1260, Santa Clara, CA) at a flow rate of 1.0 mL/min, using a Phenomenex C18 (4.6 mm × 150 mm, 5 μm). The column temperature was maintained at 35 °C. VAL concentration was determined at a wavelength of 254 nm. The mobile phase was methanol: 10 mM phosphate buffer (70:30, v/v %, pH 2.8).
Data analysis
Pharmacokinetic parameters of VAL were calculated using noncompartmental methods. The area under the plasma concentration–time curve from zero to 24 h (AUC0–24 h) was calculated using the linear trapezoidal method. The peak plasma concentration (Cmax) and the time to reach the peak plasma concentration (Tmax) were observed values from the experimental data. Data reported were arithmetic mean values ± standard deviation (mean ± SD). The statistical significance of the differences was performed using an analysis of variance (ANOVA) test and a p value <0.05 or 0.01 was considered significant.
Results and discussion
Preparation and characterization of SDs
In this study, PEG6000 and HPMC 100KV were used as hydrophilic polymers for the preparation of SDs. Four different types of SDs were readily prepared by a freeze-drying technique, respectively. In order to avoid using organic solvents during the preparation process, sodium hydroxide (NaOH) was used as an alkalizer to increase the solubility of VAL in the polymeric solutions. On the other hand, poloxamer 188 as a surfactant was attempted to incorporate into the SDs for enhancing the dissolution and oral absorption of VAL.
As shown in , the content of VAL in SD1, SD2, SD3 and SD4 were 98.91 ± 1.97, 99.70 ± 1.61, 97.26 ± 1.10 and 98.48 ± 0.89, respectively. This indicated that the formulation composition and preparing process had almost no effect on the drug content of the SDs.
Table 2. Drug content of SDs (n = 3).
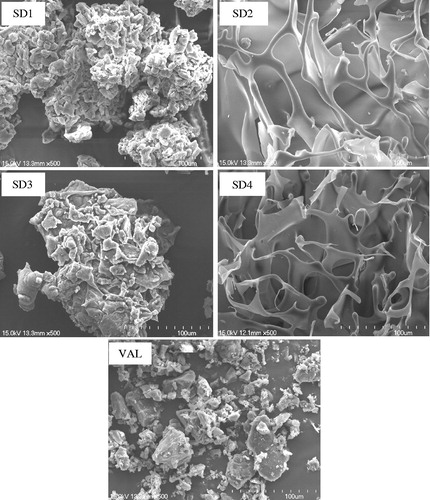
The solid state of the drugs in the OSF-SDs was characterized using scanning electron microscopy (SEM), DSC, XRD and FTIR. The SEM images of VAL and its SDs are shown in . VAL (pure drug) showed an irregular shape with a broad particle size. The PEG6000-based SDs (SD1 and SD3) were formed as regular shapes after grinding. In contrast, the HPMC-based SDs (SD2 and SD4) were found to have a fiber-like appearance and they were hardly grinded into the fine particles, possibly due to the characteristics of solid mass after freeze-drying.
Figure 1. Scanning electron microscopy images of SD1 (PEG6000), SD2 (HPMC 100KV), SD3 (PEG6000 + Poloxamer 188), SD4 (HPMC 100KV + Poloxamer 188) and VAL (pure drug). Magnifications are shown for each sample 500×.
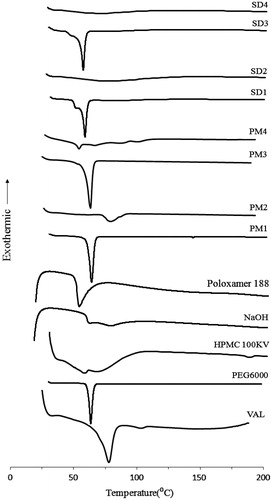
The DSC thermograms of VAL, excipients, solid dispersions (SDs) and their physical mixtures (PMs) are shown in . The DSC curve of VAL exhibited a sharp endothermic peak at ∼78 °C corresponding to its melting point. PEG6000 exhibited a single endothermic peak at 63.2 °C and HPMC 100KV had no intrinsic peaks. Interestingly, the DSC thermograms of VAL in PMs (PM1 and PM3) were similar to those from SDs. This could be attributed the fact that VAL in PMs should be dissolved in the melted polymer (PEG6000) when thermal analysis was carried out and thus the endothermic peak of drug did not appear (Kim et al., Citation2006; Yu et al., Citation2007). Similarly, no distinct endothermic peaks could be found in the HPMC-based PM4 containing poloxamer 188, which might be due to the low melting point of the surfactant. No characteristic peaks for VAL were observed in the SDs (SD1, SD2, SD3 and SD4). However, the absence of VAL endothermic peak in the thermograms of SDs could not indicate the change in drug crystallinity to an amorphous form.
Figure 2. DSC thermograms of VAL, excipents, solid dispersions (SDs) and their physical mixtures (PMs). VAL: pure drug; SD1: PEG6000; SD2: HPMC 100KV; SD3: PEG6000 + Poloxamer 188; SD4: HPMC 100KV + Poloxamer 188.
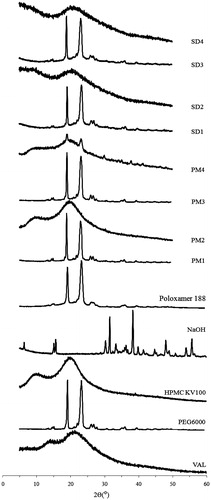
Since the crystallinity of VAL in SDs and PMs could not be identified using DSC analysis, XRD was used to confirm the loss of drug crystallinity. As shown in , VAL showed intrinsic peaks at the diffraction angles, displaying a broad crystalline pattern. The characteristic crystalline signals of drug were hardly observed in the PEG6000-based SDs (SD1 and SD3), indicating that the drug’s crystalline structure might be changed into an amorphous form. On the other hand, some distinctive crystalline peaks of the drug remarkably weakened in the HPMC-based SDs (SD2 and SD4) when compared to the pure drug as shown in the Supplemental Material (Figure S1). The disappearance of characteristic peaks or a large reduction of characteristic peaks indicates that a high concentration of drug is dissolved in the solid state or that the drug is in an amorphous state (Tran et al., Citation2009).
Figure 3. XRD patterns of VAL, excipients, solid dispersions (SDs) and their physical mixtures (PMs). VAL: pure drug; SD1: PEG6000; SD2: HPMC 100KV; SD3: PEG6000 + Polomamer 188; SD4: HPMC 100KV + Polomamer 188.
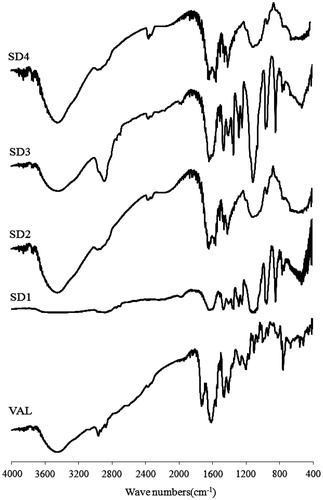
Structural changes and the lack of a crystal structure can lead to changes in the molecular bonding between functional groups which can be detected by FTIR spectroscopy (Chawla et al., Citation2003). illustrates the FT-IR spectra of VAL and its SDs. The VAL spectrum showed a distinct absorption peak for the carbonyl group C=O at 1732 cm−1 and the C=N band at 1606 cm−1. However, these absorption peaks have been changed in the SDs. The C=O band disappeared and the C=N band was broadened and disminished in the PEG6000-based SDs (SD1 and SD3). These peaks were clearly shifted to lower wave numbers in the HPMC-based SDs (SD2 and SD4). Moreover, the vibration of C–H bond at 2962 cm−1 was also changed for both PEG6000 and HPMC-based SDs. These differences confirmed that there are some intermolecular interactions between the drug and its carriers, resulting in enhanced dissolution rate of VAL in SDs.
Figure 4. FT-IR spectra of VAL and SDs. VAL: pure drug; SD1: PEG6000; SD2: HPMC 100KV; SD3: PEG6000 + Polomamer 188; SD4: HPMC 100KV + Polomamer 188.
Dissolution study
In order to assess the dissolution rate of VAL from SDs, the dissolution studies were carried out in both simulated gastric (pH 1.2) and intestinal (pH 6.8) fluids, respectively. As shown in , VAL (pure drug) and its SDs (SD1–SD4) showed relatively higher dissolution profiles at pH 1.2 () than at pH 6.8 (), due to the poor solubility of VAL at low pH. It could be also found that the dissolution rates of SDs were significantly higher when compared to those of pure drug, which might be caused by the hydrophilic carriers and pH modifier in the SDs. More importantly, the PEG6000-based SDs (SD1 and SD3) could reach the highest dissolution rate within 30 min, while the HPMC-based SDs (SD2 and SD4) exhibited much lower drug release even at 2 h. This might be due to the increased wettability of drug caused by PEG6000 (Vlachou et al., Citation2000; Huang et al., Citation2004). Although HPMC KV100 has a rapid hydration property in the aqueous solution (Koester et al., Citation2003), it showed relatively higher swelling property during the dissolution test and further retarded the drug release from the SDs.
Figure 5. Dissolution profiles of VAL, SD1 (PEG6000), SD2 (HPMC 100KV), SD3 (PEG6000 + Polomamer 188) and SD4 (HPMC 100KV + Polomamer 188) at pH 1.2 (a) and pH 6.8 (b). Each point represents the mean ± SD (n = 3).
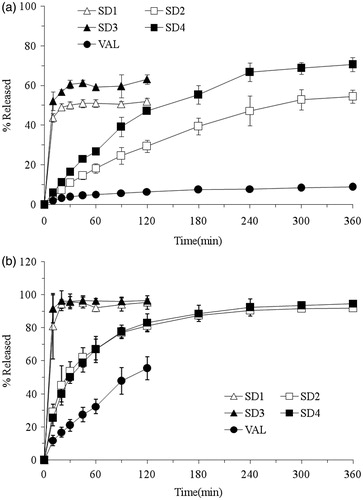
On the other hand, the SDs (SD3 and SD4) incorporated with poloxamer 188 exhibited relatively higher dissolution rates than the surfactant-free SDs (SD1 and SD2) at pH 1.2. Poloxamer 188 could decrease the surface tension between the drug particle and the media and hence result in additional wettability and solubilizing effects (Mura et al., Citation2005). Moreover, it always existed in an amphiphilic structure, which has the properties to self-assemble into micelles to increase the solubility of VAL (Dumortier et al., Citation2006). However, it had no significant effect on the dissolution rate of drug for the surfactant-based SDs (SD3 and SD4) at pH 6.8. This could be attributed to the fact that NaOH as a pH modifier increases the pH of microenvironment, which further results in enhanced solubility of drug. It was obvious that the solubilizing effect of poloxamer 188 was weakened by the pH modifier at pH 6.8.
Bioavailability study
A high performance liquid chromatography (HPLC) method for the determination of VAL in rat plasma was developed and validated. The linearity study was performed in the concentration range of 0.1–5 µg/mL (r = 0.9993) and the limit of quantification was 50 ng/mL. Typical chromatograms of blank plasma containing VAL and IS (20 µg/mL) are shown . The retention time of VAL and IS were 8.05 and 9.01 min, respectively. The precision, accuracy and extraction recovery for the determination of VAL in rat plasma are presented in . The intra-day and inter-day precision RSD values were <15%, and the intra-day and inter-day accuracy were >85% at a given concentration. The extraction recoveries at low, middle and high concentrations were 54.60%, 60.62% and 59.28%, respectively.
Figure 6. HPLC chromatograms of (A) blank plasma, (B) plasma with IS (20 µg/mL) and (C) plasma with VAL and IS (20 µg/mL).
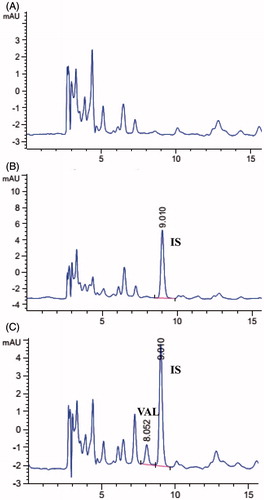
Table 3. Precision, accuracy and extraction recovery for the determination of VAL in rat plasma (n = 5).
The oral bioavailability and pharmacokinetic parameters of SDs were evaluated by using VAL (pure drug) as a reference after oral administration to rats. The PEG6000-based SDs (SD1 and SD3) were chosen in this study because of their relatively higher dissolution rates. As shown in , PEG6000-based SDs (SD1 and SD3) showed significantly higher drug concentration than VAL (pure drug) at a given dose in rats. The main pharmacokinetic parameters are also presented in . The AUC0−24 of SD1 and SD3 increased ∼1.9- and 2.3-folds compared with that of VAL (12.95 and 15.36µg h/mL versus 6.73µg h/mL, p < 0.01). It could also be found that SD3 exhibited higher AUC value than SD1, indicating the positive effect of poloxamer 188 on the drug absorption. The Cmax of SD3 was enhanced 1.6-fold as compared with that of VAL (2.91 µg/mL versus 1.80 µg/mL, p < 0.05). However, no significant difference was found between SD1 and pure drug (1.88 µg/mL versus 1.80 µg/mL, p > 0.05). Although VAL showed longer Tmax than SDs (SD1 and SD3), it displayed no significant difference compared with SDs. This might to be due to the high individual variation of Tmax in VAL group. Overall, The PEG6000-based SDs exhibited significantly higher bioavailability than the pure drug, which might to be due to the increased wettability and porosity properties of drugs produced by the hydrophilic polymer, surfactant and pH modifier (Bikiaris et al., Citation2005; Van den Mooter et al., Citation2006).
Figure 7. Plasma concentration–time profiles of VAL after a single administration of VAL (pure drug) and PEG6000-based SDs in rats (mean ± SD, n = 5).
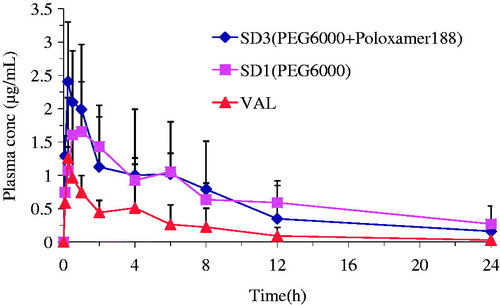
Table 4. Pharmacokinetic parameters of VAL after a single administration of VAL (pure drug) and PEG6000-based SDs to rats (mean ± SD, n =5).
Conclusion
In this study, hydrophilic polymer (PEG6000 or HPMC 100KV)-based SDs were successfully prepared by a freeze-drying method without using any organic solvent. A significant enhancement of the dissolution rate of VAL, a poorly water-soluble model drug, was achieved in SDs. The results of physicochemical properties suggest that VAL was molecularly dispersed in the carriers, and intermolecular hydrogen bonding between the drug and its carriers were formed in SDs. Furthermore, an enhanced oral bioavailability of VAL was achieved by formulating it into SDs. This study demonstrates organic solvent free freeze-drying technique can be a promising method to formulate VAL into SDs and improve its dissolution and bioavailability, with less potential toxicity and no environmental pollutants.
Supplemental Material.pdf
Download PDF (38.4 KB)Declaration of interest
This research was supported by a project funded by the Priority Academic Program Development of Jiangsu Higher Education Institutions (PAPD), and also financially supported by the projects sponsored by the Applied Basic Research Program, Suzhou Science and Technology Bureau (SYS 201204), the Scientific Research Foundation for the Returned Overseas Chinese Scholars, State Education Ministry (K513200611) and the National Natural Science Foundation (81173005) in China.
Related Research Data
References
- Bikiaris D, Papageorgiou GZ, Stergiou A, et al. (2005). Physicochemical studies on solid dispersions of poorly water-soluble drugs: evaluation of capabilities and limitations of thermal analysis techniques. Thermochim Acta 439:58–67
- Cao QR, Liu Y, Xu WJ, et al. (2012). Enhanced oral bioavailability of novel mucoadhesive pellets containing valsartan prepared by a dry powder-coating technique. Int J Pharm 434:325–33
- Chawla G, Gupta P, Thilagavathi R, et al. (2003). Characterization of solid-state forms of celecoxib. Eur J Pharm Sci 20:305–17
- Criscione L, De Gasparo M, Buhlmayer P, et al. (1993). Pharmacological profile of valsartan: a potent, orally active, nonpeptide antagonist of the angiotensin II AT1-receptor subtype. Br J Pharmacol 110:761–71
- Dai WG, Dong LC, Song YQ. (2007). Nanosizing of a drug/carrageenan complex to increase solubility and dissolution rate. Int J Pharm 342:201–7
- Dina R, Jafari M. (2000). Angiotensin II – receptor antagonist: an overview. Am J Health Syst Pharm 57:1231–40
- Dumortier G, Grossiord JL, Agnely F, Chaumeil JC. (2006). A review of poloxamer407 pharmaceutical and pharmacological characteristics. Pharmacol Res 23:2709–28
- Flesch G, Muller PH, Lloyd P. (1997). Absolute bioavailability and pharmacokinetics of valsartan, an angiotensin II receptor antagonist, in man. Eur J Clin Pharmacol 52:115–20
- Huang YB, Tsai YH, Yang WC, et al. (2004). Once-daily propranolol extended-release tablet dosage form: formulation design and in vitro/in vivo investigation. Eur J Pharm Biopharm 58:607–14
- Israili ZH. (2000). Clinical pharmacokinetics of angiotensin II (AT1) receptor blockers in hypertension. J Hum Hypertens 14:S73–86
- Joe JH, Lee WM, Park YJ, et al. (2010). Effect of the solid-dispersion method on the solubility and crystalline property Tacrolimus. Int J Pharm 395:161–6
- Kim EJ, Chun MK, Jang JS, et al. (2006). Preparation of a solid dispersion of felodipine using a solvent wetting method. Eur J Pharm Biopharm 64:200–5
- Koester LS, Mayorga P, Bassani VL. (2003). Carbamazepine/βCD/HPMC Solid Dispersions. I. Influence of the spray-drying process and βCD/HPMC on the drug dissolution profile. Drug Dev Ind Pharm 29:139–44
- Lee S, Nam K, Kim MS, et al. (2005). Preparation and characterization of solid dispersions of itraconazole by using aerosol solvent extraction system for improvement in drug solubility and bioavailability. Arch Pharm Res 28:866–74
- Marasini N, Tran TH, Poudel BK, et al. (2013). Fabrication and evaluation of pH-modulated solid dispersion spray-drying technique. Int J Pharm 441:424–32
- Mbah CJ. (2005). Physicochemical properties of valsartan and the effect of ethyl alcohol, propylene glycol and pH on its solubility. Pharmazie 60:849–50
- Miller DA, McConville JT, Yang W, et al. (2007). Hot-melt extrusion for enhanced delivery of drug particles. J Pharmacol Sci 96:361–76
- Mura P, Cirri M, Faucci MT, et al. (2002). Investigation of the effects of grinding and co-grinding on physicochemical properties of glisentide. J Pharm Biomed Anal 30:227–37
- Mura P, Moyano J, González-Rodríguez M, et al. (2005). Characterization and dissolution properties of ketoprofen in binary and ternary solid dispersions with polyethylene glycol and surfactants. Drug Dev Ind Pharm 31:425–34
- Palmieri GF, Cantalamessa F, Di Martino P, et al. (2002). Lonidamine solid dispersions: in vitro and in vivo evaluation. Drug Dev Ind Pharm 28:1241–50
- Purvis T, Vaughn JM, Rogers TL, et al. (2006). Cryogenic liquids, nanoparticles, and microencapsulation. Int J Pharm 324:43–50
- Riis T, Bauer-Brandl A, Wagner T, Kranz H. (2007). pH-independent drug release of an extremely poorly soluble weakly acidic drug from multiparticulate extended release formulations. Eur J Pharm Biopharm 65:78–84
- Tran PHL, Tran HTT, Lee BJ. (2008). Modulation of microenvironmental pH and crystallinity of ionizable telmisartan using alkalizers in solid dispersions for controlled release. J Control Release 129:59–65
- Tran TTD, Tran PHL, Lee BJ. (2009). Dissolution-modulating mechanism of alkalizers and polymers in a nanoemulsifying solid dispersion containing ionizable and poorly water-soluble drug. Eur J Pharm Biopharm 72:83–90
- Tsinontides SC, Rajniak P, Pham D, et al. (2004). Freeze drying-principles and practice for successful scale-up to manufacturing. Int J Pharm 280:1–16
- Van den Mooter G, Weuts I, De Ridder T, Blaton N. (2006). Evaluation of Inutec SP1 as a new carrier in the formulation of solid dispersions for poorly soluble drugs. Int J Pharm 316:1–6
- Vlachou M, Hani N, Efentakis M, et al. (2000). Polymers for use in controlled release systems: the effect of surfactants on their swelling properties. J Biomater Appl 15:65–77
- Yamashita K, Nakate T, Okimoto K, et al. (2003). Establishment of new preparation method for solid dispersion formulation of tacrolimus. Int J Pharm 267:79–91
- Yan YD, Sung JH, Kim KK, et al. (2012). Novel valsartan-loaded solid dispersion with enhanced bioavailability and no crystalline changes. Int J Pharm 422:202–10
- Yu J, Chun MK, Choi HK. (2007). Preparation and characterization of piroxicam/poloxamer solid dispersion prepared by melting method and solvent method. J Kor Pharm Sci 37:1–5
- Zerrouk N, Chemtob C, Arnaud P, et al. (2001). In vitro and in vivo evaluation of carbamazepine-PEG 6000 solid dispersions. Int J Pharm 225:49–62