
Abstract
This research aims at the development of controlled release contraceptive transdermal patches of centchroman using ethylcellulose (EC) as film-forming polymer, polydimethylsiloxane (PDMS) as pressure sensitive adhesive with propylene glycol and Di-n-butyl-phthalate for their penetration enhancer and plasticizing properties, respectively. The physicochemical compatibility of the drug and the polymers was performed by differential scanning calorimetry and Fourier transform infrared (FTIR) spectroscopic technique. Effects of EC and PDMS ratios on moisture uptake, moisture content, tensile strength (TS), Young’s modulus, adhesive strength, water vapor transmission rate (WVTR) and in vitro permeation of centchroman through Sprague–Dawley rats abdominal skin using Franz’s diffusion cell were evaluated. A 32 full factorial design was employed to observe the effect of independent variables; concentration of ethyl cellulose and PDMS on drug permeated after 32 h, which was selected as dependent variable. Compatibility studies suggested that there were no significant interaction between the drug and polymers used. It was found that incorporation of only EC resulted in too hard patches and addition of PDMS produced patches with lower TS, increased percentage elongation, WVTR and Young’s modulus. Statistical analyses suggested that independent variables have a significant effect on the dependent variable. All formulation follows zero-order release kinetics with r2 > 0.990. In conclusion, drug in adhesive transdermal patches can be successfully fabricated for non-steroidal contraceptive centchroman to obtain a zero-order release systems.
Introduction
Ormeloxifene (also known as dl-Centchroman); (trans-7-methoxy-2,2-dimethyl-3-phenyl-4-[4-(2-pyrrolidinoethoxy) phenyl] chroman hydrochloride) is a nonsteroidal selective estrogen receptor modulator (Makker et al., Citation2009) and highly safe over steroidal contraceptives (Chandra et al., Citation1977). Centchroman is marketed in India as a non steroidal oral contraceptive pill by HLL Lifecare Ltd., Kanagala, Belgaum, India, under the trade name Saheli. The physicochemical and pharmacokinetic characteristics of the drug are critical factor in deciding its suitability for delivery by the transdermal route. The physicochemical characteristics of centchroman like low molecular weight (<500), low melting point (<200), high lipid solubility (Paliwal & Gupta, Citation1996) and potency are in agreement with the ideal properties of molecule required for effective penetration through the stratum corneum (SC). In addition, the drug whose daily dose is in few milligrams are known to be suitable for their delivery by the transdermal route, and the dose of centchroman is 30 mg weekly, which makes it suitable candidate for transdermal delivery.
Transdermal is an effective alternative route for systemic drug delivery over conventional oral drug delivery for contraceptive drugs as it provides steady drug permeation for a prolonged period of time by minimizing pharmacokinetic variations (Cleary, Citation1984; Chien, Citation1987; Pfister, Citation1997). It is reported that weekly contraceptive transdermal patch provides good patient compliance over oral contraceptive pills (Audet et al., Citation2001) and also enables prompt drug delivery termination by patch removal (Chien, Citation1987; Barry, Citation2001), which can minimize its side effects. Among the different types of transdermal therapeutic systems, for hydrophobic drugs, the matrix-type drug-in-adhesive products (in which the drug is included in the adhesive, which is in direct contact with the skin) are very commonly preferred being thin, comprise of single layer, conformable and easy to manufacture (Mukherjee et al., Citation2005).
The polymer used in the study are polydimethylsiloxane (PDMS), which has excellent biocompatible adhesive properties (Loretta & Sobieski, Citation1999) and ethylcellulose (EC) as it is regarded as nontoxic, nonallergic, nonirritating and is listed as generally recognized as safe according to 21 CFR. EC also has good film-forming properties that enable it to form thin and uniform patches.
This study aims at the development of controlled release contraceptive transdermal patches of centchroman using varying concentrations of EC as film-forming polymer and PDMS as pressure sensitive adhesive (PSA), which offers better control over the drug release kinetics for a prolonged period of time and simultaneously improves adhesive and other physiochemical properties. Effect of independent variables; PDMS and EC concentration in transdermal formulation on dependent variable; amount of drug permeated (µg/cm2) in 32 h was studied using 32 full factorial designs. The data was subjected to statistical analysis in which analysis of variance (ANOVA) was used for evaluating the effect of concentration of EC and PDMS on the drug permeation, using the expert design software version 8.
Materials and methods
Materials
Centchroman was provided by HLL Lifecare (Thiruvananthapuram, India). Ethyl cellulose of ethoxy content 49.2% and PDMS were obtained from Sigma-Aldrich (St. Louis, MO), and Di-n-butyl phthalate was from Qualigen fine chemicals (Mumbai, India). Propylene glycol and poly ethylene glycol 400 were procured from Merck (Mumbai, India). Dichloromethane and all other chemicals used were of analytical grade.
Preparation of transdermal patch
Transdermal patches containing centchroman were prepared by the solvent evaporation technique using mercury as substrate. The different factors, their levels with codes and formulations that were prepared are listed in and , respectively. Total amount of EC is weighed and dissolved in 10 ml of dichloromethane. Centchroman (20% w/w of EC) was added slowly to the polymer solution and mixed thoroughly to obtain a uniform solution. PDMS was added to the solution for their PSA effect in varying concentrations for different formulations with propylene glycol (20% w/w of EC) and Di-n-butyl-phthalate (40% w/w of EC) for their penetration enhancer and plasticizer properties, respectively, and mixture was stirred thoroughly.
Table 1. Showing different factors and their levels with codes.
Table 2. 32 full factorial design layouts for centchroman transdermal patches of surface area 26.4 cm2.
The polymeric solution of the drug was poured onto the mercury having glass ring onto its surface (surface area 26.4 cm2) and dried at room temperature in a dust-free environment. The evaporation rate was controlled by covering whole assembly under inverted glass funnel with cotton on its mouth. After 24 h, the patches were cut into pieces of 5.3 cm2 surface area.
The transdermal patches were stored in a desiccator until further used.
Drug–excipients interaction study
For interaction studies, all samples were kept at 37 °C for at least seven days and then the following studies were done.
FTIR spectroscopy
FTIR spectra of pure drug and 1:1 EC drug physical mixture were obtained in KBr pellets at moderate scanning speed between 4000 and 500 cm−1 in a Perkin Elmer (Masachussets, USA) FTIR Spectroscope.
Differential scanning calorimetry
Samples were heated in a hermetically sealed aluminum pans and heat runs from 60–300 °C at a heating rate of 10 °C/min, using a temperature-modulated differential scanning calorimetry (DSC) (Perkin Elmer diamond DSC, Shelton, CT06484). Nitrogen was employed as blanket gas.
Physical evaluation of the prepared patches
Thickness
The thickness of patches were measured at three different places using a micrometer (Mitutoyo Co., Kawasaki, Japan) and mean values were calculated.
Weight variation
The patches were subjected to mass variation by individually weighing randomly selected patches. Such determinations were carried out for each formulation.
Folding endurance
This was determined by repeatedly folding one film at the same place until it broke. The number of times the film could be folded at the same place without breaking or cracking gave the value of folding endurance.
TS and percentage elongation at break
Patches (5.3 cm2) were fixed between the two clamps of an electronic dynamometer provided with a 1-kg load cell. The patches were pulled at the rate of 10 mm/min; TS, and elongation at break were calculated as per Equations (A.1) and (A.2) of Appendix, respectively.
Young’s modulus
It is the measure of stiffness of an isotropic elastic material. It can be calculated as per the formula in Equation (A.3) (Appendix).
Moisture content
The prepared patches were weighed individually and kept in desiccators containing activated silica at room temperature (25 °C) for about 24 h till a constant weight was attained. The percentage of moisture content was calculated as the difference between initial and final weight with respect to final weight (Gupta & Mukherjee, Citation2003) as per Equation (A.4) (Appendix).
Moisture uptake
A weighed film kept in desiccator at room temperature (25 °C) for about 24 h and was taken out and exposed to 65% relative humidity (RH) in a stability chamber, Lab Care (Mumbai, India), until a constant weight of film was obtained. The percentage moisture uptake was calculated as the difference between final and initial weight with respect to initial weight (Gupta & Mukherjee, Citation2003) as shown in Equation (EquationA.5(A.5) ) (Appendix).
Water vapor transmission rate
WVTR is defined as the quantity of moisture transmitted through unit area of film in unit time (Krishna & Pandit, Citation1994). Glass cells were filled with 1 g of anhydrous calcium chloride, and a film of specified area was affixed onto the cell rim. The assembly was accurately weighed and placed in a humidity chamber maintained at 25 ± 2 °C with 60 ± 5% RH. The vial were again weighed at the end of every first day, second, third up to seven consecutive days, and an increase in weight was considered as a quantitative measure transmitted through patch. It can be calculated as per Equation (EquationA.6(A.6) ) (Appendix).
Adhesive strength: peel adhesion 180 ° test
Twenty-four hours after preparation, the adhesive patches were cut into strips 5.3 cm2 wide, applied to an adherent plate made up of stainless steel, smoothed with thumb pressure maintained for 10 min at room temperature and pulled from the plate at a 180 ° angle with constant force 0.041 N for a constant period of time. Distance detached is noted and force required is calculated. Peel adhesion values were the average of three replicates.
Drug content analysis
The uniformity of drug distribution was determined by analyzing drug content of known area from three different places of the 26.4 cm2 film. The patches were dissolved in 10 ml of casting solvent, i.e. dichloromethane. After appropriate dilution, solutions were analyzed spectrophotometrically. The maximum absorbance of centchroman was noted at 283 nm using a double-beam spectrophotometer (UV Schimadzu, Kyoto, Japan). Solution of patches were prepared without drug as reference to neglect the absorption of components of the formulation if any.
In vitro skin permeation studies
Preparation of excised rat skin
Sprague–Dawley (SD) rats were sacrificed by excess ether inhalation. The dorsal skin of animal was shaved with the help of animal hair clipper and excised. The subcutaneous tissue was removed surgically, and dermis side was wiped with isopropyl alcohol to remove adhered fatty tissue. The skin was washed with phosphate buffer, wrapped in aluminum foil and stored at −20 °C and used within three days.
In vitro skin permeation studies methodology
Permeation experiments were conducted in Franz-type diffusion cells, with an exposed surface area of 1.76 cm2. The skin was mounted between the two half-cells of a Franz diffusion cell with its dermis surface facing the receptor half-cell of volume 37 ml. A unit of patch was then placed with its drug-releasing surface in contact with SC surface. During the course of the experiment, the donor compartment was left open to simulate real use conditions. The receptor media used was phosphate buffered saline of pH 7.4 with 30% v/v of poly ethylene glycol 400 to maintain sink condition. The whole assembly was fixed on a magnetic stirrer, and the solution in the receptor compartment was constantly and continuously stirred using magnetic beads at 50 rpm in order to prevent any boundary layer effects; the temperature was maintained at 32 ± 0.5 °C by a circulating water jacket.
The 0.5 ml of samples were withdrawn at different time intervals and analyzed for drug content by using HPLC method. The receptor phase was replenished with an equal volume of receptor media at each sample withdrawal. The cumulative percentages of drug permeated per square centimeter of patches were plotted against time.
HPLC description
A Shimadzu HPLC system with two LC-10AD pumps, SCL-10A VP system controller, 7125i rheodyne injector fitted with a fixed 20 µl loop, a SPD-10A VP variable wavelength programmable UV/Vis detector set at 280 nm, the stationary phase was RP-18 column (Lichrocart, Lichrospher Merck; 220 mm × 4.6 mm, particle size 5 µm) was used. The mobile phase used was acetonitrile:water (80:20) with tetra methyl ammonium hydroxide (10% v/v aqueous solution) and its pH was adjusted to 7.6 with orthophosphoric acid. The flow rate kept at 2.0 ml/min. The system was equipped with Class VP series (Kyoto, Japan) software version 6.12.
In vitro permeation data analysis
The cumulative amount of drug permeated (µg) divided by the surface area of the transdermal membrane (cm2) was plotted versus time in hours. The steady-state flux, J (μg/cm2 h) was obtained as the slope of the linear portion of the plot using linear regression analysis. The permeability coefficient of skin, Pc (cm/h) was obtained dividing the flux by the concentration (μg/cm3) of the dissolved drug in the donor compartment. In passive diffusion, the steady-state flux through unit area of a membrane is given by Fick’s law as in Equation (EquationA.7(A.7) ) (Appendix). In experiments where sink conditions are maintained in the receptor compartment, (Cd – Cr) can be replaced as in Equation (EquationA.8
(A.8) ) (Appendix). The penetration-enhancing effect of penetration enhancer was calculated in terms of enhancement ratio (ER) and was calculated by using Equation (EquationA.9
(A.9) ) (Appendix).
Release kinetics
In order to investigate the mechanism of centchroman released from transdermal patches, the permeation data was analyzed with the following mathematical models: zero-order kinetic equation (Equation EquationA.11(A.11) ), which describes the systems in which the drug release rate is independent of its concentration (Appendix), first-order kinetic equation (Equation EquationA.12
(A.12) ) (Appendix), which describes that the release rate is concentration-dependent and Higuchi kinetic equation (Equation EquationA.13
(A.13) ) (Appendix), which described the drug release as a square root of time-dependent process based on the Fickian diffusion. Furthermore, to confirm the mechanism of drug release, the drug release was fitted in the Korsmeyer–Peppas model (Equation (EquationA.14
(A.14) ) (Appendix)), which describes a simple relationship of drug release from a polymeric system.
Factorial design
A 32 randomized full-factorial design was used in this study. In this design, two prime factors or variables were evaluated, each at three levels. A factorial design evaluating two factors at all combinations for each level would result in a full-factorial design consisting of 32 = 9 runs, thus experimental trials were performed at all nine possible combination. The amount of PDMS and EC were selected as independent variables. The drug released in 32 h was selected as dependent variable. The design layout is depicted in .
Statistical design
A commercially available software program was used (Design Expert, Version 8, Stat-Ease Inc, Minneapolis, MN) for ANOVA and all statistical analyses. The experimental design chosen was response surface, two-factor, three-level factorial out of which nine formulations were prepared. Data were expressed as mean and standard deviation of separate experiments (n = 3).
Results and discussions
Interaction studies
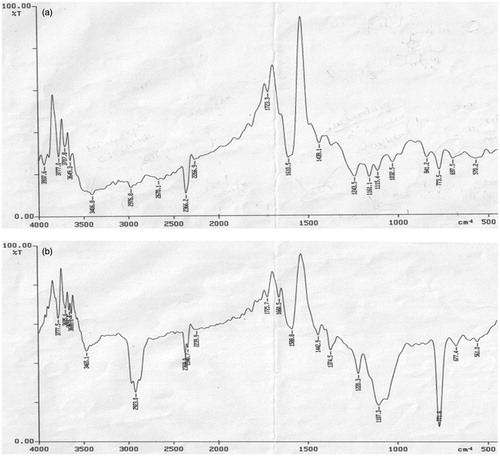
The compatibility of centchroman and polymer was evaluated through FTIR and DSC analysis. FTIR spectra for pure drug and 1:1 EC and drug physical mixture are presented in , respectively. Spectra showed that there was no change in major peaks or any interaction observed between drug and polymer. C–N stretching and C–O stretching of centchroman is clearly visible at 1220 cm−1 and 1107 cm−1, respectively, in the IR graph of physical mixture of pure drug and 1:1 EC and drug.
Figure 1. FTIR spectra of (a) pure centchroman, (b) physical mixture (1:1) centchroman and EC.
DSC curves of pure centchroman, ethyl cellulose and (1:1) EC–centchroman physical mixture are shown in , respectively. It was evident from the DSC profile () that centchroman exhibited a sharp endothermic peak at 155 °C. The same DSC profile () of the drug appeared in the EC–centchroman physical mixture, but with the loss of its sharp appearance. It appears that there is a significant reduction of drug crystallinity.
Figure 2. DSC thermograms of (a) pure centchroman, (b) ethylcellulose and (c) physical mixture (1:1) centchroman and EC.
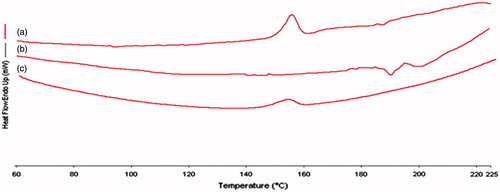
The FTIR and DSC studies apparently revealed that the drug was compatible with the polymer, and neither drug decomposition nor drug–polymer interactions occurred in the prepared formulation.
Film properties
The thickness ranged between 0.031 ± 0.0056 and 0.072 ± 0.0110 mm, the low standard deviation values ensure uniformity in thickness. The weights ranged between 08.1 ± 0.366 mg and 11.4 ± 0.735 mg indicated that different batches patch weights were relatively similar. Folding endurance test results was found to be between 98 ± 6.42 and 177 ± 8.90, which indicates that the patches would not break and would maintain their integrity with general skin folding when applied. This large range of folding endurance may be due to difference in PDMS and EC ratios, because when the concentration of PDMS was increased, the folding endurance was also increasing, this occurred because of elastic nature of PDMS but increased concentration of EC resulted in increased rigidity and consequently folding endurance was decreased.
The TS results indicate the strength of film and the risk of cracking. The results of TS (23.47–52.80 Pa) of different formulations are listed in , which suggested that the patch containing PDMS in higher amount were of lesser strength than patches with higher EC. Percentage elongation ranged from 36.20% to 87.48%.
Table 3. Showing physical evaluation of different formulation transdermal patch of 5.3 cm2 surface area.
Theoretically, as the concentration of PDMS increases, the % elongation should also increase because of the elastic nature of PDMS; but in this study, for lowest level (−1) of PDMS, the % elongation was found to be maximum, e.g. in formulations F1–F3 as increasing level of PDMS (0 and 1) resulted in minute pore formation which decreases % elongation, these pores were minimized as EC in the formulation was increased (Croll, Citation1979). These effects can be seen in the formulation F7–F9 as the % elongation was least in F7 in which the PDMS concentration was highest and EC concentrations were least; but when the concentration of EC was increased with same concentration of PDMS, the pores decreased and % elongation increased in F8 and maximum in F9.
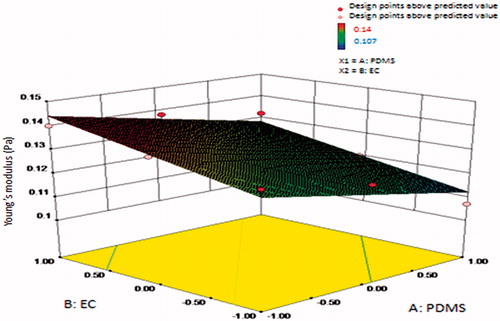
Young’s modulus is the measure of stiffness. It was found to be highest for the F3 formulation with lowest PDMS and highest EC. The pure PDMS is a very elastic material as it shows a hysteresis loop when plotted between Young modulus versus time; this may be because the falling crystallization breakdown indicated typical elastic inter-chain cohesion due to increase in Young’s modulus. Therefore, decreasing concentration of PDMS showed decreased Young’s modulus. It ranged from 0.107 to 0.140 Pascals. Results are shown in .
Figure 3. Surface response plot showing influence of polydimethylsiloxane (PDMS) and ethyl cellulose (EC) on Young’s modulus (Pa).
The film resulted as being “highly permeable to water vapor”, showing a WVTR not less than 35.9 g/m2 h (the BP limit above which the material is considered permeable is 20.8 g/m2 h). This value of water permeability is much higher than the average transepidermal water loss of healthy skin (0.5 µl cm−2h −1 (Roberts & Walters, Citation1998), which corresponds to 5 g/m2 h). Therefore, the bioadhesive film used as a patch for dermal or transdermal delivery is not occlusive on the skin. The WVTR was decreased with increasing concentration of EC as in F1–F3, while as the concentration of the PDMS was increased (in formulation F4 and F7) with constant concentration of EC, the permeation of water vapor increased drastically because of very minute pores formed in F4 and increased density of these pores in F7 – this phenomenon may be because of the evaporation rate difference between PDMS and EC. But, as the polymer concentration of EC was increased, the pore formation evades; this can be explained as per Croll’s theory of internal stress (Croll, Citation1979). This study suggested that formulation should contain minimum of 2% EC concentration for getting optimum physical property of film and for avoiding pore formation.
Percent drug content was analyzed, which uniformly ranged between 97.1 ± 2.00% and 99.3 ± 3.33% (); low standard deviation indicates the drug was uniformly distributed within the film. The moisture content and moisture uptake of the prepared patches play a vital role at the initial stage of drug release from dosage form (Golomb et al., Citation1990). In this study these were found to be low, which could decrease the release rate and could also help the formulations to remain stable, reduce brittleness during long-term storage and simultaneously protect the patches from microbial contamination. The adhesive force was found to be ranging from 12.25 N/25 mm or 0.49 N/cm to 51.75 N/25 mm or 2.07 N/mm under the test (n = 3). According to American Society for Testing Materials, the peel adhesion to steel (N/25 mm) is 10 or above, so the adhesive patches have satisfactory peel adhesion.
In vitro centchroman permeation across SD rat skin
The in vitro release profile is an important tool that predicts in advance how a drug will behave in vivo. The results of in vitro skin permeation studies of drug from transdermal patches are shown in . The cumulative amount of drug permeated from formulations containing higher concentration of PDMS released drug at faster rate, it may be because of the good permeability and adhesive nature of the polymer, which increases the contact surface area between the patch and the skin. Centchroman permeation profiles across rat abdominal skin from different formulations can be seen in .
Figure 4. Centchroman permeation profiles across rat abdominal skin from different formulations. (Mean ± SD) n = 3.
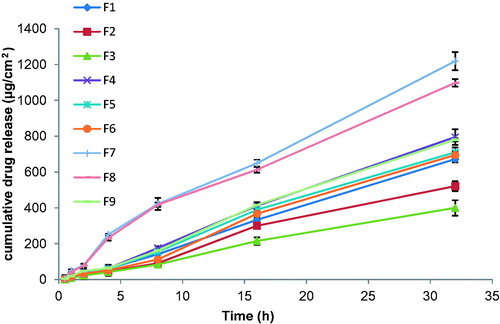
Table 4. Showing effect of different formulations on the permeation parameters of the drug through Transdermal patch.
Flux (μg/cm2hr) and permeability coefficient (cm/hr) of the formulations were calculated, and it was interpreted from the results that increasing the concentration of PDMS as in formulations F7–F9, which has highest PDMS, increased the flux (32.37 ± 2.28 to 37.68 ± 0.09 μg/cm2hr) as well as the permeability coefficient (0.0208–0.0272 cm/h); but as the concentration of EC increased in this batch from F7–F9, the small decrease in both of these parameters can be seen, which is shown in . ER of different formulations was calculated comparing each formulation with their relevant control devoid of PDMS; the results suggested that PDMS had significant role on ER values (1.12–3.30).
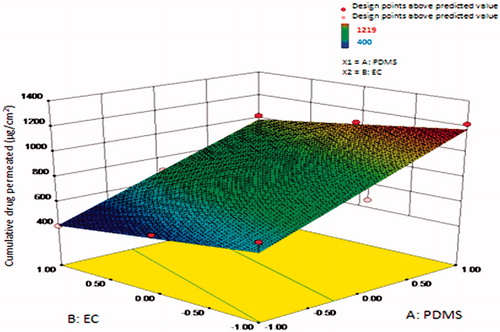
Highest centchroman permeation can be seen in F7 (1219 ± 3.27 µg/cm2) as it has the least concentration of EC and highest PDMS. Formulation containing EC concentration of 2% and variable concentration of PDMS, e.g. F3, F6 and F9, showed the lowest permeation rate as compared to formulation containing EC concentration less than 2%. Among F3, F6 and F9, formulation F9 exhibited greatest 1020 ± 14.11 µg/cm2, F6 showed 695 ± 07.78 µg/cm2 of drug permeation value, while formulation F3 exhibited lowest 400 ± 10.65 µg/cm2 of drug release value in 32 h. This cumulative amount of drug permeated (µg/cm2) increased as the concentration of PDMS increased, as shown in .
Figure 5. Surface response plot showing influence of polydimethylsiloxane (PDMS) and ethylcellulose (EC) on cumulative amount of drug release (µg/cm2) in 32 h.
Different permeation kinetic models (zero order, first order, Higuchi and Korsmeyer–Peppas) were applied to interpret the drug release kinetics and to know the mechanism of drug release from these matrix patches, the values for release constant (k), correlation coefficient (r2) and release exponent (n) for different kinetic models are listed in . All formulations showed maximum fit with zero-order release kinetics with r2 > 0.990 and low correlation coefficients for first and Higuchi kinetic models; this clearly indicates that all patches could sustain the release independent of concentration gradient. This was further confirmed by the Korsmeyer–Peppas model as the value of release exponent (n) is more than one, thus the release mechanism from patches was non-Fickian.
Table 5. Showing release constant (k), correlation coefficients (r2) and release exponent (n) for linear relationship of the proposed combined kinetics.
Statistical analyses
ANOVA results indicated that the concentration of PDMS and the concentration of EC were the significant factors (p < 0.05) influencing drug release.
Conclusions
From the above findings, it can be concluded that a successful controlled release transdermal delivery system can be prepared for centchroman with zero-order release mechanism using EC as film-forming polymer and PDMS as PSA. Using PDMS and EC in the study had a profound effect on the formulation that was affecting the physical as well as the drug permeation properties of transdermal patches, which was confirmed by statistical analyses. Release can be optimized by adjusting PDMS and EC or concentrations of both. In addition, increasing the PDMS concentration increased the in vitro drug permeation from the SD rat abdominal skin, and increasing EC concentration had an opposite effect. However, for the confirmation of these findings, the pharmacodynamic and pharmacokinetic evaluation of these systems in animals and human volunteers is necessary.
Acknowledgements
Authors are thankful to HLL Lifecare, Thiruvananthapuram, for providing the samples of Centchroman and SAIF, CDRI, Lucknow, for spectral data.
Declaration of interest
No conflict of interests reported. Authors greatly acknowledge the financial support provided by CSIR for one of them (V. G.).
References
- Audet MC, Moreau M, Koltun WD, et al. (2001). Evaluation of contraceptive efficacy and cycle control of a transdermal contraceptive patch vs an oral contraceptive: a randomized controlled trial. JAMA 285:2347–54
- Barry BW. (2001). Novel mechanisms and devices to enable successful transdermal drug delivery. Eur J Pharm Sci 14:101–14
- Chandra H, Srimal RC, Kamboj VP, et al. (1977). Clinical pharmacology studies with Centchroman. Indian J Exp Biol 15:1170–2
- Chien YW. (1987). Advances in transdermal systemic medication. In: Chien YW, ed. Transdermal controlled systemic medications. : Marcel Dekker, 1–22
- Cleary GW. (1984). Medical applications of controlled release. In: Langer DL, ed. Transdermal controlled release systems. : CRC, 203–51
- Croll SG. (1979). The origin of residual internal stress in solvent-cast thermoplastic coatings. J Appl Polymer Sci 23:847–58
- Golomb G, Fisher P, Rahamim E. (1990). The relationship between drug release rate, particle size and swelling of silicone matrices. J Control Release 12:121–32
- Gupta R, Mukherjee B. (2003). Development and in vitro evaluation of diltiazem hydrochloride transdermal patches based on povidone-ethylcellulose matrices. Drug Dev Ind Pharm 29:1–7
- Krishna R, Pandit JK. (1994). Transdermal delivery of propranolol. Drug Dev Ind Pharm 20:2459–65
- Loretta A, Sobieski J. (1999). Handbook of pressure sensitive adhesive technology. Donatas Satas 1999:550–9
- Makker A, Tandon I, Goel MM, et al. (2009). Effect of ormeloxifene, a selective estrogen receptor modulator, on biomarkers of endometrial receptivity and pinopode development and its relation to fertility and infertility in Indian subjects. Fertil Steril 91:2298–307
- Mukherjee B, Mahapatra S, Gupta R, et al. (2005). A comparison between povidone-ethylcellulose and povidone-eudragit transdermal dexamethasone matrix patches based on in vitro skin permeation. Eur J Pharm Biopharm 59:475–83
- Paliwal JK, Gupta RC. (1996). Tissue distribution and pharmacokinetics of centchroman. A new nonsteroidal post-coital contraceptive agent and its 7-desmethyl metabolite in female rats after a single oral dose. Drug Metab Dispos 24:148–55
- Pfister WR. (1997). Transdermal and dermal therapeutic systems: current status. In: Ghosh TK, Pfister WR, Yum SI, ed. Transdermal and topical drug delivery systems. : Interpharm Press, 33–112
- Roberts MS, Walters KA. (1998). The relationship between structure and barrier function of skin. In: Roberts MS, Walters KA, ed. Dermal absorption and toxicity assessment. : Marcel Dekker, 1–42
Appendix
(A.1)
(A.2)
(A.3)
where
F = force applied to film.
Ao = original cross section through which force is applied.
ΔL = amount by which length of object changes.
Lo = original length of the film.
W = weight increase in g.
S = surface area in m2.
T = time of exposure in h.
J = steady-state flux (μg/cm2 h)
Cd = concentration of drug in the donor compartment (μg/cm3)
Cr = concentration of drug in the receptor compartment (μg/cm3)
Pc = permeability coefficient of skin (cm/h)
ER = enhancement ratio
Qt = percent of drug released at time t
Q0 = initial amount of drug present in the transdermal patch
K0, K1 and Kh = constants of the equations
Mt/Mα = fraction of the drug release at time t
Kp = rate constant
n = release exponent