
Abstract
The aim of the present study was to prepare and evaluate a rasagiline-loaded chitosan glutamate nanoparticles (RAS-CG-NPs) by ionic gelation of CG with tripolyphosphate anions (TPP). RAS-loaded CG-NPs were characterized for particle size, size distribution, encapsulation efficiency and in vitro drug release. The mean particles size, polydispersity index (PDI) and encapsulation efficiency was found to be 151.1 ± 10.31, 0.380 ± 0.01 and 96.43 ± 4.23, respectively. Biodistribution of RAS formulations in the brain and blood of mice following intranasal (i.n.) and intravenous (i.v.) administration was performed using HPLC analytical method. The drug concentrations in brain following the i.n. of CG-NPs were found to be significantly higher at all the time points compared to both drug (i.n.) and drug CG-NPs (i.v.). The Cmax (999.25 ng/ml) and AUC (2086.60 ng h/ml) of formulation CG-NPs (i.n) were found to be significantly higher than CG-NPs (i.v.) and RAS solution (i.n.). The direct transport percentage (DTP%) values of RAS-loaded CG-NPs (i.n.) as compared to drug solution (i.n.) increased from 66.27 ± 1.8 to 69.27 ± 2.1%. The results showed significant enhancement of bioavailability in brain, after administration of the RAS-loaded CG-NPs which could be a substantial achievement of direct nose to brain targeting in Parkinson's disease therapy.
Introduction
Intranasal delivery is a non-invasive route for drugs that are active in low doses and show no or minimal oral bioavailability. A wide variety of therapeutics compound may be administered intranasally for local, systemic and central nervous system (CNS) action (Dhuria et al., Citation2010). Drugs gain access directly from the nasal mucosa to the brain and spinal cord utilizing pathways along olfactory and trigeminal nerves with the aim of treating CNS disorders while minimizing systemic exposure (Pires et al., Citation2009; Mittal et al., Citation2013). Systemic delivery of therapeutics to the CNS is not effective for nearly 100% large molecule and >98% of small molecule drugs due to barriers present in the brain, which prevents the entering of therapeutics from the circulating blood to the brain or tightly segregates the brain from the circulating blood. The barriers are blood–brain barrier (BBB), blood cerebrospinal–fluid barrier (BCSFB) (Dhuria et al., Citation2010). Consequentially a number of invasive strategies like intraparenchymal, intraventricular, intrathecal delivery (BBB disruption) and non-invasive techniques like chemical modifications, prodrug approach and conjugation of a drug with antibodies or ligands have been used to increase the CNS targeting of drugs (Davis, Citation1997). Nose-to-brain delivery of drug moieties have been attempted by several researchers to exploit the advantages of this route, such as circumvention of the BBB, avoidance of hepatic first-pass metabolism, practicality and convenience of administration and non-invasive nature (Illum, Citation2000).
Parkinson's disease (PD) is a progressive neurological disorder which affect around 2% of adults over the age of 60 years (Nussbaum & Ellis, Citation2003). Majority of the cases are idiopathic, some are arteriosclerotic. The main symptoms of PD are related to movement abnormalities, such as rigidity, tremor, akinesia, bradykinesia, masked face and gait and, posture alterations (Fernández et al., Citation2011). The pathogenesis of PD are aging, mitochondrial dysfunction, oxidative stress and apoptosis. The most consistent lesion in PD is degeneration of neurons in the substantia nigra pars compacta (SN-PC) (a region of the midbrain) and the nigrostriatal (dopaminergic) tract (Taylor et al., Citation2002). This results in deficiency of dopamine (DA) in the striatum which controls muscle tone and coordinates movement. An imbalance between dopaminergic (inhibitory) and cholinergic (excitatory) system in the striatum occurs giving rise to the motor defect. Oxidation of DA by MAO-B and aldehyde dehydrogenase generates hydroxyl free radicals (OH) to damage lipid membranes and DNA resulting in neuronal degeneration (Schapira, Citation2005). Therefore, there is a need to develop safe and effective formulation with good patient compliance for PD including both drugs and drug delivery systems (Wen et al., Citation2011).
Rasagiline (RAS) was chosen as a drug candidate for PD as it is selective and irreversible second generation inhibitor of monoamine oxidase type B (MAO-B) with dopamine receptor agonist activity (Gallagher & Schrag, Citation2008), or as adjuvant therapy for levodopa in more advanced cases (Parkinson Study Group, Citation2005). The maximum oral dose recommended in monotherapy as well as in adjunct therapy is 1.0 mg once daily due to the risks associated with non-selective inhibition of MAO if daily doses exceed the maximum recommended dose (Fernandez et al., Citation2011). The oral route possesses GI adverse effect like nausea, vomiting, headache and dizziness which causes patient incompliance. RAS is rapidly absorbed and achieves the peak plasma concentration within 30 min; however, it has very short elimination half-life (0.6–2 h) and low oral bioavailability (36%) due to hepatic first pass effect (Fernandez et al., Citation2011). Thus, the administration of drug by nasal route will be a promising method to bypass the first pass effect thus improving the bioavailability. Therefore, these biopharmaceutics and pharmacokinetic characteristics and its efficacy in a chronic disease such as PD make RAS a suitable candidate for the development of a controlled and sustained release system. Ravi and coworkers have prepared nasal in-situ gel using combination of poloxamer 407 and poloxamer 188 (1:1) with mucoadhesive polymers (carbopol 934 P and chitosan. They have showed optimal formulations had acceptable gelation temperature (28–33 °C), adequate in vitro drug release profile and improvement in bioavailability (four- to six-folds) as compared to oral solution (Ravi et al., Citation2013).
The use of biodegradable and biocompatible nanoparticles for the controlled release of RAS could represent an attractive alternative to its in-situ nasal gel formulations (Fernandez et al., Citation2011). Polymeric NPs have received increasing interest as they can control the rate of drug release, prolong the duration of the therapeutic effect, have high drug loading capacity, provide high surface area which can release the drug faster as compared to other carriers and deliver the drugs to specific sites in the body. Apart from these advantages, these NPs may also offer an improvement as compared to others delivery system used for nose-to-brain drug delivery since they are able to protect the encapsulated drug from biological and/or chemical degradation, and extracellular transport by P-gp efflux proteins. This would also in turn increase CNS availability of the drug. Their small diameter potentially allows NPs to be transported transcellularly through olfactory neurones to the brain via the various endocytic pathways of sustentacular or neuronal cells in the olfactory membrane to treat PD (Md et al., Citation2013). Thus, the proposed NPs would be a better alternative as compared to in-situ nasal gel.
Moreover chitosan glutamate nanoparticles (CG-NPs), possess added advantages over the chitosan, is more able to increase the in vitro dissolution rate of drug. The phenomenon of enhanced dissolution can be related to decrease drug crystallinity and size and the polymer wetting effect. In fact, CG absorbs water quickly and a very small amount of aqueous fluid is enough to cause swelling, gelling, and dissolving of nanoparticles whereas nanoparticles based on chitosan need more volume of water. These different properties can affect the in vivo performance where in nanoparticles administered nasally can absorb water only from the mucus present on the nasal mucosa and/or from mucosa cells. Mucus secretion consists of about 95% water and is about 5-µm thick (Gavini et al., Citation2011; Genta et al., Citation2003).
The objective of the present research work was to investigate the potential use of CG-NPs for enhancing the brain delivery of RAS and the utility of the intranasal (i.n.) nose to brain route for preferential improved delivery of CNS drugs to the brain in comparison with intravenous (i.v.) route. RAS CG-NPs were developed and characterized for various physico-chemical characteristics to determine their suitability for nose to brain delivery. The present work also evaluated the ability of RAS solution and RAS CG-NPs to be distributed to brain regions and blood, together with the estimation of pharmacokinetic parameters of RAS solution and RAS CG-NPs in these areas of the body. The measurement of brain targeting efficiency, and direct nose to brain transport were determined after administration of RAS CG-NPs i.n. and RAS solution i.n. and i.v.
Materials and methods
Drug and reagents
The drug RAS was procured from Sigma–Aldrich, St. Louis, MO. Low molecular weight CG (20–300 cps, ≥85% deacetylated) was purchased from Sigma Aldrich (Sigma-Aldrich, St. Louis, MO). Sodium Tripolyphosphate (STPP) was purchased from CDH Laboratories (New Delhi, India). Glacial acetic acid was purchased from IOL Chemical Ltd. (Mumbai, India). Methanol HPLC grade, Acetonitrile HPLC grade, Potassium dihydrogen phosphate, sodium hydroxide (NaOH) and HPLC grade Water were procured from S.D. Fine Chemicals, Ltd. (Mumbai, India). All chemicals were of analytical grade.
Preparation RAS-loaded CG-NPs
The CGNPs were prepared by ionic gelation of CG with sodium anions (STPP) (Calvo et al., Citation1997). CG solution (0.05%, 0.15%, 0.25% w/v; 10 ml) in 2% v/v glacial acetic acid were prepared. To the CG solution was added drop wise 2 ml aqueous solution of RAS (containing 0.05%, 0.15%, 0.25% w/v) under stirring at 500 rpm for 24 h. Then aqueous STPP solution (0.1, 0.2, 0.3% v/v) was added drop wise (4 ml) to the above solution under stirring at 500 rpm at room temperature. The stirring was continued for 30 min (Sofia et al., Citation2008). The obtained nanoparticles suspension was centrifuged at 10 000 × g for 1 h using centrifuge at 5 °C. The supernatant was discarded after determining the entrapment efficiency. The nanoparticles were washed twice with distilled water and finally freeze dried to obtain the nanoparticles (Fan et al., Citation2012).
Optimization of RAS-loaded chitosan glutamate nanoparticles
A Box–Behnken statistical design with 3 factors, 3 levels, and 17 runs was selected for the optimization study using Design- Expert Software (Design-Expert 8.0.7.1). This design is suitable for exploring quadratic response surfaces and constructing polynomial models. The independent and dependent variables are listed in . The polynomial equation generated by this experimental design is as follows.
Table 1. Variables and their constraints in the Box–Behnken design.
Where “Response” is measured in association with each factor level combination; C0 is an intercept; C1 to C9 are regression coefficients estimated from the observed experimental values of “Responses”; and A, B and C are the coded levels of independent variables. The terms AB, AC or BC and A2, B2 or C2 represent the interaction and quadratic terms, respectively. The independent variables chosen, together with their low (−1), medium (0) and high levels (+1) are shown in . For each factor, the experimental range was selected on the basis of the results of initial trials. The value range of the independent variables used to prepare the 17 formulations was 0.05–0.25% for CG quantity (A), 0.1–0.3% for TPP quantity (B) and 0.05–0.25 for quantity of drug (C). The respective observed responses are given in . This design evaluates the main effects, interaction effects and quadratic effects of the ingredients on the formulation characteristics. All the 17 batches proposed by the experimental design yielded NPs, and were evaluated for particle size, polydispersity index (PDI) and entrapment efficiency. The prediction error was determined for the design from the data of the dependent factors yielded from the experimental and predicted values (Chopra et al., Citation2007).
Table 2. Box–Behnken experimental design data for RAS nanoparticles (n = 3 ± SD).
Physicochemical characterization of nanoparticles
The particle size, particle size distribution, PDI and zeta potential of all optimized NPs were determined by photon correlation spectroscopy using a Zetasizer 200 Nano ZS (Malvern Instruments, Worcestershire, UK). The measurements were performed at a fixed angle of 90° and room temperature of 25 °C using Helium–neon gas laser (intensity of 4 mW) was the light source at 633 nm. The prepared NPs were dispersed into distilled water to form nanosuspension sample. The prepared nanosuspension was also characterized by TEM. A drop of nanosuspension was placed on a paraffin sheet and carbon coated grid was placed on sample and left for 1 min to allow CG-NPs to adhere on the carbon substrate. The remaining suspension was removed by adsorbing the drop with the corner of a piece of filter paper. Then the grid was placed on a drop of phosphotungstate for 10 s. The remaining solution was removed by absorbing the liquid with a piece of filter paper and the sample was air dried. The sample was examined by TEM (Morgagni 268D TEM, Massachusetts, USA).
Differential scanning calorimetry
DSC analysis of pure RAS, CS, physical mixture (CS + RAS) and freeze dried RAS-loaded CS NPs were carried out using PerkinElmer® DSC 7, USA, calibrated with indium. Sample (5 mg) was placed onto a standard aluminum pan, crimped and heated from 40 to 350 °C at a constant rate of 10 °C per min under continuous purging of nitrogen (20 ml/min). An empty sealed pan was used as reference.
Determination of entrapment efficiencies and drug loading
The suspension of nanoparticles was centrifuged at 10 000 × g for 1 h. The supernatant of formulation after centrifugation were taken as such without further processing and filtered through 0.45-µm filter, and determined by UV spectrophotometer at 263 nm. The percentage drug entrapment efficiency was determined using the following equation.
The CS NPs in the form of pellets were separated from the solution by ultracentrifugation at 10 000 × g for 1 h and weighed. The percentage drug loading was determined using following equation.
In vitro release study
The in vitro release profile of RAS from CG-RAS NPs and RAS solution was performed using dialysis sacs. Nanoparticles suspension and RAS solution equivalent to 1 mg of the drug was transferred in pre-treated dialysis bag. The bag was suspended in 100 mL of phosphate buffer (pH 7.4) at 37 °C ± 0.5 °C on magnetic stirrer at 100 rpm. At predetermined time intervals, aliquots were withdrawn from the release medium and replaced with same amount of phosphate buffer. Amount of drug was quantified by the UV spectrometer at 263 nm. In each experiment, the samples were analyzed in triplicate. A graph of cumulative percentage drug release against time was plotted. The data obtained from in vitro drug release studies was fitted to various release models like zero-order, first-order, Higuchi, and Korsemeyer–Peppas model to understand the mechanism of drug release from the NPs (Dash et al., Citation2010).
Ex vivo permeation studies
Fresh nasal mucosa was carefully removed from the nasal cavity of goat. Transmucosal permeation kinetics of RAS was examined using goat nasal mucosa mounted onto static vertical Franz diffusion cells displaying a permeation area of 0.632 cm2. On experimental day nasal mucosa (treated with isopropyl alcohol to remove adhering mucous and fat) was cut to appropriate size and mounted between the donor and receptor compartments of the Franz diffusion cell, with the mucosal side facing the donor compartment, and the receptor compartment was filled with phosphate buffer (pH 7.4) and magnetically stirred at 200 rpm. To ensure oxygenation and agitation, a mixture of 95% O2 and 5% CO2 was bubbled through the system. The diffusion cell was thermostated at 37 ± 0.5 °C. RAS-loaded CG-NPs (equivalent to 10 mg of RAS) and pure drug solution (10 mg) were dissolved in 1 ml of phosphate buffer (pH 7.4) and placed in the donor compartment, respectively. Aliquot (2 ml) were withdrawn from the receptor chamber at designated time intervals (0.08, 0.25, 0.5, 1, 2, 4, 8, 12, and 24 h) and replaced immediately with the same volume of fresh media of phosphate buffer pH 7.4 after each sampling maintained at 37 ± 0.5 °C. The samples withdrawn were filtered using 0.45-µm membrane filter and the amount of drug in the receptor media was analyzed using validated UV–VIS spectrophotometer at 263 nm (Haque et al., Citation2012).
In vivo study
Animal experiments were conducted with prior approval from institutional animal ethics committee, Jamia Hamdard (Protocol no: 901) and their guidelines for animal handling were followed. Swiss albino mice (male, aged 4–5 months), weighing between 20 and 40 g, were selected for the study.
The mice were housed six per cage at 20–25 °C with free access to food and water with a 12 h light–dark cycle. The mice were divided in to three groups. Group 1 received control RAS solution (i.n.) at the dose of 0.00189 mg/day dissolved in 10 µl of normal saline solution (5 μL in each nostril) with the help of micropipette attached with low-density polyethylene tubing, having at the delivery site, group 2 received RAS-loaded CG-NPs (i.n.) at the dose of 0.00189 mg/day dissolved in 10 µl of normal saline solution and group 3 received RAS-loaded CG-NPs (i.v.) through tail vein at the dose of 0.00189 mg/day dissolved in 100 µl of normal saline solution. The mice were anesthetized at different time intervals (15, 30, 60, 120, and 240 min, after administration of dose by different routes) by giving the sufficient dose of diethyl ether by inhalational route to collect blood from cardiac puncture in precoated EDTA tubes. Subsequently, brain was dissected, washed twice with normal saline to remove adhering tissue/fluid, and weighed. The brain was weighed and an aliquot of (1:10) of ice-cold saline solution was added and then brain was crushed with homogenizer on ice. An aliquot of brain homogenates (100–500 µl) was extracted with acetonitrile (liquid–liquid extraction) and vortexed for 1 min. After centrifugation (4 °C, 1000 × g, 20 min), the supernatant was separated and transferred to another tube and evaporated to dryness at 40 °C under a gentle stream of nitrogen in the evaporator. The residue was dissolved in 200 µl of the mobile phase and vortex-mixed for 1 min. A 20 µl aliquot of the reconstituted extract was injected on to the HPLC system for analysis. The concentrations of RAS in blood, and brain tissues were analyzed by validated HPLC method (Lakshmi & Rao, 2010). Plasma concentration–time profiles of RAS after i.v. and i.n. delivery were evaluated by pharmacokinetic software (PK Functions for Microsoft Excel, Pharsight Corporation, Mountain View, CA). Then after drug targeting efficiency (DTE %) and direct nose to brain drug transport (DTP %) were calculated. The maximum plasma concentration of RAS (Cmax) and the time required to reach the maximum concentration (Tmax) were obtained directly from the actual plasma profiles (Mustafa et al. 2012). The area under the curve between 0 and 120 min was calculated by the linear trapezoidal method. Brain targeting efficiency was calculated using two equations mentioned below (Kumar et al., Citation2008).
DTE % that represents time average partitioning ratio was calculated as follows:
DTP % was calculated as follows:
where Bx = (Bi.v./Pi.v.) × Pi.n., Bx is the brain AUC fraction contributed by systemic circulation through the BBB following intranasal administration.
Bi.v is the AUC0–240 (brain) following intravenous administration.
Pi.v. is the AUC0–240 (blood) following intravenous administration.
Bi.n is the AUC0–240 (brain) following intranasal administration.
Pi.n. is the AUC0–240 (blood) following intranasal administration (Zhang et al., Citation2004).
Statistical analysis
All statistical analysis was carried out using Graph pad prism 3.0 (Graph pad software, San Diego, CA). All data are reported as mean ± SD. Groups of data were compared with the analysis of variance (ANOVA) followed by Dunnett’s t-test. The values were considered statistically significant, at p < 0.05.
Results and discussion
Preparation and optimization of RAS-loaded chitosan glutamate NPs
The nanoparticles were prepared as per the procedure given in section “Optimization of RAS-loaded chitosan glutamate nanoparticles”. All the 17 batches proposed by the experimental design yielded nanoparticles, and were evaluated for particle size, PDI, entrapment efficiency (EE). The data obtained for the experimental design are displayed in . The numerical optimization method was employed for optimization of the nanoparticulate system. The optimized formula was determined after studying the effects of the independent variables on the responses. The criteria followed for generating the optimized formula were based on selecting the individual variables and defining their goal and limits. gives the optimization constraints selected for each variable. After defining the constraints for each variable, the Design Expert Software automatically generated the optimized formula. gives the optimized formula generated by Design Expert Software showing the predicted and experimental values obtained. The experimental values were obtained by preparing the nanoparticles using the optimized formula suggested by the software. It was observed that the percentage prediction error was very low which indicated the accuracy of prediction by the software and the utility of the experimental design for tailoring the nanoparticles with desired parameters. The three-dimensional (3D) response surface graphs for the significant variables on the evaluated parameters which are valuable to study the interaction effects of the factors on the responses are shown in . The fitting results indicated that the optimized NPs with high EE, small mean particles size and PDI was obtained at the RAS concentration of 0.15%, CS concentration of 0.15% and TPP concentration of 0.2%, respectively.
Figure 1. Effect of independent variables on (a) particle size (PS), (b) PDI and (c) entrapment efficiency (EE).
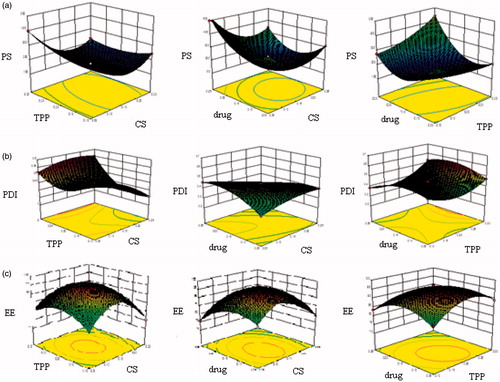
Table 3. Predicted and experimental values obtained based on optimized formula generated by Design Expert Software (n = 3 ± SD).
Characterization and evaluation of the optimized RAS-loaded chitosan glutamate NPs
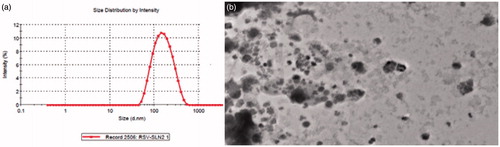
The mean particle size of RAS-loaded nanoparticles was 151.1 ± 10.31 the PDI was found to be 0.380 ± 0.01 as shown in . The optimized NPs were in the nanometric size range with low PDI. Entrapment efficiency and drug loading were satisfactory for the optimized nanoparticles. The morphological characteristics and particles size of the RAS-loaded nanoparticles were imaged using the TEM (). The pictures show that the RAS-loaded nanoparticles were spherical in shape, and the average size was about 135–141 nm. The amount of RAS entrapped in nanoparticles is shown in . The EE of the formulations tested in this study was 96.43 ± 4.23%, and the drug loading was found to be 64.26 ± 2.42.
Figure 2. Particle size distribution of optimized RAS-loaded nanoparticles (a) PCS (b) TEM.
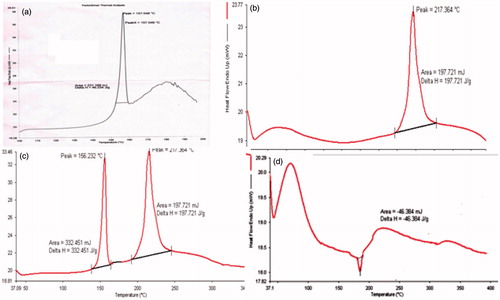
DSC thermograms of polymer, RAS, physical mixture and RAS-loaded freeze dried CG nanoparticles are shown in , respectively. Drug showed endothermic peak at 156.23 °C, polymer showed endothermic peak at 217.364 °C and physical mixture showed both peak of drug as well as polymer. Thus, diminished peak at about 180 °C exhibited by RAS in the RAS-loaded NPs, indicating that small amount of drug adsorbed on the surface of nanoparticles and maximum was encapsulated by the polymer in the NPs (Joshi et al., Citation2010) and the characteristic peak of the drug has almost disappeared as it is anticipated that the crystalline form have transformed in to amorphous form.
Figure 3. DSC thermogram of (a) RAS, (b) chitosan glutamate (CG), (c) physical mixture of drug and polymer (1:1) and (d) RAS-loaded CG-NPs.
In vitro drug release study
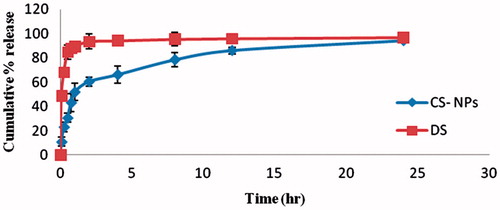
In vitro release studies of RAS from nanoparticles and solution were carried out in phosphate buffer (pH 7.4) and showed that the CG nanoparticles exhibited an initial burst release of RAS in a period of 1 h, which was in the range of 10.85 ± 3.643 – 51.92 ± 6.851% (). This initial rapid release, characterized as “burst effect”, is due to the fact that some amounts of RAS were localized on the surface of nanoparticles by adsorption which could be released easily by diffusion. After this initial burst effect, a slower sustained and controlled release occurred throughout the period and the release amount is in the range of 60.48–94.28% (Aydin & Pulat, Citation2012). The observed result of RAS nanoparticles were compared with the drug solution and it has been found that burst release from the drug solution within 1 h (89.53 ± 3.17) and later on there was a constant release instead of sustained release from formulated nanoparticle as shown in . Data obtained from the in vitro release studies were fitted to various kinetic equations such as zero order, first order, Higuchi model and Peppas model. The optimum model was selected based on the correlation coefficient value (r2) of various models. The r2 values for RAS-loaded CG nanoparticles was highest for first-order release model best from the above three models. The Korsmeyer–Peppas equation was also used to determine the mechanism of drug release. When the release data were analyzed using the Korsmeyer–Peppas equation, the value of release exponent n was 0.23 indicating that the drug release from CG-NPs was by the Fickian diffusion mechanism.
Figure 4. In vitro release profile of RAS-loaded CG-NPs and RAS solution (n = 3 ± SD).
Ex vivo studies on nasal mucosa of animal
The ex vivo permeation studies through goat nasal mucosa were performed for both the RAS-loaded chitosan NPs and RAS solution, and showed more permeation from RAS-loaded CG nanoparticles as compared to the pure drug solution, due to the permeation enhancing activity of CG. The cumulative amount of drug permeated (CADP) per cm2 was found to be 12.5 ± 0.053 and 4.69 ± 0.059 µg/cm2 after 24 h from RAS CGNPs and RAS solution, respectively. The steady-state flux and permeability coefficient of drug solution through the nasal mucosa was 0.2153 ± 0.002 µg cm−2h−1 and 1.0 × 10⁻² cm−2h−1, respectively, whereas steady-state flux and permeability coefficient of drug-loaded chitosan nanoparticles was 0.5684 ± 0.009 µg cm−2h−1 and 2.8 × 10⁻³ cm−2h−1, respectively. CGNPs enhanced the cumulative amount of drug permeated by almost three times as compared to RAS solution. This increase in the permeation of RAS could be attributed to an interaction of a positively charged amino group on the C-2 position of chitosan with negatively charged sites on the cell membranes and tight junctions of the mucosal epithelial cells to allow opening of the tight junctions. It has been demonstrated that chitosan when applied to confluent cell cultures, is able to transiently open the tight junctions between the cells (Artursson & Lindmark, Citation1994; Dyer & Hinchcliffe, Citation2002). This effect is maximal when chitosan is fully protonated (i.e. in acidic condition); however, literature reports that even at pH 6.4, 25% of the amino groups still remain protonated to interact with negatively charge sialic acid residue in the mucosa (Chenite et al., Citation2006). That is why the cumulative percentage of drug permeated through nasal mucosa from RAS-loaded NPs was 62.25 ± 0.41 where as 23.45 ± 0.38 from drug solution. Another reason for lesser permeation through pure drug solution may be the hydrophilic nature of drug.
In vivo study
Plasma concentration time profiles of RAS after i.v. and i.n. delivery were evaluated by pharmacokinectic software (PK Functions for Microsoft Excel, Pharsight Corporation, Mountain View, CA). Various pharmacokinectic parameters were calculated and represented in the . Brain and blood RAS level studies following RAS CGNPs (i.v.), RAS CGNPs (i.n.) and RAS (i.n.) at different time intervals up to 4 h in mice is shown in and . The RAS concentrations in brain following the i.n. of CG-RAS NPs were found to be significantly higher at all the time points compared to both RAS (i.n.) and RAS CGNPs (i.v.) (maximum concentration was 992.25 ± 31.17 at 15 min). The RAS concentration in plasma following the i.v. of CG-RAS NPs were found to be significantly higher at all the time points compared to both RAS (i.n.) and RAS CGNPs (i.n.). (maximum concentration was 1840.11 ± 28.12 at 5 min). The brain/blood ratio at different sampling points for all formulations was also calculated and showed in and were found that the RAS CGNPs administered intranasally showed higher brain/blood ratio significantly at all time points compared to both RAS (i.n.) and RAS CGNPs (i.v.). In the first 15 min, the brain/blood ratio of 0.15 ± 0.002, 0.59 ± 0.001 and 1.91 ± 0.004 of CG-RAS NPs (i.n.), RAS (i.n.) and RAS CGNPs (i.n.), respectively, are indicative of the direct nose to brain transport bypassing the BBB, hence proving the superiority of nose to brain delivery of RAS by CG-NPs (Kumar et al., Citation2008). shows the calculated pharmacokinetic parameters for the RAS CGNPs (i.v), RAS (i.n) and RAS CGNPs (i.n). The peak plasma concentrations of RAS in blood after RAS CG-NPs (i.v.), RAS (i.n.) and RAS CG-NPs were found to be 1840.11 ± 28.12, 892.56 ± 35.42 and 702.76 ± 28.33 ng/ml with tmax of 5, 15 and 60 min, respectively, and the peak plasma concentrations of RAS in brain after RAS CG-NPs (i.v.), RAS (i.n.) and RAS CG-NPs were found to be 346.74 ± 19.68, 634.23 ± 34.93 and 999.25 ± 31.17 ng/ml with tmax of 30, 30 and 15 min, respectively (). The lower tmax values for brain (15 min) when compared to blood (60 min) may also be attributed to preferential nose to brain transport following i.n. administration of RAS CG-NPs. When the Cmax and AUC of brain concentration of the RAS CG-NPs (i.v), RSA (i.n) and RAS CG-NPs (i.n) were compared, the Cmax (999.25 ng/ml) and AUC (2086.60 ng. h/ml) of RAS CG-NPs (i.n) were found to be significantly higher than RAS CG-NPs (i.v.) and RAS (i.n.). The nasal administration of RAS CG-NPs significantly enhanced the RAS concentration in brain tissue when compared with same dose by RAS (i.n.) or RAS CG-NPs (i.v.). The possible reason could be the contribution of CG-NPs not only open the tight junctions between the cells but also decrease the mucociliary clearance, which under normal circumstances rapidly clears the instilled formulation (Artursson & Lindmark, Citation1994; Dyer & Hinchcliffe, Citation2002).
Figure 5. The mean (A) brain and (B) blood concentration–time graph of RAS in mice at different time intervals following RAS solution (i.n.), RAS-loaded CG-NPs (i.n.) and RAS-loaded CG-NPs (i.v.) administrations (n = 3 ± SD).
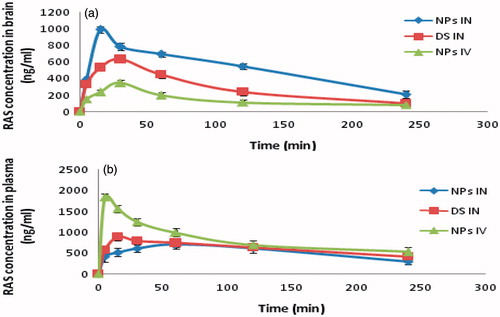
Figure 6. Brain–blood ratio at different time interval by RAS CG-NPs (i.n.), RAS CG-NPs (i.v.) and RAS solution (i.n.) in mice (n = 3 ± SD).
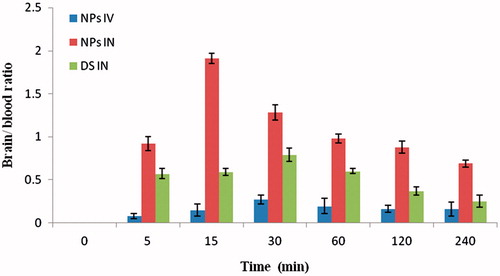
Table 4. Distribution of RAS CG-NPs (i.v), RAS solution (i.n), RAS CG-NPs (i.n) at different time interval in mice (n = 3 ± SD).
Table 5. Pharamacokinetic parameters of RAS formulation after i.n. and i.v. administration in mice at the dose of 0.00189 mg/day in brain and blood (n = 3, ±SD).
The three important parameters DTI, DTE% and DTP% representing the percentage of drug directly transported to the brain via the olfactory pathway were calculated. The DTI values for RAS-loaded CG-NPs and RAS solution were 3.25 ± 0.4 and 1.49 ± 0.2, respectively. The high value of DTI (>1) confirms the direct pathway from nose to brain (Wang et al., Citation2008). The DTP% values of RAS-loaded CS NPs (i.n.) as compared to RAS solution (i.n.) increases from 66.27 ± 1.8 to 69.27 ± 2.1%. It is observed that brain uptake for RAS-loaded CG-NPs was significantly increased as compared to RAS solution following i.n. administration, thus showing the benefit of mucoadhesive NPs formulation. The comparative bioavailability of RAS solution and RAS-loaded CG-NPs in blood and brain was found to be 104.81 ± 7.91 (blood), 157.46 ± 9.62 (brain) and 96.21 ± 6.53 (blood) and 313.13 ±15.45 (brain), respectively, as compared to i.v. administration. The results showed significant enhancement of bioavailability in brain, after administration of the RAS-loaded CG-NPs was observed which could be a substantial achievement of direct nose to brain targeting in PD therapy (Md et al., 2012).
Conclusion
RAS-loaded CG nanoparticles (CG-NPs) were successfully formulated. In vivo biodistribution studies in mice indicated the superiority of the developed nanoparticles for brain targeting when compared with the results of the intravenous and nasal solutions of the drug. In vitro release studies indicated the better release profiles of the developed nanoparticles as compared to the results of the nasal in-situ gel delivery as reported by Ravi et al. (Citation2013). On the basis of these research findings, it was concluded that RAS-CG-NPs could be a promising delivery system for treatment of PD via intranasal administration. The study, however, still requires further pre-clinical and clinical studies to evaluate its efficacy in human on the basis of risk/benefit ratio.
Declaration of interest
This research work is original and all authors report no conflicts of interest. The authors are grateful to University Grants Commission (UGC), New Delhi for providing financial assistance.
References
- Artursson P, Lindmark T. (1994). Effect of chitosan on the permeability of monolayers of intestinal epithelial cells (Caco-2). Pharm Res 11:1358–61
- Aydin RST, Pulat M. (2012). 5-Fluorouracil encapsulated chitosan nanoparticles for ph-stimulated drug delivery: evaluation of controlled release kinetics. J Nanomater 12:144–56
- Calvo P, Remunan-Lopez C, Vila-Jato JL, Alonso MJ. (1997). Novel Hydrophilic chitosan–polyethylene oxide nanoparticles as protein carriers. J Appl Polym Sci 63:125–32
- Chenite A, Gori S, Shive M, et al. (2006). Monolithic gelation of chitosan solutions via enzymatic hydrolysis of urea. Carbo Polym 64:419–24
- Chopra S, Patil GV, Motwani SK. (2007). Release modulating hydrophilic matrix systems of losartan potassium: Optimization of formulation using statistical experimental design. Eur J Pharm Biopharm 66:73–82
- Dash S, Murthy PN, Nath L, Chowdhury P. (2010). Kinetic modeling on drug release from controlled drug delivery systems. Acta Pol Pharm 67:217–23
- Davis SS. (1997). Biomedical applications of nanotechnology – implications for drug targeting and gene therapy. Trends Biotechnol 15:217–24
- Dhuria SV, Hanson LR, Frey WH. (2010). Intranasal delivery to the central nervous system: mechanism and experimental consideration. J Pharm Sci 99:1654–73
- Dyer AM, Hinchcliff M. (2002). Nasal delivery of insulin using novel chitosan based formulations: a comparative study in two animal models between simple chitosan formulations and chitosan NPs. Pharm Res 19:998–1008
- Fan W, Yan W, Xu Z, Ni H. (2012). Formation mechanism of monodisperse, low molecular weight chitosan nanoparticles by ionic gelation technique. Colloids Surf B: Biointer 90:21–7
- Fernández M, Negro S, Slowing K, et al. (2011). An effective novel delivery strategy of RAS for Parkinson’s disease. Int J Pharm 419:271–80
- Gallagher DA, Schrag A. (2008). Impact of newer pharmacological treatments on quality of life in patients with Parkinson's disease. CNS Drugs 22:563–86
- Gavini E, Rassu G, Ferraro L, et al. (2011). Influence of glutamate on the in vivo intranasal absorption of rokitamycin from microspheres. J Pharm Sci 100:1488–502
- Genta I, Perugini P, Modena T, et al. (2003). Myconazole-loaded 6-oxychitin-chitosan microcapsules. Carbo Polym 52:11–18
- Haque S, Shadab M, Fazil M, et al. (2012). Venlafaxine loaded chitosan NPs for brain targeting, Pharmacokinetic and pharmacodynamic evaluation. Carbo Polym 89:72–9
- Illum L. (2000). Transport of drugs from the nasal cavity to central nervous system. Eur J Pharm Sci 11:1–18
- Joshi SA, Chavhan SS, Sawant KK. (2010). Rivastigmine-loaded PLGA and PBCA NPs: preparation, optimization, characterization, in vitro and pharmacodynamic studies. Eur J Pharm Biopharm 76:189–99
- Kumar M, Misra A, Babbar AK, et al. (2008). Intranasal nanoemulsion based brain targeting drug delivery system of risperidone. Int J Pharm 358:285–91
- Lakshmi MV, Rao S, Rao AL. (2010). Development and validation of RP-HPLC method for the estimation of RAS tablet dosage forms. Rasayan J Chem 3:621–4
- Md S, Khan RA, Mustafa G, et al. (2013). Bromocriptine loaded chitosan nanoparticles intended for direct nose to brain delivery: Pharmacodynamic, Pharmacokinetic and Scintigraphy study in mice model. Eur J Pharm Sci 48:393–405
- Mittal D, Ali A, Md S, et al. (2013). Insights in to direct nose to brain delivery: current status and future perspective. Drug Deliv 21:75–86
- Mustafa G, Baboota S, Ali J, Ahuja A. (2012). Formulation development of chitosan coated intranasal ropinirole nanoemulsion for better management option of Parkinson: an in vitro-ex vivo evaluation. Curr Nanosci 8:348–60
- Nussbaum RL, Ellis C. (2003). Alzheimer’s disease and Parkinson’s disease. N Engl Med 348:1356–64
- Parkinson Study Group. (2005). A randomized placebo-controlled trial of rasagiline in levodopa-treated patients with Parkinson disease and motor fluctuations: the PRESTO study. Arch Neurol 62:241–8
- Pires A, Fortuna A, Alves G, Falcao A. (2009). Intranasal drug delivery: how, why and what for. J Pharm Sci 12:288–311
- Ravi PR, Aditya N, Patil S, Cherian L. (2013). Nasal in-situ gels for delivery of rasagiline mesylate: improvement in bioavailability and brain localization. Drug Deliv 51:1–7
- Schapira AHV. (2005). Present and future drug treatment for Parkinson’s disease. J Neurol Neurosurg Psychiatr 76:1472–8
- Sofia P, Dimitrios B, Konstantinos A, et al. (2008). Chitosan nanoparticles loaded with dorzolamide and pramipexole. Carbo Polym 73:44–54
- Taylor JP, Hardy J, Fischbeck KH. (2002). Toxic proteins in neurodegenerative disease. Science 296:1991–5
- Wang X, Chi N, Tang X. (2008). Preparation of estradiol chitosan nanoparticles for improving nasal absorption and brain targeting. Eur J Pharm and Biopharm 70:735–40
- Wen Z, Yan Z, Hu K, et al. (2011). Odorranalectin-conjugated nanoparticles: preparation, brain delivery and pharmacodynamic study on Parkinson’s disease following intranasal administration. J Control Release 151:131–8
- Zhang Q, Jiang X, Jiang W, et al. (2004). Preparation of nimodipine loaded microemulsion for intranasal delivery and evaluation of the targeting efficiency to brain. Int J Pharm 275:85–96