
Abstract
The aim of the present study was to formulate and evaluate in situ gelling syringeable nanoemulgels (NEGs) of ketoprofen for periodontal delivery. Application of 3-factor 3-level design was employed using the Box–Behnken experimental design for the optimization of nanoemulsion using three independent variables such as percent concentration (v/v) of oil (X1), Smix (mixture of surfactant and cosurfactant) (X2) and water (X3); while the particle size (nm) (Y1), polydispersity index (Y2) and zeta potential (mV) (Y3) were used as dependent variables. The NEG was evaluated based on their drug content, pH measurement, mucoadhesion on the goat buccal mucosa, syringeability and inverted sol-gel transition temperature. The drug release data were analyzed for curve fitting based on the Korsmeyer–Peppas law, and the n-values of optimized A5 and A8 formulations were found 0.3721 and 0.3932, respectively, confirmed that both the formulations followed pseudo Fickian diffusion (n < 0.43). The formulation A8 with the optimal drug release was identified as the best NEG formulation. Results of rheological, mucoadhesion and syringeability studies showed the suitability of desired sol-gel property for periodontal drug delivery. The Herschel–Bulkley model was the best fit model to explain the flow behavior of optimized formulation. Using the HET-CAM method, significantly lower in vitro toxicity was indicated the suitability of developed NEG for intra-pocket delivery.
Introduction
The word periodontal literally means “around the tooth”. Periodontal disease is a chronic bacterial infection that affects the gums and bone supporting the teeth. Bacteria in plaque causes the gums to become inflamed and separate them from the teeth, forming pockets and as the disease progresses, the pockets deepen and more gum tissue and bone are destroyed. In present day world while 75% of the adult population experience at least mild periodontal disease (gingivitis), 20–30% exhibits a severe destructive form of chronic periodontitis (Javed & Kohli, Citation2010). The periodontal pathogen produces harmful by product and enzymes that break extracellular matrices as well as host cell membranes to produce nutrients for their growth. In doing so, they initiate damage directly or indirectly by triggering host-mediated responses that lead to self injury (Vyas et al., Citation2000).
Ketoprofen (KP), a congener of the 2-arylpropionic acid class of non-steroidal anti-inflammatory drugs (NSAIDs), has been shown to have therapeutic value in the treatment of periodontal disease via inhibition of the cyclooxegenase enzyme, which is responsible for the biosynthesis of prostaglandins (Offenbacher et al., Citation1990). Over the past several years there has been increasing interest in the use of non-steroidal anti-inflammatory agents to prevent or control periodontal disease (Howell et al., 1993; Pauletto et al., Citation1997). Topical applications of (S)-KP reduce bone loss in the ligature model of periodontitis in beagles and in primates (Li et al., Citation1996; Paquette et al., Citation1997). An initial 6-month preclinical pharmacology study demonstrated significant reductions in crevicular fluid prostaglandin E2 and leukotriene B4 in the monkeys treated for ligature-induced periodontal bone loss with a 1.0% (w/w) KP cream formulation (Li et al., Citation1996) and later on, the pharmacokinetics and safety of the NSAID, KP, in gel formulations were evaluated (Lawrence et al., Citation1998). A local drug delivery system containing 1.5% KP gel was used in conjunction with scaling and root planning in order to assess periodontal outcomes in subjects with chronic periodontitis (Srinivas et al., Citation2011). Non-steroidal anti-inflammatory agents (e.g. KP) used topically appear to be effective in reducing bone loss in the ligature model of periodontitis (Bowen et al., Citation2000).
Eugenol, the principal chemical component of clove oil from Eugenia aromatica has been long known for its analgesic, local anesthetic, anti-inflammatory and anti-bacterial effects. It is used in the form of a paste or mixture as dental cement, filler and restorative material. It belongs to the class of essential oils that is generally regarded as safe by the Food and Drug Administration. It is a known antibacterial agent against pathogens including Escherichia coli O157:H7, Listeria monocytogenes (Blaszyk & Holley, Citation1998), Helicobacter pylori (Friedman et al., Citation2002; Walsh et al., 2003) and is reported to act primarily by disrupting the cytoplasmic membrane (Gill & Holley, Citation2006).
Nanoemulsion will be a potential carrier to carry NSAID drug KP. Nanoemulsion is a pharmacokinetically stable liquid solution, usually with a droplet diameter within the range of 10–100 nm. Nanoemulsion have several advantages, including enhanced drug solubility, easily penetrate to periodontal mucosa, reduction of dose amount and reduce the side effect of dose as compared to conventional formulations. In this nanodroplet fuse outer membrane of microbes and surfactant disrupt microbes, killing the microorganism. Nanoemulsion has a broad spectrum activity against bacteria, e.g. Escherichia coli, Salmonella typhae and Staphylococcus aureus (Hamouda et al., Citation1999; Lee et al., Citation2010). Due to selective toxicity to the microbes in concentration and non-irritant to mucous membranes, nanoemulsion is safe for periodontal treatment because of the low level of detergent in nanoemulsion formulation. So eugenol has been selected as oil phase in the development of nanoemulsion.
The clinical efficacy of such treatments depends intrinsically on the drug release and mechanical properties of the formulation. Thus, ideal formulations should be easily inserted into the periodontal pocket, show controlled release of the drug into the crevicular fluid, exhibit retention within the pocket for the desired period of time (without the aid of mechanical bonding to tooth surfaces), be biodegradable, non-toxic and non-irritant. Carbopol 934P (CP 934P) and Polaxamer 407 (P407) have been selected for periodontal delivery. CP 934P interaction with the mucin-coated epithelial and tooth surfaces by means of specific interfacial forces in a process commonly referred as mucoadhesion, a special case of bioadhesion (Jones et al., Citation1996; Bruschi et al., Citation2007). Thermorevesible and in situ gelling system, consider a technical approach to deliver NSAID drugs directly into the pocket for controlled/sustained release. This delivery system not only helpful in sustaining the effective delivery of NSAID, but also avoid first pass metabolism and dose related side effects.
This study, therefore, describes the development and characterization of nanoemulgel (NEG) loaded with KP, designed for application to periodontal pocket for the treatment of periodontitis. The NEGs loaded with KP were evaluated for various technical parameters like pH, gelling capacity, mucoadhesion, syringeability, in vitro drug release, rheological studies and irritancy studies.
Materials and methods
KP was received as a gift sample from Matrix Laboratories Ltd., Hyderabad, India, and certified to contain (99.81% purity). Labrasol (caprylo caproyl macrogol-8-glyceride), Labrafac (propylene glycol dicaprylocaprylate), Transcutol HP (diethylene glycol monoethyl ether) were received as a gift sample by Gattefosse (Saint Priest, Cedex, France). Cremophor EL (polyethoxylated castor oil) and P407 was obtained as a gift sample from BASF (Mumbai, India), Triacetin (glycerol triacetate), Tween 80 (polyoxyethylene sorbitan monooleate), Tween 20 (polyoxyethylene sorbitan monolaurate) and PEG (Polyethylene glycol) 400 were purchased from Merck (Schuchardh, Hokenbrunn, Germany). CP 934P and triethanolamine (TEA) were obtained from Central Drug House Pvt. Ltd (New Delhi, India). Eugenol was purchased from Arora and Company (New Delhi, India). Methylparaben and Propylparaben were obtained from S Merck India Ltd (New Delhi, India). Water was obtained from the Milli-Q-water purification system (Millipore, Billerica, MA, USA).
Screening of oil, surfactant and cosurfactant
Solubility of KP was determined in various components (oils, surfactants and cosurfactants) by adding an excess amount of the drug in 2 ml of the selected vehicle in 5 ml capacity stoppered vials, and mixed using a vortex mixer (Nirmal International, Delhi, India). These vials were then kept at 25 ± 2 °C in an isothermal shaker (Nirmal International) for 72 h to equilibrate (shake flask method). The equilibrated samples were centrifuged at 4000 rpm for 15 min (REMI International, Mumbai, India) and supernatants were filtered through syringe membrane filter [0.45 µm (Axiva Sichem Biotech, New Delhi, India)] and were estimated by the developed HPLC method at 254 nm.
Selection of formulations
Different formulations were chosen, from each of the constructed phase diagram, based on the following criteria:
Ten milligrams was chosen as the dose for the development of nanoemulsion as the recommended dose 10–25 mg/d (Li et al., Citation1996; Lawrence et al., Citation1998).
The concentration of oil should be capable of dissolving 10 mg of the drug easily.
For a particular percentage of oil selected, that formula was taken from the phase diagram, which used a minimum concentration of Smix for the formation of nanoemulsion (Bali et al., Citation2010).
Construction of pseudo ternary phase diagrams
On the basis of solubility studies, eugenol was used as the oil phase for the development of nanoemulsion. Cremophore EL, Transcutol® HP and double-distilled water were used as surfactant, cosurfactant and aqueous phase, respectively. Surfactant and cosurfactant were mixed (Smix) in different volume ratios (1:1, 1:2, 2:1, 3:1, 4:1 and 5:1). These Smix ratios were chosen in increasing concentrations of surfactant with respect to cosurfactant and increasing concentration of the cosurfactant with respect to surfactant for detailed study of the phase diagrams. For each phase diagram, oil and specific Smix ratio were mixed well in different volume ratios ranging from 1:9 to 9:1. Sixteen different combinations of oil and Smix, (1:9, 1:8, 1:7, 1:6, 1:5 1:4, 1:3.5, 1:3, 3:7, 1:2, 4:6, 5:5, 6:4, 7:3, 8:2 and 9:1) were made so that maximum ratios could be covered to precisely delineate the boundaries of the phases formed in the phase diagrams. Phase diagrams were developed using an aqueous titration method. Slow titration with aqueous phase was done for each ratio of oil and Smix.
Selection of optimize nanoemulsion formulation using response surface methodology
A 3-factor 3-level Box–Behnken statistical Design Expert software (Version 8.0.7.1, Stat-Ease Inc., Minneapolis, MN) was used in a quest to explore quadratic response surfaces and construct second-order polynomial equations for optimization of the nanoemulsion system. The independent variables selected are shown in along with their low, medium and high levels. Statistical evaluation of main effects, interaction effects and quadratic effects of different independent variables on the particle size, polydispersity index (PDI) and zeta potential was made. A design matrix comprising of 17 experimental runs was constructed (). The nonlinear computer generated quadratic model was given as:
where Y was the measured response associated with each factor level combination; b0 represented an intercept; b1–b33 were the regression coefficients computed from the observed experimental values of Y; and X1, X2 and X3 were the coded levels of independent variables. The terms X1, X2 and X3 were represented the interaction and quadratic terms, respectively (Govender et al., Citation2005; Chopra et al., Citation2007). The statistical validity of the polynomial equations generated by design expert was established on the basis of ANOVA provision in the software. The models were evaluated in terms of statistically significant coefficients and R2 values.
Table 1. Optimisation of nanoemulsion of KP method using response surface methodology.
Table 2. Box–Behnken experimental design for robustness testing using factors and obtained responses.
Physical stability testing of nanoemulsions
Physical stability studies
The physical stability of a lipid-based formulation is also crucial to its performance, which can be adversely affected by precipitation of the drug in the excipients matrix. In addition, poor formulation, physical stability can lead to phase separation of the excipients, affecting not only formulation performance, but visual appearance as well (Shafiq et al., Citation2007).
Centrifugation study
The prepared formulations were centrifuged (REMI International) at 5000 rpm for 30 min and observed for phase separation, creaming or cracking. The formulations which did not show any instability (creaming, cracking, phase separation) were selected and subjected to heat-cooling cycle.
Heating–cooling cycle
It was used to see the effect of variations in temperature on the stability of nanoemulsions. Six cycles between 4 and 40 °C with storage at each temperature for not less than 48 h were performed. The formulations that were found to be stable at these temperatures were subjected to freeze thaw stress test.
Freeze thaw cycle
In this study, the formulations were subjected to three freeze thaw cycles at temperatures between −21 and +25 °C with storage at each temperature for not less than 48 h. The formulations that passed this test were selected for the dispersibility study in order to estimate the efficiency of dispersibility (Bali et al., Citation2010).
Refractive index
Refractive indexes were determined for different nanoemulsion formulations by using Abbe’s refractrometer (Bino Scientific, Ambala, India) at 25 °C. Each sample was repeated three times and standard deviation was calculated.
Particle size and PDI analysis
The average particle size and PDI of the nanoemulsion droplets were determined by photon correlation spectroscopy (Nano ZS90, Malvern Instruments, Worcestershire, UK) which is based on the principle of dynamic light scattering (DLS). In DLS, the sample is illuminated with a laser beam and the intensity of the resulting scattered light produced by the particles fluctuates at a rate that is dependent upon the size of the particles. Analysis of these intensity fluctuations yields the diffusion coefficient of the particles, and hence the particle size. The measurements were performed using a He–Ne laser at 633 nm by using an Avalanche photo diode detector. The cell was used standard and small volume disposable polystyrene cuvette. All measurements were carried out at 25 °C.
Determination of zeta potential
The formulation (0.1 ml) was diluted to 10 ml using double-distilled water and zeta potential was determined using zeta potential measuring instrument, ZC-2000 (Zeecom-2000, Microtec Co. Ltd, Chiba, Japan) equipped with 4.0 mW He–Ne red laser (633 nm) which measures the potential ranged from −120 to 120 V. Nanoemulsion formulation (0.1 ml) was diluted 100 times using double-distilled water and analyzed for the zeta potential measuring instrument. All measurements were carried out at 25 °C. Typically, −30 or +30 mV would be regarded as high zeta potential. Negative values of the zeta potential of the optimized formulations indicated that the formulations were negatively charged and therefore gives indication of stable systems. It should be noted that a comparison of the zeta potential with the particle size results in general, showed that a decrease in a particle size of emulsion was accompanied by a decrease in negative surface charge values.
TEM analysis
Transmission electron microscopic (TEM) analysis was done to determine the shape of the dispersed phase. A drop of diluted nanoemulsion was applied to a 300 mesh copper grid and left for 1 min. Then the grid was kept inverted and a drop of phosphotungstic acid (PTA) was applied to the grid for 10 s. Excess of PTA was removed by absorbing on a filter paper and the grid was analyzed using the Morgagni 268D (FEI Company, Hillsboro, USA) operated at 60–80 kV at 1550× magnification.
Preparation of NEG of KP
Preparations of P407 and CP 934 P combination gel were made according to Bruschi et al. (Citation2007). CP934P (0.25%, 0.50% and 1% w/w) was initially dissolved in distilled water using a mechanical stirrer. Following complete dissolution, P407 (15%, 20% and 25%, w/w) was added to this gel and the mixture was stored at 4 °C for 12 h to ensure complete wetting (cold method). The formulations were then stirred, to ensure complete mixing of the two components, then optimized nanoemulsion with KP was added drop wise to the sol system with continues magnetic stirring and finally neutralized with TEA and stored at 4 °C for 24 h ().
Drug content
Weighed amount of formulations was assayed to determine the drug content. The accurately weighed quantity of KP-loaded NEG samples equivalent to 10 mg of drug was dissolved in 10 ml methanol and stirred by vortex mixer. The solutions were filtered through Whatman filter paper grade number 41. After suitable dilution content of KP in NEG formulations were estimated by the developed HPLC method at 254 nm (Shirsand et al., Citation2012).
pH determination
The pH of thermorevesible syringeable periodontal KP-loaded NEGs was determined by using a digital pH meter (Hicon enterprises, New Delhi, India). Sol (0.5 g) was dissolved in the 50 ml of distilled water and stored at 5 °C.
Sol-gel transition and syringeability
Sol-gel transition temperature of periodontal sol was determined using the test tube inverting method (Kumari & Pathak, Citation2012). Sol (5 ml) was transferred to test tubes, immersed in a thermostat controlled electric water bath at an initial temperature of 4 °C and sealed with aluminum foil. The temperature of the water bath was increased in increments of 0.5 °C and the sol was left to equilibrate for 1 min at each new setting. The sample was then examined for gelation, which was said to have occurred when the meniscus would no longer move upon tilting at 90° angle. Gelling temperature was recorded. To find out the gelling time, 5 ml of the sol was taken in a test tube and placed in a water bath maintained at 37 °C and the time taken to gel was recorded. The measurements were done in triplicate. Syringeability studies of NEGs were carried out by fitting with 22 gauze needle plastic syringe (1 ml). A specified amount of NEG formulation stored at 4 °C (sol form) was filled in the syringe and gentle, uniform force was applied by pressing the injector part of the syringe. During the experiment avoid the presence of air bubbles. The ease of syringeability was assessed qualitatively.
Ex vivo mucoadhesive strength measurement
The mucoadhesive strength of the prepared NEGs of different polymer concentration on goat buccal mucosa was measured using a texture analyzer (TA-XT plus, Stable Micro Systems, Surrey, UK). The goat buccal mucosa was freshly excised, and stored in a simulated gingival crevicular fluid (SGCF) (isotonic phosphate buffer solution pH 7.4) at 4 °C upon removal. The tissue was rinsed and stored in ice-cold PBS. Slice thickness varied between 2.0 and 2.3 mm. The experiment was performed at different temperature, i.e. 4, 25 and 37 °C temperature within 2 h of procurement of the mucosa. For the experiment, 50 mg of the gel was applied on the surface of the goat buccal membrane on the mucosal side in the area of 2.41 cm2. A pre-load fixed with 25 g of NEG and was applied to the membrane for 10 s (pre-load time) to establish adhesion bonding between the gel and goat buccal mucosa. After completion of pre-load time, the pre-load was removed and force was applied to the probe to detach the membrane. The force required for detachment was noted as a mucoadhesive strength (BS) (n = 3). The test was carried out at p < 0.05.
In vitro drug release kinetics of NEG with KP
In vitro drug release studies were determined by using the dialysis bag method. Typically, 400 mg of periodontal sol containing 2% drug was placed in a dialysis bag (MWCO 6000–8000) cut-off, previously soaked in SGCF (phosphate buffer pH 7.4, as similar pH in periodontal diseases) for 48 h and placed in a vessel containing 100 ml of SGCF, maintained at 37 °C and stirred at 100 rpm. At predetermined time intervals (0.5, 1, 2, 3, 4, 5, 6, 7, 8, 12, 24 h), samples of the dissolution fluid were collected and the KP concentration was analyzed by the developed HPLC method at 254 nm.
In order to describe the kinetics of the KP release from the NEG, various mathematical models have been proposed. The zero-order rate (Equation Equation1(1) ) describes systems where drug release is independent of its concentration (generally seen for poor water soluble drug in matrix, transdermal, etc.). The first-order rate (Equation Equation2
(2) ) describes systems in which the release is dependent on its concentration (generally seen for water-soluble drugs in porous matrix). The Higuchi model (Equation Equation3
(3) ) describes the release of the drug from an insoluble matrix to be linearly related to the square root of time and is based on Fickian diffusion. The Hixson–Crowell cube root law (Equation Equation4
(4) ) describes the release of drug from systems where it depends on the change in surface area and diameter of the particles or tablets with time and mainly applies in the case of systems that dissolute or erode over time. In order to authenticate the release model, dissolution data can further be analyzed by the Korsmeyer–Peppas or Power Law (Equation Equation5
(5) ) (Korsmeyer et al., 1983).
(1)
(2)
(3)
(4)
(5)
where Qt is the amount of drug released at time t, Q0 is the initial amount of the drug in the formulation, k0, k1, kH and kHC are release rate constants for zero-order, first-order, Higuchi model and Hixson–Crowell rate equations. In Equation (Equation5
(5) ), Mt is the amount of drug released at time t, and M∞ is the amount released on time ∞; k is the kinetic constant, and n is the diffusion coefficient. The criteria for the best model were based on goodness of fit (R) (Philip et al., Citation2009).
Rheological measurements
Rheological characterization of optimized gel formulation (0.5 g) was performed at 80 rpm using R/S CPS Plus Rheometer (Version: 9.00, Serial number: #303169, (Brookfield Engineering Laboratories, Inc., Middleboro, MA, USA) at 25 ± 0.5 °C with Spindle C 50-1 (diameter = 50 mm). Controlled stress rate study was conducted to get important information about the flow behavior with changes in speed of the spindle (rpm) and shear strain in two steps (step 1: 1.528–80 rpm; step 2: 80–1.528 rpm). Wait time for the operation was 180 s. Flow behavior of the optimized gel formulation sample was analyzed by Rheo-3000 (version 2.0) software (Brookfield Engineering Laboratories, Inc.) using various models such as a Newtonian model (Equation Equation6(6) ), Power Law model (Equation Equation7
(7) ), Bingham model (Equation Equation8
(8) ), Herschel–Bulkley model (Equation Equation9
(9) ) and Casson model (Equation Equation10
(10) ).
(6)
(7)
(8)
(9)
(10)
where τ is the shear stress, γ is the shear rate, η is viscosity, ηp is plastic viscosity, τo is the yield value, K is the consistency index and n is the flow behavior index.
HPLC analysis of KP
The KP concentration in in vitro release and drug content of KP-loaded NEG were determined by in house developed HPLC method. In this method, Chromatographic separation was achieved on a Capacel Pak (Shiseido, Japan) C18 Type MG column (250 mm × 4.6 mm) 5 µm particle size, using isocratic elution of mobile phase containing mixture of acetonitrile and 0.02 M potassium dihydrogen orthophosphate buffer pH 3.0 (40:60) with a flow rate of 1.0 ml min−1 and detection wavelength was 254 nm. The retention time of KP was found at 4.55 min.
Irritation testing using HET-CAM method
Ex vivo toxicity evaluation of optimized NEG loaded with KP was carried out using chorioallantoic membrane (CAM), a highly vascularized membrane that surrounds the developing chick embryo (Gilleron et al., Citation1996). Hen’s egg test-chorioallantoic membrane (HET-CAM) assay has been used to evaluate the blood vessels reaction and damage to the CAM of a fertilized hen’s egg to determine the toxicity potential of chemicals and formulations in vitro. This method is designed to examine the macroscopic treatment with test substances. Thus, unlike most in vitro methods HET-CAM assay allows the blood vessels to be examined directly. Recently, this method also used to determine the potential of dental adhesive products to induce mucosal irritation based on their ability to damage the blood vessels (Dahl, Citation2007). Fertile hen's eggs were obtained from local suppliers and were incubated at 37 ± 0.5 °C and 40 ± 5% relative humidity for 10 d. Eggs were turned every day during incubation but were left in a horizontal position for several minutes to assure that the embryo was properly positioned. On day 10 of incubation, the shell membrane was moistened with 0.9% NaCl solution at 37 ± 0.5 °C. The NaCl was aspirated, the shell membrane was carefully removed and the CAM was exposed. The test formulation (0.2 ml) was gently piped onto the CAM. NaOH (0.1 N) was used as a positive control, whereas normal saline was used as an aqueous negative control. For each formulation six eggs were used. After treatment, the blood vessels, the capillary system and the albumen were examined for the vascular responses or the so-called irritant effects of hyperemia, hemorrhage, clotting and/or coagulation at different times post application. The index describing the irritancy potential was calculated using the following formula:
where H is the time (s) in which hemorrhage appeared, V is the time (s) at which vasoconstriction was first occurred and C is the time (s) in which coagulation of protein or blood was first noted. The average score (based on six eggs) was calculated for each material, and the test materials were classified into four categories: non-irritant (0.0–0.9), slightly irritant (1.0–4.9), moderately irritant (5.0–8.9) and strongly irritant (9.0–21.0) (Luepke, Citation1985; Vinardell & Mitjans, Citation2006).
Results and discussion
Screening of oil, surfactant and cosurfactant
The most important criterion for the screening of components is the solubility of poorly soluble drug in oil. The high solubility of the drug in the oil phase is important for the nanoemulsion to maintain the drug in the solubilized form. Both long- and medium-chain triglyceride oil with different degree of saturation have been used for the design of nanoemulsions (Ahmed et al., Citation2008; Bali et al., Citation2010). Since the drug exhibited highest solubility in eugenol, it was selected as the oil phase for the development of nanoemulsion. Similarly cremophore EL and Transcutol HP has selected as surfactant and cosurfactant respectively on the basis of solubility studies.
Construction of pseudo ternary phase diagrams
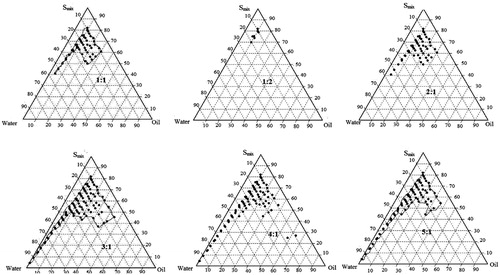
Pseudo ternary phase diagrams were constructed with the help of CHEMIX school 3.6 software (Arne Standnes, Norway) separately for each Smix ratio. In the observation, it was found that as the ratio of surfactant in Smix was increased the area of the nanoemulsion isotropic region changed slightly. In the ternary phase diagrams, the existence of small or large nanoemulsion region depends on the capability of the particular Smix to solubilise the oil phase In , the Smix ratio 1:1 had a low nanoemulsion area. The Smix ratio of 1:2 produced less nanoemulsion area than 1:1. Thus, it could be understood that increasing the proportion of transcutol HP in the Smix decreases the nanoemulsion region because the cosolvency effect with eugenol. The nanoemulsion region was found to increase till Smix ratio of 4:1 and thereafter a decrease. When Smix ratio 5:1 was studied, nanoemulsion region decreased slightly as compared to Smix 4:1 which might be due to insufficient amount of co-surfactant for emulsification and required HLB value was not obtained. The Smix ratio of 4:1 was selected as it provided the widest nanoemulsion region as determined by the cut and weigh method.
Figure 1. Pseudo-ternary phase diagrams system containing the following components: Eugenol as oil, Cremophore EL as surfactant, Transcutol® HP as cosurfactant. Dotted area shows O/W nanoemulsion region in different ratio of surfactant to cosurfactant in 1:1, 1:2, 2:1, 3:1, 4:1 and 5:1.
Selection of optimize nanoemulsion formulation using response surface methodology
A 3-factor, 3-level Box–Behnken statistical design which requires 17 experimental runs were used to optimize the NEG formulation. The observed ranges of responses, i.e. Y1, Y2 and Y3 for all experimental runs were found as 34.6 ± 0.21 to 88.11 ± 0.36 nm, 0.187 ± 0.002 to 0.487 ± 0.004 and −14.56 ± 0.34 to −29.54 ± 0.44 mV, respectively (). All the responses observed for 17 prepared formulations were simultaneously fitted to first-order, second-order and quadratic models and it was observed that the best fitted model was quadratic for response Y1, Y2 and Y3.
Contour plots and response surface analysis to optimize nanoemulsion on the basis of particle size, PDI and zeta potential
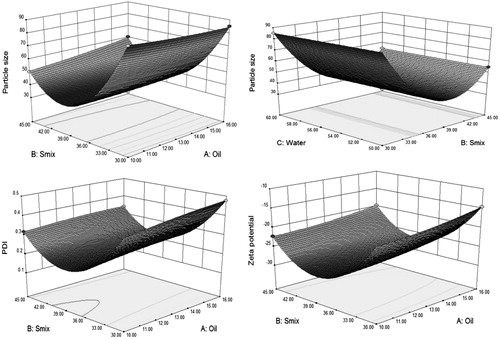
The contour plots and response surface were analyzed as shown in .
Figure 2. Response surface plots (3D) showing the effect of the amounts of oil, Smix (Cremophore EL and transcutol HP 4:1) and water on particle size, PDI and zeta potential of nanoemulsion.
Effect of independent factors on particle size
Particle size is a critical value for assessing the nanoemulsions. The smaller particle size provides a larger interfacial surface area for drug absorption. In Equation (Equation11(11) ), it was found that the Model F-value of 2861.81 implied the model was significant. There was only a 0.01% chance that a “Model F-value” this large could occur due to noise. Values of “Prob > F” less than 0.0500 indicates model terms were significant. In this case X1, X2, X1X2,
,
were significant model terms. Values greater than 0.1000 indicate the model terms were not significant. The “lack of fit F-value” of 1.12 implied the lack of fit was not significant relative to the pure error. There was a 48.44% chance that a “lack of fit F-value” this large could occur due to noise. The “predicted R-squared” of 0.9973 was in reasonable agreement with the “adjusted R-squared” of 0.9989. The ratio of 127.638 indicated an adequate signal (). This model can be used to navigate the design space. Adequate precision measures the signal to noise ratio. A ratio greater than 4 was desirable. In our finding, we found that with increased concentration of Smix leads to decrease in particle size of nanoemulsions at a certain level, whereas further increased concentration of Smix leads to increase in particle size. The variation in oil and water concentration did not show any influence on particle size.
(11)
Table 3. ANOVA results for responses Y1, Y2 and Y3 obtained from experimental design response.
Effect of independent factors on PDI
The PDI is a ratio that gives information about the homogeneity of the particle size distribution in a given system. The PDI showed () that all the nanoemulsions had narrow size distribution. In Equation (Equation12(12) ) it was found that the Model F-value of 12 045.68 implies the model was significant. There was only a 0.01% chance that a “Model F-value” this large could occur due to noise. Values of “Prob > F” less than 0.0500 indicates model terms were significant. In this case X1, X2, X1X2, X1X3, X2X3,
,
,
were significant model terms. Values greater than 0.1000 indicate the model terms were not significant. The “lack of fit F-value” of 3.93 implied the lack of fit was not significant relative to the pure error. There was a 10.97% chance that a “lack of fit F-value” this large could occur due to noise. The “predicted R-squared” of 0.9992 was in reasonable agreement with the “adjusted R-squared” of 0.9999. The ratio of 302.244 indicated an adequate signal (). This model can be used to navigate the design space. Adequate precision measures the signal to noise ratio. A ratio greater than 4 was desirable. In our finding, we found that with increased concentration of Smix leads to decrease in PDI of nanoemulsions at certain a level, whereas further increased concentration of Smix leads to increase PDI. The increased oil concentration showed increased PDI value, but less effect had been found as compared to Smix.
(12)
Table 4. Optimized nanoemulsion F1 predicted and experimental values obtained based on optimized formula generated by Design Expert 8.0.7.1® software.
Effect of independent factors in zeta potential
It indicates a degree of repulsion between adjacent, similarly charged particles in dispersion. In Equation (Equation13(13) ) it was found that the Model F-value of 105 56.98 implies the model was significant. There was only a 0.01% chance that a “Model F-value” this large could occur due to noise. Values of “Prob > F” less than 0.0500 indicates model terms were significant. In this case X1, X2, X1X2, X1X3, X2X3,
,
,
were significant model terms. Values greater than 0.1000 indicate the model terms were not significant. The “lack of fit F-value” of 0.60 implied the lack of fit was not significant relative to the pure error. There was a 68.63% chance that a “lack of fit F-value” this large could occur due to noise. The “predicted R-squared” of 0.9995 was in reasonable agreement with the “adjusted R-squared” of 0.9998. The ratio of 287.040 indicated an adequate signal (). This model can be used to navigate the design space. Adequate precision measures the signal to noise ratio. A ratio greater than 4 was desirable. In our finding, we found that with increased concentration of Smix leads to increase negative zeta potential of nanoemulsions at a certain level, whereas further increased concentration of Smix leads to decrease negative zeta potential. The variation in oil and water concentration did not show any influence on zeta potential.
(13)
The numerical optimization technique was employed for optimization of the nanoemulsion. The optimized formula was developed after studying the effects of the independent variables on the responses. The criteria followed in developing the optimized formula were based on selecting the individual variable and defining their limits (range) goals. gives the optimization constraints selected for each variable.
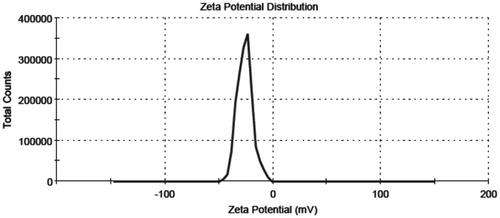
The optimized nanoemulsions were in the desired nano size range () with low PDI and high zeta potential value () was sufficiently high to prevent aggregation. The stability of colloidal dispersions significantly depends on the value of zeta potential. It was observed () that predicted value and experimental value were very close (p < 0.05), which indicated the accuracy of prediction by the Design Expert software and the utility of the experimental design for tailoring the nanoemulsion with the desired parameters.
Figure 3. Particle size distribution of optimized nanoemulsion formulation.
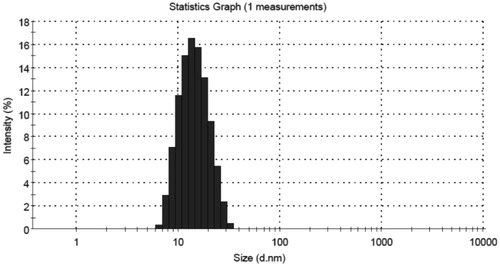
Figure 4. Zeta potential of optimized nanoemulsion formulation.
Transmission electron microscopy
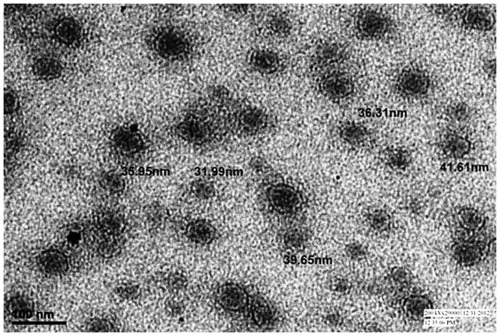
The TEM studies were carried out to get more information about the morphology and distribution of the particles of the nanoemulsion systems. In the optimized NEG formulation, most of the particles were of uniform shape (spherical) and size (range 32–42 nm) (). The particle sizes observed in the TEM study were coming in a statistical range of photon correlation spectroscopy. The particle sizes were coming in the agreement with the results obtained using photon correlation spectroscopy.
Figure 5. TEM photomicrographs of optimized nanoemulsion.
Physical stability testing of nanoemulsions
Nanoemulsions are considered to be kinetically stable systems which are formed at a particular concentration of oil, surfactant and water, with no phase separation, creaming or cracking. (Sharma et al., Citation2012). Optimized nanoemulsion from 3-factor, 3-level Box–Behnken design using response surface methodology were subjected to different stress stability test like heating cooling cycle, centrifugation and freeze thaw cycle. During stress testing optimized formulation was passed all stress conditions and no sign of Ostwald ripening was found.
Drug content and pH determination of KP loaded nanoemulgel formations
The KP loaded NEG formulations shown in this study were different contents of polymers of P407 and C934P, provided formulations with a wide range of consistency. In the experimental observation, it was found that the drug content of all the formulations (A1–A9) was nearly same and in ranged between 97.82 ± 0.88% and 100.23 ± 0.54% (). The result indicated that addition of drugs to the NEGs accounted negligible loss of the drug. The pH values of all in situ periodontal NEGs were found in nearly neutral pH range of 6.56 ± 0.004 to 6.74 ± 0.006, which indicated the suitability of periodontal drug delivery without irritation ().
Table 5. Composition of all the in situ NEGs of KP for periodontal delivery.
Table 6. Pharmacotechnical characteristics properties of all NEG formulations like pH determination, gelling temperature, gelling time, mucoadhesive strength (g), % Drug content and syringeability.
Sol-gel transition, mucoadhesive strength and syringeability studies
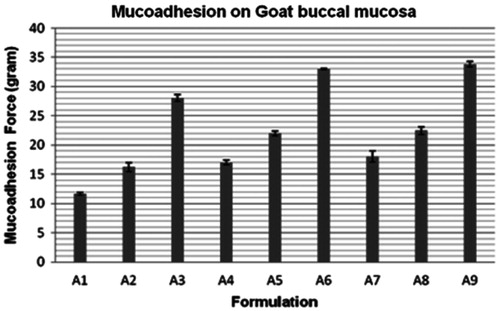
The sol-gel transition temperature range found between 19.23 ± 0.38 °C (least in A9) and 37.21 ± 0.34 °C (highest in A1). Gelling time was in the range of 23.23 ± 0.26 to 39.42 ± 0.63 s. The mucoadhesion observed on goat buccal mucosa was between 11.12 ± 0.24 g (least in A1) and 33.82 ± 0.94 g (highest in A9) (). The results were indicated that the formulation containing 1% CP934P (A3, A6 and A9) had higher mucoadhesion but did not pass syringeability test and their gelation temperature found below 25 °C due to the hard network of the polymer. Though formations (A1, A2, A4 and A7) had passed the syringeability test, but observed less mucoadhesion, A5 and A8 had been selected for further studies on the basis of their higher mucoadhesion and pass the syringeability test ().
Figure 6. Ex vivo mucoadhesion study of NEGs on goat buccal mucosa.
In vitro drug release kinetics of NEG with KP
In vitro release studies were performed in SGCF (phosphate buffer pH 7.4). The results of the in vitro drug release studies were displayed in table from the release profiles in , it could be seen that there was an initial burst release of KP. This was mainly due to the nanodroplets near the surface of the NEGs. The release mechanism of the drugs was analyzed by the commonly used exponential equation. The best fit model of optimized NEG could have followed a zero-order, first-order, Korsmeyer–Peppas model and Higuchi model. However, zero-order models are not suited to analyze swellable matrix systems, and were therefore rejected (Philip et al., Citation2009). Among the Korsmeyer–Peppas model and Higuchi model, while considering the highest correlation coefficient value (R), the release data seem to fit the Korsmeyer–Peppas model better. The drug release data were further analyzed () for curve fitting based on Power Law (Korsmeyer–Peppas law), and the n-values of optimized A5 and A8 formulations were found 0.3721 and 0.3932, respectively, confirmed that both the formulations followed pseudo Fickian diffusion (n < 0.43). The formulation A8 was showed the slower burst release than A5 due to higher amount of P407 and optimized as a better formulation. So A8 had been selected for further rheological investigation.
Figure 7. In vitro drug release of NEG loaded with KP (A5 and A8) in SGCF pH 7.4 using dialysis bag techniques.
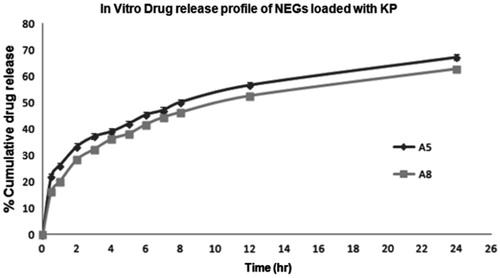
Table 7. Different kinetic models applied on NEG for periodontal delivery (A5 and A8).
Rheological measurements
The flow properties of NEG loaded with KP systems, at temperatures of 4 ± 2 °C, 25 ± 2 °C and 37 ± 2 °C, were displayed graphically in . In continuous shear rheometry, the optimized NEG loaded with KP exhibited a non-Newtonian, nonlinear relationship between shear stress and shear rate, pseudo plastic behavior, which was typical behavior of hydrophilic polymeric systems. This behavior was considered important, as it would facilitate spreading upon application over biological surface. Usually, hydrophilic polymeric systems exhibits non-Newtonian, pseudoplastic behavior, which contributes to their spreadability on application over a biologic surface; a higher degree of pseudo plasticity leads to easy spreadability of formulation (Rhee et al., Citation2008).
Figure 8. Rheological flow curves of optimized in situ gel formulation A8 at different temperature.
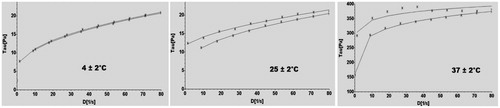
Results of rheological study demonstrate that at 4 ± 2 °C the optimized gel in sol form, it converted into a gel at room 25 ± 2 °C and gel become harder at body temperature, i.e. 37 ± 2 °C shows the suitability of desired sol-gel property for periodontal drug delivery. Finally, after fitting studied rheological parameters to different common models using RHEO V2.8 software (Brookfield Engineering Laboratories, Inc.), we found that the Herschel–Bulkley model was the best fit model to explain the flow behavior of optimized formulation. These properties determined the ease of product administration into the periodontal pocket.
Irritation studies
The irritation potential of NEG with and without KP was evaluated in vitro using HET-CAM studies (). HET-CAM was selected because it is very sensitive membrane. The scores obtained for NEG with and without KP were 0.62 ± 0.092 and 0.53 ± 0.11, respectively. The result indicated that both the formulations were non-irritant to mucous membranes. Corresponding scores for the isotonic sodium chloride and 0.1 N NaOH solution were 0.44 ± 0.062 and 12.51 ± 0.981, respectively.
Figure 9. Ex vivo irritation studies optimized NEG loaded with KP using HET-CAM method.
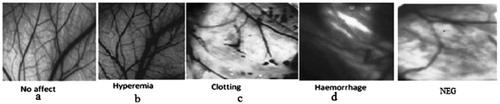
Significantly lower in vitro toxicity of the developed formulation as compared to the positive control suggests the suitability of developed NEG for intra-pocket delivery.
Conclusion
The developed optimized in situ NEG was satisfactory in terms of rheological properties and pharmaceutical characterization that offered sustained release of KP into the periodontal pocket. Significantly lower in vitro toxicity and nano size suggests the suitability of developed NEG for intra-pocket delivery. A long-term study is at present in progress and will be the subject of the further paper.
Acknowledgements
The authors are thankful to Council for Scientific and industrial Research (CSIR) New Delhi, India, file number (09/591 (0130)/2012), for providing Senior Research Fellowship. The authors are also thankful to Matrix Laboratories Ltd. Hyderabad, India, for providing the gift sample of the drug, All India Institute of Medical Science (AIIMS) New Delhi, India, for TEM studies, and Central Instrumental Facility (CIF) Laboratory, Jamia Hamdard, New Delhi, India, to carry out the present research work. The authors are grateful to Gattefosse (France) for providing the gift samples of oils, surfactants and cosurfactants.
Declaration of interest
The authors report no conflicts of interest.
References
- Ahmed M, Ramadan W, Rambhu D, Shakeel F. (2008). Potential of nanoemulsions for intravenous delivery of rifampicin. Pharmazie 63:806–11
- Bali V, Ali M, Ali J. (2010). Study of surfactant combinations and development of a novel nanoemulsion for minimising variations in bioavailability of ezetimibe. Coll Surf B Biointerface 76:410–20
- Blaszyk M, Holley RA. (1998). Interaction of monolaurin, eugenol and sodium citrate on growth of common meat spoilage and pathogenic organisms. Int J Food Microbiol 39:175–83
- Bowen WH, Pearson SK, Jerussi TP. (2000). Influence of (S)-ketoprofen and fluoride on caries in rats. Oral Dis 6:12–14
- Bruschi ML, Jones DS, Panzeri H, et al. (2007). Semisolid systems containing propolis for the treatment of periodontal disease: in vitro release kinetics, syringeability, rheological, textural, and mucoadhesive properties. J Pharm Sci 96:2074–89
- Chopra S, Pati GV, Motwani SK. (2007). Release modulating hydrophilic matrix systems of losartan potassium: optimisation of formulation using statistical experimental design. Eur J Pharm Biopharm 66:73–82
- Dahl JE. (2007). Potential of dental adhesives to induce mucosal irritation evaluated by the HET-CAM method. Acta Odontol Scand 65:275–83
- Friedman M, Henika PR, Mandrell RE. (2002). Bactericidal activities of plant essential oils and some of their isolated constituents against Campylobacter jejuni, Escherichia coli, Listeria monocytogenes and Salmonella enterica. J Food Prot 65:1545–60
- Gill AO, Holley RA. (2006). Inhibition of membrane bound ATPases of Escherichia coli and Listeria monocyto-genes by plant oil aromatics. Int J Food Microbiol 111:170–4
- Gilleron L, Coecke S, Sysmans M, et al. (1996). Evaluation of a modified HET-CAM assay as a screening test for eye irritancy. Toxicol In Vitro 10:431–46
- Govender S, Pillay V, Chetty DJ, et al. (2005). Optimisation and characterisation of bioadhesive controlled release tetracycline microspheres. Int J Pharm 306:24–40
- Hamouda T, Hayes MM, Cao Z, et al. (1999). A novel surfactant nanoemulsion with broad spectrum sporicidal activity against bacillus species. J Infect Dis 180:1939–49
- Howell TH 1993. Blocking periodontal disease progression with anti-inflammatory agents. J Periodontol 64:828–33
- Javed S, Kohli K. (2010). Local delivery of minocycline: a therapeutic paradigm in periodontal diseases. Curr Drug Deliv 7:398–406
- Jones DS, Woolfson AD, Djokic J, Coulter WA. (1996). Development and mechanical characterization of bioadhesive semisolid, polymeric systems containing tetracycline for the treatment of periodontal diseases. Pharm Res 13:1734–8
- Kumari N, Pathak K. (2012). Dual controlled release, in situ gelling periodontal sol of metronidazole benzoate and serratiopeptidase: statistical optimization and mechanistic evaluation. Curr Drug Deliv 9:74–84
- Korsmeyer RW, Gurny R, Doelker EM, et al. (1983). Mechanism of solute release from porous hydrophilic polymers. Int J Pharm 15:25–35
- Lawrence HP, Paquette DW, Smith PC, et al. (1998). Pharmacokinetic and safety evaluations of ketoprofen gels in subjects with adult periodontitis. J Dent Res 77:1904–12
- Lee VA, Karthikeyan R, Rawls HR, Amaechi BT. (2010). Anticariogenic effect of a cetylpyridinium chloride containing nanoemulsion. J Dent 38:742–9
- Li KL, Vogel R, Jeffcoat MK, et al. (1996). The effect of ketoprofen creams on periodontal disease in rhesus monkeys. J Periodontal Res 31:525–32
- Luepke NP. (1985). Hen’s egg chorioallantoic membrane for irritation potential. Food Chem Toxicol 23:287–91
- Offenbacher S, Odle BM, Green MD, et al. (1990). Inhibition of human periodontal prostaglandin E2 synthesis with selected agents. Agents Actions 29:232–8
- Paquette DW, Fiorellini JP, Martuscelli G. (1997). Enantiospecific inhibition of ligature induced periodontitis in beagles with topical (S)-ketoprofen. J Clin Periodontol 24:521–8
- Pauletto N, Silver JG, Larjava H. (1997). Nonsteroidal anti-inflammatory agents: potential modifiers of periodontal disease progression. J Can Dent Assoc 63:824–9
- Philip AK, Srivastava M, Pathak K. (2009). Buccoadhesive gels of glibenclamide: a means for achieving enhanced bioavailability. Drug Del 16:405–15
- Rhee YS, Chang SY, Park CW, et al. (2008). Optimization of ibuprofen gel formulations using experimental design technique for enhanced transdermal penetration. Int J Pharm 364:14–20
- Shafiq S, Shakeel F, Talegaonkar S, et al. (2007). Formulation development and optimization using nanoemulsion technique: a technical note. AAPS PharmSciTech 8(2):E12–E17
- Sharma S, Kumar A, Sahni JK, et al. (2012). Nanoemulsion based hydrogel containing omega 3 fatty acids as a surrogate of betamethasone dipropionate for topical delivery. Adv Sci Lett 6:221–31
- Shirsand S, Para M, Nagendrakumar D, et al. (2012). Formulation and evaluation of Ketoconazole niosomal gel drug delivery system. Int J Pharm Investig 2: 201–7
- Srinivas M, Medaiah S, Girish S, et al. (2011). The effect of Ketoprofen in chronic periodontitis: a clinical double-blind study. J Indian Soc Periodontol 15:255–9
- Vinardell MP, Mitjans M. (2006). The chorioallantoic membrane test as a model to predict the potential human eye irritation induced by commonly used laboratory solvents. Toxicol In Vitro 20:1066–70
- Vyas SP, Sihorkar V, Mishra V. (2000). Controlled and targeted drug delivery strategies towards intraperiodontal pocket disease. J Clin Pharm Ther 25:21–42
- Walsh SE, Maillard JY, Russell AD, et al. (2003). Activity and mechanisms of action of selected biocidal agents on Gram-positive and negative bacteria. J Appl Microbiol 94: 240–7