
Abstract
Risperidone is a poorly water soluble atypical antipsychotic drug. This work investigated the potential of developing risperidone effervescent tablets to facilitate drug administration and mask drug taste. The solid dispersion technique was selected to improve drug solubility due to its ease of scaling up, reproducibility and affordable cost. Thirty formulas were prepared adopting a 51.21.31 full factorial design. Trehalose, Inulin, pregelatinized starch, carboxymethylcellulose sodium and Eudragit E100 were used as hydrophilic carriers at different ratios. Rotovap, lyophilization and the kneading-oven were applied as solvent evaporation techniques. Differential scanning calorimetry, X-ray powder diffraction, Fourier transform infrared spectroscopy and scanning electron microscopy showed that the drug was present as amorphous material entrapped within the carrier matrix. Eight tablet blends were prepared using different effervescent mixture ratios with or without binder and lubricant/glidant mixture. All of the blends had acceptable flowability, acceptable effervescence times and immediate drug release that could not be achieved by any of the control formulas. The formula of choice contained 40% effervescent mixture, 5% starch, 1% boric acid, 1% aspartame and sufficient lactose. The relative bioavailability (RB) of risperidone from this formula was 161.41% with a significantly higher extent of absorption compared to the market conventional tablets. This formula may be promising in improving patient compliance and drug efficiency.
Introduction
Non-compliance is one of the most common causes of therapeutic failure in psychiatry (the non-compliance rate among psychiatric outpatients has been shown to average 50%) (Taj & Khan, Citation2005). Non-compliance is related to illness variables (schizophrenia, mania, paranoia and chronicity), patient variables (inappropriate health beliefs, need to rebel against authority, a wish to remain sick and defective memory), medication variables (unpleasant, complicated regimens and side effects) and patient–therapist variables (degree of supervision, trust and information) (Seltzer & Hoffman, Citation1980). Medical practitioners need to address this problem because compliance is directly related to the prognosis of the illness. Medication variables can be corrected by providing elegant easy-to-administer dosage forms, treating drug side effects and simplifying dosage regimens.
Risperidone is an atypical antipsychotic drug that is used to treat schizophrenia, mixed and manic states associated with bipolar disorder and irritability in children and adolescents with autism (FDA, 6 October Citation2006). Risperidone is the only approved drug agent in youth and children aged 10–18 years to address these disorders and is practically insoluble in water and is rapidly absorbed after oral administration. Risperidone is primarily metabolized via hydroxylation and oxidative N-dealkylation to its active major metabolite 9-hydroxy-risperidone. Most of the dose is excreted in urine (70%) and in feces (14%) (Sweetman, Citation2009).
The main aim of this work was to enhance patient compliance by formulation of risperidone as taste-masked and easily swallowed effervescent tablets. This requires improving the poor water solubility of risperidone, which was achieved by preparing solid dispersions of the drug within water soluble carriers. This work included in vitro and in vivo evaluation of the prepared effervescent solid dispersion tablets.
Materials
Risperidone (Janssen-Cilag, Cairo, Egypt), anhydrous citric acid (Oxford Laboratory Pharmaceuticals, Bombay, India), aspartame (Watson International Ltd., Kunshan, China), trehalose (Baltimore Biological Labs, Baltimore, MD.), inulin (SAS Chemicals, Mumbai, India), pregelatinized starch, PGS (Colorcon, Harleysville, PA), Eudragit E 100 (Evonik, Essen, Germany), carboxymethylcellulose sodium (NaCMC), sodium bicarbonate, citric acid monohydrate, tartaric acid, mannitol, talc, boric acid, corn starch, magnesium stearate, lactose monohydrate, potassium dihydrogen phosphate, disodium hydrogen phosphate and acetone (El-Nasr Pharmaceutical Chemicals, Cairo, Egypt) were used in the experiments.
Methods
Preparation of the solid dispersion
A 51.21.31 full factorial design was applied for the preparation of 30 solid dispersion formulas using either pregelatinized starch, NaCMC, trehalose, inulin or Eudragit E100 as carriers (Variable X1). Each carrier was used in two different drug-to-carrier ratios, namely 1:5 and 1:10 (Variable X2). The rotovap, lyophilization and the kneading-oven were used as solvent evaporation techniques (Variable X3). The composition of the prepared solid dispersion formula is shown in .
Table 1. Composition and evaluation of the prepared solid dispersion formulae.
Preliminary trials were conducted to select drug/carrier common solvents. Overall, 50% v/v ethyl alcohol was optimal to solubilize the drug and trehalose. Furthermore, 30% v/v ethyl alcohol and absolute alcohol were used for inulin- and Eudragit E100-based formulas, respectively. Carrier solutions were prepared at 10% w/v in the selected common solvent, and the drug was dissolved in an amount corresponding to each drug-to-carrier ratio. The combined drug/carrier solutions were evaporated at 100 °C under vacuum (Rotovap, Heidolph, Schwabach, Germany, Laborota 4000 efficient).
For pregelatinized starch, NaCMC and inulin (gel-making carriers); 10% w/v carrier hydrogels were prepared in distilled water, then temperature of the prepared hydrogels was raised to 90 °C under magnetic stirring at 500 rpm (hot plate stirrer, Wisd Wisestir MSH 20-D, Witeg, Wertheim, Germany) and saturated solutions of risperidone in acetone were added dropwise to the hot hydrogels and stirred for 10 min to completely evaporate acetone. The solid dispersions were obtained by lyophilization (Lyophilizer, SM 16 PDM, Savant, Staten Island, NY). The hydrogels prepared of pregelatinized starch and NaCMC were dried in a rotavap at 100 °C under vacuum for 1 h.
The kneading-oven technique was also applied for the preparation of solid dispersions using each of the five carriers (pregelatinized starch, NaCMC, trehalose, inulin or Eudragit E100). The carriers were ground in a glass mortar, and the drug was added. The drug carrier mixtures were triturated with a minimum amount of water for 30 min to form a homogenous paste. The formed paste was oven dried at 50 °C for 24 h (Oven, JSON-100, JSR, Korea). The pastes prepared of trehalose and Eudragit E100 was lyophilized as well.
The prepared formulas were ground, passed through a sieve 100 USP and stored in desiccators for further use.
Determination of drug loading efficiency
An accurately weighed amount of each solid dispersion formula, equivalent to 2 mg of risperidone, was dissolved in 100 ml phosphate buffer, pH 6.8. After filtration, the drug content was determined spectrophotometrically at λmax 276 nm (Spectrophotometer, Shimadzu, UV-1601 PC, Kyoto, Japan). The experiment was conducted in duplicate. The two-sided one sample t-test was adopted to compare the average drug content to its hypothetical value at p < 0.05 with degrees of freedom (n − 1).
Determination of saturation solubility
An excessive amount of each formula was shaken in phosphate buffer (pH 6.8) for 24 h at 25 °C (Oscillating thermostatically controlled shaker, Tulabo, SW-20 C). The dissolved amount of risperidone was determined spectrophotometrically after filtration. The obtained results were subjected to statistical analysis to study the effects of studied variables using Design Expert 8 program (DX 8.0.2) (Statease Inc., Minneapolis, MN, USA).
In vitro dissolution
The dissolution profiles of the pure drug, the drug from the prepared solid dispersion formula and from their corresponding drug/carrier physical mixtures were studied. The test was conducted in 900 ml phosphate buffer of pH 6.8 stirred at 50 rpm and maintained at 37 ± 0.5 °C (USP standard dissolution apparatus with paddle, Varain, VK 7000, Palo Alto, CA). Five milliliter aliquot samples were withdrawn with replacement at 5, 10, 15, 20 and 30 min. The samples were filtered and measured spectrophotometrically.
The dissolution efficiency (D.E.0–30) values were calculated as the area under the dissolution curve up to 30 min, expressed as a percentage of the area of the rectangle described by 100% dissolution in the same time (Khan & Rhodes, Citation1972; Khan, Citation1975). The percentage drug released at 5 min (Q5) was calculated. The results of Q5 and D.E.(0–30) were subjected to statistical analysis using the DX 8.0.2 to study the effects of the three studied variables and their interactions.
The in vitro dissolution data were fitted in zero-order, first-order and diffusion-controlled Higuchi equations. The coefficient of determination (r2) values were used for the judgment of the release order. The Korsmeyer–Peppas model was applied to investigate the dissolution mechanism (Peppas, Citation1985).
The characterization of solid dispersion
The selected formulas were subjected to further characterization using differential scanning calorimetry (DSC), infrared spectroscopy, powder X-ray diffraction (PXRD) and a scanning electron microscope.
Differential scanning calorimetry
In total, 4 mg of each of the selected formulas was subjected to DSC using an aluminum cell (Shimadzu, DSC-50) under a nitrogen atmosphere at a flow rate of 25 ml/min. The hold temperature was set at 200 °C, and the temperature acceleration rate was 10 °C/min. DSC thermograms of the selected formulas were compared to plain drug, free carriers and the corresponding drug/carrier mixtures.
Fourier transform infrared spectroscopy
The Fourier transform infrared (FT-IR) spectra of the selected formula were recorded (Infrared spectrophotometer, Mattson, Fremont, CA). The IR spectrum of each system was compared to the plain drug and free carrier.
Powder X-ray diffraction
The selected formulas were exposed to analysis of its X-ray diffraction (X-ray diffractometer, Shimadzu, XD-610) using Cu kα radiation (40 kv, 30 mA) at a scan rate of 8 deg/min. A fixed slit system was employed with the following slit parameters: divergence 1°, scatter 1° and receiving 0.3 mm. The results were given as intensity versus 2θ. The X-ray diffraction patterns of the formulas were compared to the plain drug.
Scanning electron microscopy
The surface morphology of the selected formula was examined using a scanning electron microscope. The powders were fixed on a brass stub using double-sided adhesive tape and then made electrically conductive by coating a vacuum chamber with a thin layer of gold for 30 s (Sputter coater, Edwards, S150A, England, UK). The pictures were taken at an excitation voltage of 20 kv (Electron probe microanalyzer, Jeol, JXA-840A, Tokyo, Japan).
Preparation and evaluation of effervescent tablets
The solid dispersion formula of choice was formulated as effervescent tablets adopting a 23 full factorial design. Three formulation variables were evaluated, each at two levels, and experimental trials were performed at all of the eight possible combinations. The independent variables were the percentage of effervescent mixture (x1), the presence of the binder (x2) and the presence of lubricant/glidant (x3). Carr's index and the effervescence time were selected as the dependent variables. One-way analysis of variance (ANOVA) was used to determine the effect of the tested variables on the evaluation parameters (DX 8.0.2). Numerical optimization was performed by calculating the desirability factor that minimizes Carr's index and effervescent time and maximizes the percentage of drug released.
A standard effervescent mixture of 27:18:50 citric acid:tartaric acid:sodium bicarbonate was used. Mannitol (10%) was added as a binder, and 6% boric acid/starch mixture was used as the lubricant/glidant. Each tablet contained 22 mg of the solid dispersion formula, corresponding to 2 mg drug, and 1% aspartame as the sweetening agent. Total tablet weights were fixed at 1500 mg, where sufficient lactose was used as a diluent. The composition of the prepared effervescent tablets is shown in .
Table 2. Composition and evaluation of the prepared solid dispersion effervescent tablet formulae.
The prepared tablet blends were compressed into tablets by direct compression using a single punch tablet machine (Royal artist, Mumbai, India) with 17-mm circular concave punches and dies.
Twenty tablets from each formula were evaluated for hardness (hardness tester, Monsanto, Creve Coeur, MO) and friability (Digital friabilator, DFI-1; Veego, Bombay, India). The effervescence time was determined in 100 ml water using a stop watch (n = 3) at room temperature. The pH of the produced solution was measured (pH meter, Jenway, 3510, Staffordshire, UK), and the solution was filtered and assayed for the percentage of risperidone released.
The prepared tablets were compared to their corresponding control tablet formulas containing 2 mg risperidone without solid dispersion formulation. The prepared control formulas are listed in .
Table 3. Composition and evaluation of the prepared control tablets.
In vivo evaluation
The study was designed to compare the drug bioavailability from the optimized solid dispersion-based effervescent tablets to the commercial conventional tablets, Risperdal® (Janssen-Cilag, Batch number 01E33/F023). Six rabbits (2.5–3 kg) were randomly allocated into two groups. Each group received a single oral dose of each of the tested formulas separated by a wash-out period of two weeks in a cross-over design. The animals were fasted for 24 h before administration and up to 4 h post-dosing (water was allowed). The study protocol was approved by the Research Ethics Committee of Faculty of Pharmacy, Cairo University.
The dose was calculated based on the animal's body surface area according to the following equation: BSA in cm2 = 9.5 X (weight in grams)2/3 (1) (Weisbroth et al., Citation1974; Harkness & Wagner, Citation1989).
Blood samples were withdrawn from the marginal ear vein of the rabbits, collected in heparinized tubes and centrifuged at 3000 rpm for 10 min (Centrifuge, Remi Laboratory, R32 A, Bombay, India). The clear plasma was then deep frozen at –20 °C for analysis.
The analysis of samples was performed using an HPLC system consisting of an isocratic pump (Shimadzu, LC-10 AD) equipped with a spectrofluorimetric detector (Shimadzu, RF-551) and a reversed phase C18 column (3.9 mm × 300 mm of particle size 4 µm, Waters, Milford, MA).
Haloperidol was used as an internal standard at a concentration of 500 ng/ml. The samples were prepared for column injection by the addition of acetonitrile, vortex mixing for 30 s and centrifugation for 10 min at 3000 rpm. A 40:60 v/v mixture of methanol and 0.02 N acetic acid was used as the mobile phase at a flow rate of 1.5 ml/min. The assay procedures were validated in terms of linearity and extraction recovery. The relative recoveries of 20, 30, 40, 50, 80, 100, 150 and 200 ng/ml were evaluated by assaying the plasma standards as described above and comparing the peak area ratios with the standards obtained from the direct injection of unprocessed reference solutions of the same concentrations.
The plasma concentration–time data were plotted, and the pharmacokinetic parameters were calculated using the Kinetica 2000, (Adept scientific, Herts, UK) program extravascular model. Namely, the peak plasma concentration (Cmax, ng/ml), time to Cmax (Tmax, h), area under the plasma concentration–time curve extrapolated to infinity (AUC(0–∞), ng.h/ml), area under the first moment curve extrapolated to infinity (AUMC(0–∞), ng.h2/ml), ratio of Cmax/AUC(0-∞) h−1, mean residence time (MRT, h) and elimination rate constant (K, h−1) were examined. The percentage RB was also calculated as (AUC(0–∞) solid dispersion tablets/AUC(0–∞) Risperdal tablets) × 100.
The obtained data were statistically analyzed by applying two-way ANOVA, where differences were considered significant at p ≤ 0.05.
Results and discussion
Preparation of solid dispersion
The solvent evaporation method is usually applied for the preparation of solid dispersions when both drug and carrier are dissolved in a common solvent, which is then evaporated (Kearney et al., Citation1994; Lo & Law, Citation1996; El-Zein & Riad et al., Citation1998). Risperidone is poorly soluble in water but soluble in ethanol and acetone (Ereshefsky & Lacombe, Citation1993; Huang et al., Citation1993). Trehalose is soluble in water and very slightly soluble in ethanol, inulin is slightly soluble in both water and ethanol and Eudragit E100 is soluble in water and ethanol. Thus, hydroalcoholic or alcoholic solutions were selected as common solvents for trehalose-, inulin- and Eudragit E100-based solid dispersion formulas. In contrast, no common solvents were established for pregelatinized starch or NaCMC with the drug (both carriers are soluble in water and insoluble in ethanol and acetone) (Rowe et al., Citation2009). In contrast, solid dispersions of the drug within those carriers were prepared by dispersing the drug in polymer hydrogels followed by drying using either lyophilization or rotavap techniques. Solid dispersions were also prepared by drying drug-carrier pastes by lyophilization.
Determination of drug loading efficiency
UV spectroscopy was used to measure drug concentration. Specificity of the analytical method was ensured by scanning the drug with all the adjuvants used. No interference between the drug and any of them has been reported. The mean drug loading values ranged from 92.80 ± 12.79% to 108.75 ±7.92% for the prepared solid dispersion formulas. Statistical analysis showed that no significant differences were observed between the actual mean drug content values and the hypothetical values in all of the formulas. The calculated t-values were less than the corresponding tabulated t-value (12.71) at p < 0.05.
Saturation solubility
The saturation solubility of pure risperidone in phosphate buffer, pH 6.8, was equal to 1.26 mg/ml. The saturation solubilities of the drug in the prepared solid dispersion formulas are shown in . Formulation as a solid dispersion increased drug solubility from 1.13-fold (formula F2) to 2.92-fold (formula F12).
One-way ANOVA analysis showed that the three tested variables (type of carrier, the drug-to-carrier ratio and the solvent evaporation technique) had significant effects on solubility at p < 0.05 with an F-value of 34.87. There is only a 0.01% chance that a model F-value this large occurs due to noise.
NaCMC recorded the highest improvement in drug solubility, followed by pregelatinized starch, trehalose, Eudragit E100 and inulin. Increasing the drug-to-carrier ratio from 1:5 to 1:10 increased the drug solubility. Lyophilization was the method of preference among other solvent evaporation techniques.
Significant interactions between the solvent evaporation technique (X3) and each of the variables X1 (carrier type) and X2 (drug-to-carrier ratio) were also proven. NaCMC-based formulas achieved the highest solubility enhancement effect in comparison to other carriers when prepared by lyophilization and rotavap. The effect of the drug-to-carrier ratio (X2) on solubility was more significant when combined with lyophilization rather than with other solvent evaporation techniques.
In vitro dissolution
The in vitro dissolution profiles of risperidone from some solid dispersion formulas compared to their corresponding drug/carrier physical mixture as well as to the pure drug are shown in . The percentage drug dissolved at 5 min (Q5) and the dissolution efficiency (D.E.0–30) were calculated, and the values for all of the formulas are shown in . Both release parameters (Q5 and D.E.0–30) were significantly higher for all solid dispersion formulas than the corresponding physical mixtures. This finding indicates that improving the dissolution of the drug from the different formulas was due to the formation of solid dispersion and not only due to the wetting effect of the carrier on the drug.
Figure 1. In vitro dissolution profiles of selected prepared solid dispersion formulae and drug.
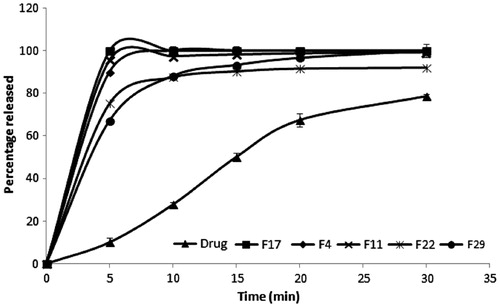
Statistical analysis showed that both the carrier type (X1) and the drug-to-carrier ratio (X2) had significant effects on Q5 and D.E.0–30 at p < 0.05 with F-values of 16.32 and 6.63, respectively. NaCMC- and trehalose-based formulas recorded significantly higher values for both dissolution parameters than the carrier formulas. Increasing the carrier ratio significantly enhanced the drug dissolution.
Significant interactions between the carrier type (X1) and each of the drug-to-carrier ratios (X2) and the solvent evaporation technique (X3) were recorded on Q5. The 1:10 formula showed significantly higher Q5 values in the trehalose-, inulin- and Eudragit E100-based formulas. The effect of using the kneading-oven technique on Q5 was significantly higher in NaCMC- and trehalose-based formulas; however, the rotavap had a higher effect with pregelatinized starch, NaCMC and inulin as carriers.
The X1/X3 interaction had a significant effect on the dissolution efficiency of risperidone from different formulas. The 1:10 formula had significantly higher dissolution efficiency values than the 1:5 formula when dried by rotavap or kneading-oven. In contrast, the effect of the drug-to-carrier ratio was less prominent when using lyophilization.
Kinetic analysis showed that the release of risperidone from all formulas fitted either first-order or Higuchi diffusion models rather than zero-order release, indicating that the drug release was concentration-dependent (Bourne, Citation2002) and that the diffusion of the drug through the carrier matrix is the rate-limiting step (Costa & Sousa Lobo, Citation2001). Korsmeyer–Peppas analysis showed that the release mechanism was Fickian release for several formulas and the anomalous transport mechanism. Kinetic analysis was not conducted for formulas showing 100% release in less than 15 min (data not shown).
The F4, F11, F17, F22 and F29 formulas recorded the highest drug dissolution rate and extent. These five formulas were chosen for further solid dispersion characterization.
Differential scanning calorimetry
shows the DSC thermograms of the five chosen solid dispersion formulas and their corresponding drug/carrier physical mixtures as well as the pure drug. The drug exhibited a sharp endothermic peak at 170 °C corresponding to its melting point. This peak was persistent in all physical mixtures, indicating the lack of any specific interaction between the drug and the used carriers (Damian & Blaton et al., Citation2000; Naima & Siro et al., Citation2001).
Figure 2. DSC thermograms of the selected solid dispersion formulae and their corresponding physical mixtures.
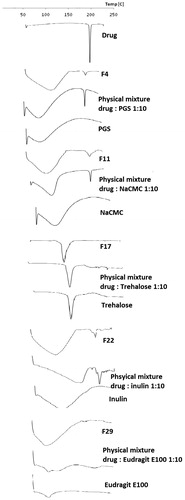
The drug melting peak disappeared completely in DSC thermograms of trehalose- and Eudragit E100-based formulas (F17 and F29). This finding suggests that the drug was completely dissolved within the carrier as one phase. Pregelatinized starch-, NaCMC- and inulin-based formulas (F4, F11 and F22, respectively) recorded broader drug peaks with relatively lower intensities compared to their corresponding drug/carrier physical mixtures. The drug was partially dissolved within those carriers forming a two-phase solid dispersion (Zajc & Obreza et al., Citation2005).
FT-IR spectroscopy
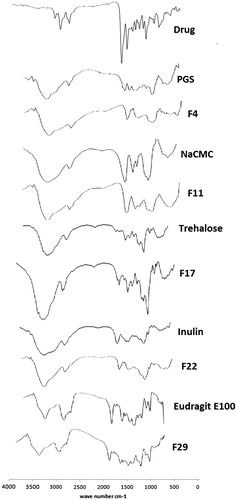
shows that the characteristic bands of risperidone either disappeared or were reduced in intensity in the spectra of the different solid dispersion formulas, which may be due to restriction of the drug within the carrier.
Figure 3. IR spectra of the selected solid dispersion formulae and their carriers.
Powder X-ray diffraction
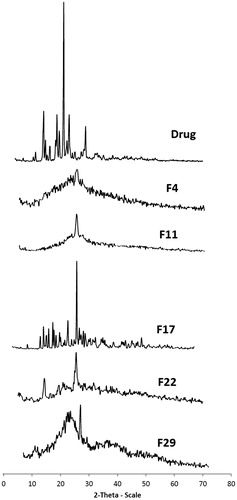
The PXRD pattern of risperidone indicated the crystalline nature with a prominent peak of high intensity at 2θ = 21.33° and four other less prominent peaks at 2 θ = 14.102 °, 18.793°, 23.053° and 28.84°. The significant disappearance and/or reduction in peak intensity was observed in solid dispersion XRPD patterns (). This reduction in drug crystallinity was a factor in enhancing drug solubility and dissolution (Hancock & Zografi, Citation1997; Damian & Blaton et al., Citation2000; Castelli & Sarpietro et al., Citation2008).
Figure 4. X-ray diffraction patterns of the selected solid dispersion formulae and the drug.
Scanning electron microscopy
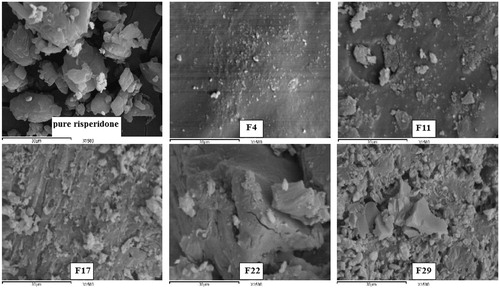
Scanning electron microscopy photographs at 1500 × supported the DSC and XRPD results about the crystalline nature of pure risperidone. A similar finding was reported by Rahman et al. (Citation2010). The drug crystals disappeared in the prepared solid dispersions, and the formulas appeared as one homogenous phase (). This finding further explains the enhanced solubility and dissolution of the drug from these formulas.
Figure 5. Scanning electron microscope photographs at magnification power X = 1500.
Preparation and evaluation of effervescent tablets
The solid dispersion formula F17 (1:10 risperidone to trehalose prepared by kneading-oven) was the only formula to release 100% of its loaded drug in 5 min and recorded the highest dissolution efficiency (91.67%) and an acceptable solubilizing effect for the drug (2-fold). This formula was chosen for effervescent tablet formulation.
The drug-to-filler ratio was fixed in all tablets to reduce the residual variation and increase the sensitivity of the experiment in detecting the effects or changes in response due to the factors under investigation.
Carr's index values of the tablet blends ranged from 5.67 to 13.87, indicating good flowability (Lachman & Lieberman et al., Citation1986), and the effervescence time ranged from 28 to 47 s (). The weight variation test showed that not more than two individual weights of each formula deviated from their average weight by more than 5% and that none deviated by more than 10%. Tablet hardness values ranged from 5.5 to 6.25 kg and friability values from 0.2 to 0.65% (w/w). All of the prepared formulas showed 100% drug release after effervescence, which could not be achieved by any of the control formulas (). The pH of the produced solution after effervescence cessation ranged from 5.25 to 5.71.
Statistical analysis showed that none of the tested variables had a significant effect on the Carr's index or effervescence time. The desirability factors were calculated for the tablet formula using the DX 8.0.2 to choose the optimum one for in-vivo evaluation. The desirability factor values ranged from 0.099 to 0.645. Effervescent tablet formula T6 (containing 40% effervescent mixture, 5% starch and 1% boric acid, 1% aspartame and enough lactose) had the highest desirability value.
In vivo testing
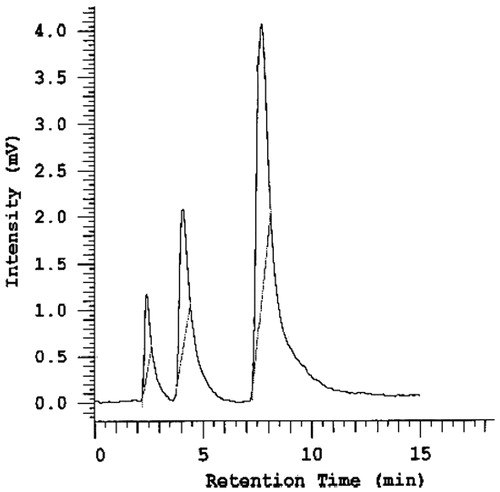
The crossover design was selected because it is statistically efficient and requires fewer subjects than non-crossover designs (Jones & Kenward, Citation2003). The wash-out period was calculated to be more than 10 half-lives of risperidone to allow complete elimination of the drug (drug half-life is 19 h) (Chereson, Citation1996). Haloperidol was used successfully as an internal standard for the HPLC assay due to its chemical similarity with risperidone (Olesen & Linnet, Citation1997). Risperidone and haloperidol peaks were sufficiently separated and readily distinguishable by the instrument (Skoog, Citation1998), and they were eluted after 3.9 and 8.5 min, respectively, when the blank rabbit plasma spiked with both drugs was analyzed (). Acetonitrile was added to each plasma sample to precipitate plasma proteins that may interfere with the drug peaks and internal standard (Sedgwick et al., Citation1991).
Figure 6. HPLC chromatogram of rabbit plasma spiked with risperidone and haloperidol.
The plasma concentration–time curve after the administration of both effervescent solid dispersion tablets and market conventional Risperdal tablets are shown in . Statistical analysis for the mean maximum plasma concentration (Cmax) values using two-way ANOVA showed a non-significant difference between both treatments (p = 0.504399) and a non-significant subject effect (p = 0.112503) at p < 0.05 with F-values of 0.431239 and 3.221538, respectively. The time for maximum plasma drug concentration (tmax) decreased from 3 h in the market product to 2 h in the selected formula.
Figure 7. Mean plasma risperidone concentrations following a single oral administration of 0.2 mg/Kg of effervescent solid dispersion tablets and Risperdal® tablets to six rabbits.
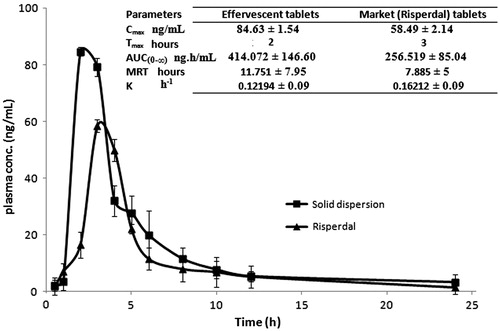
A significant difference between the total area under the plasma concentration–time curve (AUC(0–∞)) between both treatments and a non-significant subject effect were proved at p < 0.05. The selected formula had a higher extent of absorption than the market product (Tozer et al., Citation1996; Thiessen, Citation2004).
The Cmax/AUC∞ values were found to be 0.2412 ±0.09 h−1 and 0.2448 ± 0.08 h−1 for the prepared tablets and Risperdal® tablets, respectively. The statistical analysis showed a non-significant difference between treatments (p = 0.767408) and a significant difference between subjects (p = 0.034073) at p < 0.05 with an F-value of 0.283058 and 8.834876, respectively. The rate of absorption varied significantly in different rabbits, but no significant difference was observed in the absorption rate between different formulas (Endrenyi & Fritsch et al., Citation1991; Macheras & Symillides et al., Citation1993; Lacey & Keene et al., Citation1994; Duquesnoy & Lacey et al., Citation1998). Similarly, a non-significant difference in the MRT values between the formulas and a significant difference between rabbits were recorded. This finding relates to the variation in MRT between subjects to differences in absorption rate and suggests the occurrence of the flip-flop phenomenon (Boxenbaum, Citation1998).
The elimination rate constant K was calculated as the reciprocal of MRT; and the RB of the solid dispersion tablets relative to the market product was found to be 161.41%.
Conclusion
The formulation of risperidone as a solid dispersion enhanced drug solubility and dissolution and allowed its preparation as effervescent tablets. In particular, the 1:10 trehalose-based formula exhibited the highest dissolution rate and extent. The importance of controlling and suitably selecting factors such as carrier type, drug-to-carrier ratio and the method of solid dispersion preparation to maximize the drug dissolution improvement have been noted. The risperidone solid dispersion effervescent tablets were successfully prepared by direct compression adopting the factorial design. The tablet formula of choice recorded an effervescent time of 28 s and released 100% of the drug immediately, which was reflected in the improved drug availability in rabbits in comparison with the commercial conventional tablets. Effervescent tablets are promising in masking drug taste and increasing patient acceptability as well as enhancing drug bioavailability when compared to conventional tablets. Further clinical trials should be done to readjust the dose of the prepared effervescent tablets.
Declaration of interest
The authors declare they have no conflicts of interest.
References
- Bourne DWA. (2002). Pharmacokinetics. In: Banker GS, Rhodes CT, ed. Modern pharmaceutics. 4th ed. New York: Marcel Dekker Inc., 67–92
- Boxenbaum H. (1998). Pharmacokinetics tricks and traps: flip-flop models. J Pharm Pharm Sci 1:90–1
- Castelli F, Sarpietro MG, Micieli D, et al. (2008). Differential scanning calorimetry study on drug release from an inulin-based hydrogel and its interaction with a biomembrane model: pH and loading effect. Eur J Pharm Sci 35:76–85
- Chereson R. (1996). Bioavailability, Bioequivalence and Drug Selection. Basic Pharmacokinetics, ed. M.C. Makoid
- Costa P, Sousa Lobo JM. (2001). Modeling and comparison of dissolution profiles. Eur J Pharm Sci 13:123–33
- Damian F, Blaton N, Naesens L, et al. (2000). Physicochemical characterization of solid dispersions of the antiviral agent UC-781 with polyethylene glycol 6000 and Gelucire 44/14. Eur J Pharm Sci 10:311–22
- Duquesnoy C, Lacey LF, Keene ON, Bye A. (1998). Evaluation of different partial AUCs as indirect measures of rate of drug absorption in comparative pharmacokinetic studies. Eur J Pharm Sci 6:259–64
- El-Zein H, Riad L, El-Bary AA. (1998). Enhancement of carbamazepine dissolution: in vitro and in vivo evaluation. Int J Pharm 168:209–20
- Endrenyi L, Fritsch S, Yan W. (1991). Cmax/AUC is a clearer measure than Cmax for absorption rates in investigations of bioequivalence. Int J Clin Pharmacol Ther Toxicol 29:394–9
- Ereshefsky L, Lacombe S. (1993). Pharmacological profile of risperidone. Can J Psychiatry 38:S80–8
- FDA. (October 6, 2006). FDA approves the first drug to treat irritability associated with autism, Risperdal. Available from: http://www.fda.gov/NewsEvents/Newsroom/PressAnnouncements/2006/ucm108759.htm [last accessed 14 August 2009]
- Hancock BC, Zografi G. (1997). Characteristics and significance of the amorphous state in pharmaceutical systems. J Pharm Sci 86:1–12
- Harkness JE, Wagner JE. (1989). The biology and medicine of rabbits and rodents. Philadelphia: Lea and Febiger
- Huang ML, Van Peer A, Woestenborghs R, et al. (1993). Pharmacokinetics of the novel antipsychotic agent risperidone and the prolactin response in healthy subjects. Clin Pharmacol Ther 54:257–68
- Jones B, Kenward MG. (2003). Design and analysis of cross-over trials (Second ed.). London: Chapman and Hall
- Kearney AS, Gabriel DL, Mehta SC, et al. (1994). Effect of polyvinylpyrrolidone on the crystallinity and dissolution rate of solid dispersions of the antiinflammatory CI-987. Int J Pharm 104:169–74
- Khan KA. (1975). The concept of dissolution efficiency. J Pharm Pharmacol 27:48–9
- Khan KA, Rhodes CT. (1972). Effect of compaction pressure on the dissolution efficiency of some direct compression systems. Pharm Acta Helv 47:594–607
- Lacey LF, Keene ON, Duquesnoy C, Bye A. (1994). Evaluation of different indirect measures of rate of drug absorption in comparative pharmacokinetic studies. J Pharm Sci 83:212–15
- Lachman L, Lieberman HA, Kanig JL. (1986). The theory and practice of industrial pharmacy. Philadelphia: Lea & Febiger
- Lo WY, Law SL. (1996). Dissolution behavior of griseofulvin solid dispersions using polyethylene glycol, talc, and their combination as dispersion carriers. Drug Dev Ind Pharm 22:231–6
- Macheras P, Symillides M, Reppas C. (1993). Estimation of absorption rate constant in a one-compartment model with the profile of the bioavailable dose eliminated as a function of multiples of half-life. J Pharm Sci 82:1298–300
- Sweetman SC. (2009). Martindale: the complete drug reference. London: Chicago, Pharmaceutical Press, 1024–7
- Naima ZT. Siro T, Juan-Manuel GD, et al. (2001). Interactions between carbamazepine and polyethylene glycol (PEG) 6000: characterisations of the physical, solid dispersed and eutectic mixtures. Eur J Pharm Sci 12:395–404
- Olesen OV, Linnet K. (1997). Simplified high-performance liquid chromatographic method for determination of risperidone and 9-hydroxyrisperidone in serum from patients comedicated with other psychotropic drugs. J Chromatogr B Biomed Sci Appl 698:209–16
- Peppas NA. (1985). Analysis of Fickian and non-Fickian drug release from polymers. Pharm Acta Helv 60:110–11
- Rahman Z, Zidan AS, Khan MA. (2010). Risperidone solid dispersion for orally disintegrating tablet: its formulation design and non-destructive methods of evaluation. Int J Pharm 400:49–58
- Rowe RC, Shesky PJ, Quinn ME. (2009). Handbook of pharmaceutical excipients. Pharmaceutical Press: London
- Sedgwick GW, Fenton TW, et al. (1991). Effect of protein precipitating agents on the recovery of plasma free amino acids. Can J Anim Sci 71:953–7
- Seltzer A, Hoffman BF. (1980). Drug compliance and the psychiatric patient. Can Fam Physician 26:725–7
- Skoog DA. (1998). Principles of instrumental analysis: introduction. Orlando (FL): Harcourt Brace, 18
- Taj R, Khan S. (2005). A study of reasons of non-compliance to psychiatric treatment. J Ayub Med Coll Abbottabad 17:26–8
- Thiessen JJ. (2004). Bioavailability and bioequivalence. Irvine: IUPHAR
- Tozer TN, Bois FY, Hauck WW, et al. (1996). Absorption rate vs. exposure: which is more useful for bioequivalence testing? Pharm Res 13:453–6
- Weisbroth SH, Flatt RE, Kraus AL. (1974). The biology of the laboratory rabbit. New York: Academic Press
- Zajc N, Obreza A, Bele M, Srcic S. (2005). Physical properties and dissolution behaviour of nifedipine/mannitol solid dispersions prepared by hot melt method. Int J Pharm 291:51–8