
Abstract
Encapsulation of drugs in mesoporous silica using co-spray drying process has been recently explored as potential industrial method. However, the impact of spray drying on manufacturability, physiochemical stability and bioavailability in relation to conventional drug load processes are yet to be fully investigated. Using a 23 factorial design, this study aims to investigate the effect of drug-loading process (co-spray drying and solvent impregnation), mesoporous silica pore size (SBA-15, 6.5 nm and MCM-41, 2.5 nm) and percentage drug load (30% w/w and 50% w/w) on material properties, crystallinity, physicochemical stability, release profiles and bioavailability of fenofibrate (FEN) loaded into mesoporous silica. From the scanning electronic microscopy (SEM) images, powder X-ray diffraction and Differential scanning calorimetry measurements, it is indicated that the co-spray drying process was able to load up to 50% (w/w) FEN in amorphous form onto the mesoporous silica as compared to the 30% (w/w) for solvent impregnation. The in vitro dissolution rate of the co-spray dried formulations was also significantly (p = 0.044) better than solvent impregnated formulations at the same drug loading. Six-month accelerated stability test at 40 °C/75% RH in open dish indicated excellent physical and chemical stability of formulations prepared by both methods. The amorphous state of FEN and the enhanced dissolution profiles were well preserved, and very low levels of degradation were detected after storage. The dog data for the three selected co-spray-dried formulations revealed multiple fold increment in FEN bioavailability compared to the reference crystalline FEN. These results validate the viability of co-spray-dried mesoporous silica formulations with high amorphous drug load as potential drug delivery systems for poorly water soluble drugs.
Introduction
The number of poorly water soluble drug candidates has risen sharply due to the increasing number of new chemical entities (NCEs) with poor thermodynamic solubility (Lipinski et al., Citation2001). Many of these NCEs may fail to be commercialized as they have poor bioavailability due to their limited solubility or slow dissolution rate in the gastrointestinal tract. Developing formulation strategies for the administration of these NCEs via the oral route has become challenging for the pharmaceutical industry. Among other strategies, solid-state manipulation by amorphization of poorly water-soluble compounds to enhance dissolution has garnered great interest (Kaushal et al., Citation2004). Commonly used techniques to produce the amorphous form of drugs include the formation of solid drug dispersions with water-soluble carriers (Serajuddin, Citation1999), co-grinding with additives (Yang et al., Citation2012), melt-extrusion (Breitenbach, Citation2002), melt quenching (Watanabe et al., Citation2001) and spray drying (Gupta & Bansal, Citation2005). However, commercial applications of some of these techniques have been constrained, primarily due to the challenges in stabilizing the amorphous form of drugs in these systems (Serajuddin, Citation1999).
In recent years, there has been a growing interest in the use of ordered mesoporous silica as a drug carrier for poorly soluble drugs. Mesoporous silica materials offer several attractive features, which render them excellent candidates as drug-delivery systems (Vallet-Regi et al., Citation2000, Citation2007; Heikkila et al., Citation2007). First, their regular pore sizes can be systematically varied between 2 and 30 nm, creating an environment potentially suitable for adsorption of small and large molecules. Second, the particles have a large surface area for drug adsorption and a high pore volume for drug confinement. Third, the silanol groups can be functionalized to modify drug binding and finally, drugs can be homogenously distributed and stabilized in the amorphous state inside the ordered matrix. Mobil Composition of Matter number 41 (MCM-41) with pore diameter between 2 and 6 nm (Beck et al., Citation1992) and Santa Barbara Amorphous number 15 (SBA-15) with pore diameter between 4 and 13 nm (Zhao et al., Citation1998) are amongst the most investigated mesoporous materials. Dissolution rate improvement is attained by inhibiting nucleation and recrystallization of the entrapped drug molecules adsorbed in the mesoporous solid, thus enabling an enhanced dissolution rate by the delivery of the drug in its amorphous form. The release kinetics of drugs from the mesoporous silica is dependent on factors such as the pore size (Horcajada et al., Citation2004; Shen et al., Citation2011) and the nature of the host–guest chemical interaction (Muñoz et al., Citation2002; Horcajada et al., Citation2004; Salonen et al., Citation2005).
Numerous studies based on mesoporous silica have shown that they can enhance the dissolution rates of poorly soluble drugs (Heikkila et al., Citation2007; Van Speybroeck et al., Citation2009). Improvement on oral bioavailability has also been reported for itraconazole in both rabbits and dogs (Mellaerts et al., Citation2008) and fenofibrate (FEN) in rats (Van Speybroeck et al., Citation2010). Literature reports indicate that solvent impregnation (Charnay et al., Citation2004; Van Speybroeck et al., Citation2009, Citation2010) and immersion (Muñoz et al., Citation2002; Charnay et al., Citation2004; Song et al., Citation2005; Vallet-Regi, Citation2006; Limnell et al., Citation2011b) methods are commonly used drug-loading methods. However, impregnation and immersion method exhibited the difficulties to achieve high drug load in amorphous form. The drug loading procedure may also affect the final performance of formulated drugs. The use of spray dryers (Takeuchi et al., Citation2005; Shen et al., Citation2010) has been explored as potential industrial method, but the impact of spray drying on stability, bioavailability and manufacturability of drugs in mesoporous silica are yet to be fully understood.
FEN is known for its low glass transition temperature of –20 °C, which presents a challenge to stabilize its amorphous form. FEN is highly lipophilic (log p = 5.24) (Munoz et al., Citation1994) and has a very low aqueous solubility, 0.8 µg/mL (Jamzad & Fassihi, Citation2006). Hence, we undertook a design of experiment (DOE) approach to study the effect of pore sizes, drug-loading processes and drug load on physicochemical stability, in vitro release and in vivo dog bioavailability of FEN in mesoporous silica.
Material and methods
Synthesis mesoporous silica
SBA-15 synthesis
Mesoporous SBA-15 with submicron particle size was synthesized by a rapid condensation process. Template (4.0 g), EO20-PO70-EO20 (P123, Pluronic 123, Aldrich, St Louis, MO) was dissolved in 150 g of a 2 N HCl solution under stirring at 40 °C for 2 h. Tetraethylorthosilicate (TEOS; 9.0 g, Aldrich, St Louis, MO, 98%) was added to the solution under vigorous stirring for 2 min. The hydrolysis of TEOS was performed at 40 °C for 2 h without stirring for different periods. The mole ratio of components in the mixture is SiO2:P123:HCl:H2O =1.0:0.016:6.9:178.6. The mixture was transferred to a polypropylene bottle and aged in an oven at 100 °C for 24 h. The resulting material was filtrated and washed with deionized water, then dried at 55 °C for 12 h. To remove the template molecules, the material was heated from room temperature to 550 °C for 6 h in air at a heating rate of 2 °C/min.
MCM-41 synthesis
MCM-41 with pore size of about 2 nm was prepared by hydrothermal synthesis using cetyltrimethylammonium bromide (CTMABr) as a template. The procedure was as follows: 3.64 g of CTMABr was dissolved in 28.8 g of deionized water, followed by the addition of 9.6 g of sodium silicate solution (35–40%) under stirring. The mixture was adjusted to pH 11 by 2 N HCl solution and transferred to a polypropylene bottle, followed by treatment at 100 °C for 72 h. The resulting white solid was collected by filtration and dried at 55 °C for 24 h and finally heated at 600 °C for 5 h in air at a heating rate of 2 °C/min to remove organic polymer soft-template.
Design of experiment
In the design of the experiment, three factors were evaluated as depicted in . We compared solvent impregnation to spray drying to evaluate selected physicochemical properties of the resulting formulations produced by these processes. Drug load and mesoporous silica pore sizes were varied between 30% (w/w) and 50% (w/w) and 6.5 nm (SBA-15) and 2.5 nm (MCM-41), respectively. Consequently, a 23 factorial design was executed.
Table 1. Formulations based on a 23 factorial design.
Drug-loading methods
Co-spray drying
For 50% (w/w) drug load, 15 g of FEN (Sequioa Research, Reading, UK) was dissolved in 400 mL of ethanol, and 15 g of mesoporous silica was dispersed in the solution under overnight stirring. For 30% (w/w) drug load, 6 g of FEN was co-spray dried with 14 g of mesoporous silica. BÜCHI B-290 mini spray dryer (BÜCHI Labortechnik AG, Flawil, Switzerland) was used for all spray drying operation. The inlet temperature was set to 81 °C and the outlet temperature was approximately 50–55 °C. The feed rate was 4.0 mL/min.
Solvent impregnation
For 50% (w/w) drug load, 10 g of FEN (Sequioa Research) was fully dissolved in 90 mL of ethanol under stirring and heating to 50 ∼ 60 °C. Ten grams of mesoporous silica were added to the FEN solution. For 30% (w/w) drug load, 3.0 g of FEN was dissolved in 45 ml of ethanol. The solution was mixed with 7.0 g of mesoporous silica under manual mixing to form slurry. Ethanol was evaporated by stirring on hot plate with temperature set at 80 °C to obtain mesoporous silica-loaded FEN in the solid powder form.
The samples obtained by co-spray drying and impregnation methods were further dried in vacuum at room temperature. To confirm that solvent was removed, the dried samples were soaked in water and monitored via gas chromatography – flame ionization detector analysis.
Specific surface area determination (N2 adsorption)
Nitrogen adsorption/desorption isotherms were measured by using an Autosorb-6B gas adsorption analyzer (Quantachrome Instruments, Boynton Beach, Florida) at a temperature of –196 °C. Before nitrogen adsorption–desorption measurements, each sample was heated at 40 °C under vacuum overnight. The specific surface areas of the samples were determined from the linear portion of the Brumauer–Emmett–Teller (BET) plots. The mesoporous silica pore size (diameter DBET) distribution (with and without drug loading) was calculated from the desorption branch of N2 adsorption–desorption isotherms using the conventional Barrett–Joyner–Halenda method. The total pore volume, VT, was estimated from the amount adsorbed at a relative pressure of 0.95.
Scanning electronic microscopy
The morphology of mesoporous silica before and after drug loading was examined by field emission scanning electron microscopy (JEOL JSM-6700F, Tokyo, Japan). Samples were loaded and adhered to the double face carbon tape on the sample stub. Prior to analysis, the samples were coated with gold by sputter coating.
Powder flow measurements (ring shear cell)
The Dietmar-Schulze RST-XS (Dietmar-Schulze, Wolfenbüttel, Federal Republic of Germany) annular shear tester was used for measuring powder adhesion and flow properties. It was used with a standard shear cell with a cross sectional area of 24 cm2 and a volume of 12 cm3. Prior to shear stress measurement, pre-shear stress of 1000 Pa was exerted on the sample. Shear stress measurements were taken at normal stresses of 250 Pa, 388 Pa, 525 Pa, 663 Pa and 800 Pa. The flowability value ffc is determined as follows:
ffc = σ1/σc; where σ1 is the consolidation stress; and σc is the unconfined yield strength (Fitzpatrick et al., Citation2004).
Particle size distribution measurements
Particle size distributions and mean particle diameters were measured by static light scattering using a Mastersizer 2000 with Hydro μP adaptor (Malvern Instruments Ltd., Worcestershire, UK). Samples were added to the Hydro μP device filled with water until an “obscuration” between 10 and 20% was reached. The material was sonicated for approximately 60 s before measurement was started at a stirring speed of 850 rpm. Each experiment was conducted in triplicate at ambient temperature.
Powder X-ray diffraction measurements
Powder X-ray diffraction was performed using a D8-ADVANCE (BRUKER, Madison, WI) X-ray diffractometer in steps of 0.02 using Cu Kα radiation as X-ray source. The measurement conditions were as follows: target, Cu; filter, Ni; voltage, 40 kV; current, 10 mA; and scanning speed, 2 °/min.
Thermometric measurements (differential scanning calorimetry)
Differential scanning calorimetry (DSC) was performed using a SDT 2960 simultaneous TGA-DSC thermogravimetric analyzer (TA Instrument, Delaware, USA). The sample (10 mg) was heated from room temperature to 150 °C under nitrogen flow of 100 mL/min with a heating rate of 10 °C.
In vitro dissolution
Dissolution experiments were performed in 900 mL of 25 mM sodium dodecyl sulfate solution in water at 37 °C using an USP apparatus II dissolution bath, VK7010 (Varian Co. Palo Alto, CA), operating at 100 rpm. FEN-loaded mesoporous silica formulation (100 ± 3 mg) was filled into a size 0 gelatin capsule (Capsugel, Bornem, Belgium) and helix sinkers were used to prevent floating of capsules. All dissolution experiments were performed in triplicate under sink conditions. The equilibrium solubility of FEN in the dissolution medium was determined, and the volume of the dissolution medium was selected such that it was more than three times (4.5 times for 50% w/w drug load) the volume needed. Dissolution solutions (10 mL) were automatically collected at 10, 15, 30, 45, 60, 75, 90 and 120 min intervals with an auto-sampler, VK8000 (Varian Co.) and filtered through 1 μm poroplast filter (Quality Laboratory Accessories, Telford, PA). The dissolution samples were analyzed using a high-performance liquid chromatography (HPLC) equipped with a UV-Vis detector (Agilent 1200 series; Agilent Technologies, Santa Clara, CA). Data analyses were performed using Atlas Chromatographic Data System (CDS) (Thermo Scientific, Waltham, MA). A reversed-phase column, Water's Symmetry C18 (4.6 mm × 75 mm, 3.5 μm; Waters, Milford, MA) was used for the analyses. The mobile phase consisted of acidified water (pH 2.5 by phosphoric acid) and acetonitrile at a ratio of 38:62 (v/v). The HPLC analyses were performed with a flow rate of 1.2 mL/min and an injection volume of 10 µL. The detection wavelength was set at 286 nm, and the column working temperature was at 35 °C. The dissolution method was validated for linearity, filter adsorption, accuracy and repeatability.
Drug assay and impurity levels measurements
The drug assay and impurity levels of the formulations were determined by HPLC-UV (Agilent 1200 series; Agilent Technologies) and Atlas CDS (Thermo Scientific) using an Eclipse XDB-C18 column (4.6 mm × 150 mm, 3.5 µm; Agilent Technologies) at a flow rate of 1 mL/min and an injection volume of 10 μL. Sample amount equivalent to 25 mg of FEN was added to 50 mL of acetonitrile. The solution was sonicated for ca. 30 min and was filtered through 0.45 μm PTFE membrane (Whatman, Piscataway, NJ) before analysis. For impurity analysis, the resultant sample solution with a FEN concentration of ca. 0.5 mg/mL was used. A gradient program using mobile phase A (acidified water, pH = 2.5 by phosphoric acid) and mobile phase B (acetonitrile) and at a wavelength of 210 nm were employed. For the first 5 min, a composition of 80% mobile phase A and 20% mobile phase B was set. The mobile phase composition was gradually changed to 30% of mobile phase A and 70% of mobile phase B over the next 10 min. The composition was then rapidly changed back to 80% of mobile phase A and 20% mobile phase B in 1 min and was held at this composition for another 4 min. The total run time was 35 min. For drug assay, sample solution was diluted to ca. 0.05 mg/mL from the impurity sample solution. An isocratic elution using acidified water (pH 2.5 by phosphoric acid) and acetonitrile (30:70, v/v) as the mobile phase, and a wavelength of 286 nm were then employed for the HPLC analyses. Both drug assay and impurity methods were validated for linearity, specificity, accuracy and repeatability.
Moisture measurements
Moisture contents were determined using Karl Fisher Volumetric Titrator (795 KFT Titrino; Metrohm AG, Herisau, Switzerland). Hydranal® Titrant 5 (Fluka) and Hydranal,® Solvent (Fluka) were used as the reagents for the analysis. A sample extraction time of 600 s was used, and the sample amount was ca. 200 mg. The experiments were conducted under ambient conditions. The method was validated for repeatability.
Stability study
The chemical and physical stability of FEN-loaded mesoporous silica formulations were assessed by an accelerated stability study. Two grams of each formulation was placed in a Petri dish wrapped in aluminum foil with pin holes and stored in the stability chamber at 40 °C/75% RH. After storage, samples were evaluated on its physical properties (X-ray diffraction; XRD and DSC), moisture level, drug assay, impurities and in vitro dissolution at 0, 3 and 6 months.
Bioavailability studies in dogs
Animal experiment protocol was approved by the Institutional Animal Care and Use Committee at Abbvie Inc. Bioavailability studies were conducted using randomized cross-over study in a group of six beagle dogs. All the dogs were administered with hand filled hard gelatin capsules containing 100 mg dose of FEN. All doses were administered under fasting conditions, with food returned 12 h after drug administration. Blood samples were withdrawn at 0.25, 0.5, 1, 1.5, 2, 3, 4, 6, 9 and 12 h post dosing from the cephalic vein. Plasma was separated from blood and stored frozen. Fenofibric acid plasma concentrations were determined using HPLC tandem mass spectroscopy after acetonitrile protein precipitation of the plasma samples.
The following pharmacokinetic parameters were assessed: peak plasma concentrations (Cmax), Cmax divided by dose, area under the plasma concentration–time curve (AUC), AUC divided by dose (AUC/D), time to reach Cmax and terminal half-life. AUC up to 12 h post-dose was calculated using the linear trapezoidal rule. The AUC from time zero to infinity was also extrapolated.
Statistical analysis
The data collected from the DOE were analyzed using Minitab 15.1.0.0 (Minitab®, Houston, TX). The effects of factors on responses were evaluated for statistical significance (p < 0.05).
Pharmacokinetic parameters, AUC and Cmax were evaluated employing ANOVA followed by subsequent evaluation on Tukey's test for multiple comparisons with p < 0.05 (GraphPad Prism 6.01, GraphPad Software, Inc., La Jolla, CA).
Results and discussion
Physical properties of FEN-loaded mesoporous silica
The physical properties of mesoporous silica and FEN-loaded mesoporous silica are summarized in . The SBA-15 and MCM-41 have average pore diameters of 6.5 nm and 2.5 nm, respectively. In spite of its smaller pore diameter, MCM-41 has similar pore volume but larger pore surface area as compared to SBA-15. As drug load level increased from 30% to 50%, the surface area and pore volume decreased proportionally presumably due to the mesoporous channels being occupied by the FEN molecules. The maximum theoretical load of FEN inside the pore channel can be calculated as follows (Limnell et al., Citation2007):
Table 2. Physical properties of fenofibrate-loaded mesoporous silica samples.
Based on the density (ρ) of FEN, 1.177 g/cm3 and the pore volume (Vp) of the mesoporous silica, the calculated maximum theoretical load is approximately 57% for both SBA-15 and MCM-41. This value may be an overestimation as the difference between the density of crystalline FEN and amorphous FEN in the pores was not accounted (Limnell et al., Citation2007). Therefore, at 50% (w/w) drug load, the maximum theoretical load could potentially be reached. As shown in , the total pore volume in SBA-15 and MCM-41 was reduced to as low as 0.05 and 0.06 cc/g, respectively, in the co-spray-dried samples. However, pore volumes of solvent-impregnated samples were slightly higher, implying that part of FEN may reside on the external surfaces.
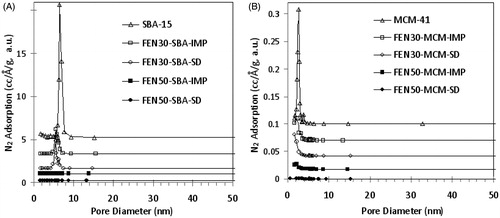
As shown in , SBA-15 and MCM-41 displayed pore size distribution peaks at 6.5 nm and 2.5 nm, respectively. After SBA-15 was loaded with 30% (w/w) FEN, the pore size distribution peak was shifted to 5.5 nm, indicating partial pore space occupancy. Similarly, the pore size distribution peak of MCM-41 was shifted to 1.8 nm or lower. The reduction of pore distribution peak area is consistent with the shrinkage of pore volume. When drug load was increased from 30 to 50% (w/w), the pores were filled with FEN molecules to form solid dispersion with reduced porous structure. Hence, no pore size distribution peak was observed.
Figure 1. Pore size distribution change of (A) SBA-15 and (B) MCM-41 before and after loading of FEN.
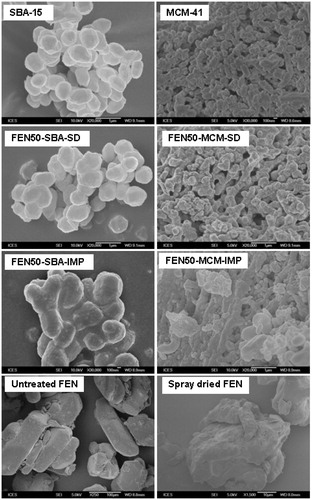
The SEM images of mesoporous silica before and after drug loading are shown in . The morphologies of SBA-15 and MCM-41 remained unchanged after co-spray drying at 30%w/w (not shown) and 50% w/w drug load. No particles were observed at external surfaces of co-spray dried mesoporous silica. The preservation of original morphology of mesoporous silica indicated that most of FEN molecules were encapsulated into the pore structures. For comparison, the SEM image of spray-dried FEN is shown in . However, in 50% (w/w) FEN, mesoporous silica loaded via solvent impregnation, FEN was observed on the external surface of SBA-15 and MCM-41. The FEN remaining on the surface of SBA-15 and MCM-41 caused agglomeration. Moreover, the larger pore volume of solvent-impregnated samples () indicates that FEN remained on the external surface.
Figure 2. The SEM images of mesoporous silica after drug loading.
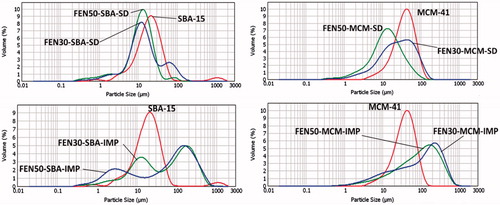
compares the changes of particle size distribution of mesoporous silica before and after drug loading. Particle size distribution of co-spray-dried samples remained similar to mesoporous silica after drug loading. On the other hand, particle size of solvent impregnated samples increased after drug loading. As shown in SEM images, solvent impregnation samples have more drug deposited on the surface of silica particles. The deposited FEN may have tendency to aggregate silica particles. However, there is a limitation to the measurement technique. The particle size measurements were made in water, which may have led to partial dissolution of the amorphous FEN, resulting in supersaturation and possibly precipitation.
Figure 3. Particle size distribution of mesoporous silica before and after drug loading.
list the particle size values of D(0.1), D(0.5), D(0.9) and flow index, ffc of the mesoporous materials before and after drug loading. As seen in , solvent impregnation samples have better flow properties as compared to the co-spray dried samples. According to the ffc values, solvent impregnation samples are easy flowing and will facilitate downstream processing. The low ffc values seen in co-spray-dried samples indicate cohesive nature of materials. Downstream processing of these spray-dried materials will require intermediate steps such as granulation or the addition of flow-enhancing excipients. However, compared to solvent impregnation method, co-spray-drying technique possesses the advantage of combining drug loading and drying processes in one step.
Table 3. Particle size distributions and flow properties of SBA-15 and MCM-41 before and after drug loading.
Physical state of FEN in mesoporous silica
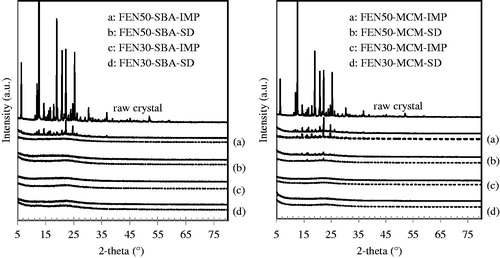
The solid lines in show the XRD patterns of raw FEN crystal and the eight freshly prepared FEN-loaded mesoporous silica. The dotted lines represent the XRD patterns of the respective FEN-loaded mesoporous silica after six months storage at 40 °C/75% RH in open dish. At 30% (w/w) drug load, no XRD diffraction peaks were observed in both co-spray dried and solvent impregnation formulations. This indicates that no crystalline FEN is present within the mesoporous pore channels. The nano-size pores successfully confined FEN molecules in the amorphous state and restricted the molecular mobility of FEN molecules from nucleation to create long-range order. However, at 50% (w/w) drug load, obvious diffraction peaks corresponding to the FEN crystal were seen in solvent-impregnated samples. This suggests that solvent impregnation might have failed to efficiently entrap FEN at high drug load, leaving the exposed FEN on the external surfaces of SBA-15 and MCM-41 vulnerable to re-crystallization. This observation is also consistent with the higher remaining pore volume observed in solvent impregnation samples and also from the SEM images. In comparison, either none or only slight traces of diffraction peaks were seen in 50% (w/w) drug loaded co-spray-dried samples. The higher drug loading efficiency of co-spray drying as compared to solvent impregnation may be largely attributed to the difference in the solvent evaporation event in these two processes (Limnell et al., Citation2011b). The rapid drying of atomized solvent in the spray-drying method appears to be more efficient in incorporating FEN in the pores. In contrast, solvent impregnation may deposit more drug on the particle surface, thus facilitating nucleation to create long-range order during solvent removal by slow evaporation (Charnay et al., Citation2004).
Figure 4. XRD patterns of raw fenofibrate crystal, fenofibrate-loaded SBA-15 and fenofibrate-loaded MCM-41 at initial time-point (solid lines) and after storage at 40 °C/75% RH in open dish after six months (dotted lines).
The DSC results as shown in corroborate the XRD data (). The endothermic peak at ∼ 80 °C is due to the melting of crystalline FEN. The amount of crystallinity in FEN50-SBA-IMP, FEN50-MCM-IMP and FEN50-MCM-SD was estimated from the areas under the endothermic peak using the FEN crystal as a calibration standard. The approximate amounts of crystals are 31%, 37% and 2% for FEN50-SBA-IMP, FEN50-MCM-IMP and FEN50-MCM-SD, respectively. The presence of crystalline FEN is due to the incomplete incorporation of FEN in silica pores, which is evidenced by SEM images of the FEN loaded silica. The high percentages of crystals present in FEN50-SBA-IMP and FEN50-MCM-IMP indicate that solvent impregnation is incapable to fully incorporate FEN in the pores of the mesoporous silica at the high drug load of 50% w/w. In contrast, FEN50-SBA-SD did not show any presence of crystals and that FEN50-MCM-SD shown only 2% crystal, indicating that spray drying is a more effective drug-loading process.
Figure 5. DSC curves of raw fenofibrate crystal, as prepared fenofibrate loaded SBA-15 and fenofibrate-loaded MCM-41, and after storage at 40 °C/75% RH in open dish after six months.
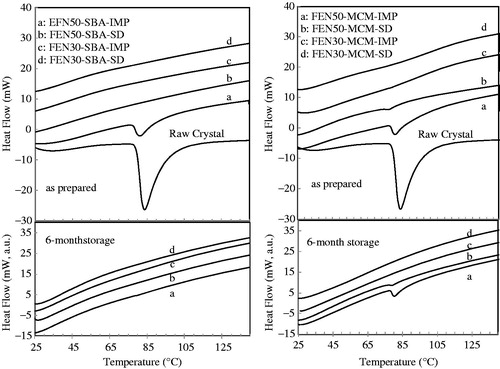
It has been well known that conversion of crystalline drug into its amorphous state can improve its release rate both in vitro and in vivo. Moreover, it is challenging to stabilize amorphous drug during storage as it is of a high energy form and has the tendency to transform to its stable crystalline form. The investigation on the stability of amorphous FEN during storage is thus essential. The dotted lines in illustrate the XRD patterns of the eight formulations after storage at 40 °C/75% RH in open dish for six months. We observed that formulations remained amorphous throughout the storage. Although, some formulation contained crystalline materials in processing, no increase in diffraction peaks was seen upon storage. X-ray diffraction peaks of FEN50-SBA-IMP as seen in disappeared after storage. We postulate that FEN crystals, which were initially detected, converted to its amorphous form under storage condition. It has been reported that crystalline FEN on the silica surface may have diffused through absorbed water into the pores, resulting in the formation of amorphous state (Takeuchi et al., Citation2004; Pan et al., Citation2008). The same observation was also confirmed by DSC analysis in this study, as shown in . The endothermic peak of FEN50-SBA-IMP disappeared after storage. However, stronger explanation is warranted and further investigation is required to fully explain this observation. It appears that excellent physical stability of amorphous FEN under the accelerated storage test conditions is attributed to the confinement of FEN within the uniform silica pores of SBA-15 and MCM-41. This prevented the rearrangement of amorphous FEN molecules into long-range order.
In vitro release experiment
shows the dissolution profiles of FEN from all eight formulations. The dissolution rates of all FEN-loaded mesoporous silica formulations were higher than the crystalline FEN. Formulations from the co-spray dried process ![]() also showed faster release as compared to those from solvent impregnation process
also showed faster release as compared to those from solvent impregnation process ![]() . The spray-dried formulations exhibited rapid release with 70–90% of FEN being release within 15 min. In contrast, the solvent-impregnated formulations exhibited slower release, 30–50% FEN being released within 15 min. The improved dissolution of FEN is largely due to the amorphous state of FEN in the mesoporous channels. These results are in agreement with XRD and DSC measurements, whereby formulations with detectable crystallinity (i.e. FEN50-SBA-IMP and FEN50-MCM-IMP) underwent slower dissolution release rate as compared to their fully amorphous counterparts.
. The spray-dried formulations exhibited rapid release with 70–90% of FEN being release within 15 min. In contrast, the solvent-impregnated formulations exhibited slower release, 30–50% FEN being released within 15 min. The improved dissolution of FEN is largely due to the amorphous state of FEN in the mesoporous channels. These results are in agreement with XRD and DSC measurements, whereby formulations with detectable crystallinity (i.e. FEN50-SBA-IMP and FEN50-MCM-IMP) underwent slower dissolution release rate as compared to their fully amorphous counterparts.
Figure 6. In vitro dissolution profiles of FEN. Mean and standard deviation are depicted (n = 3).
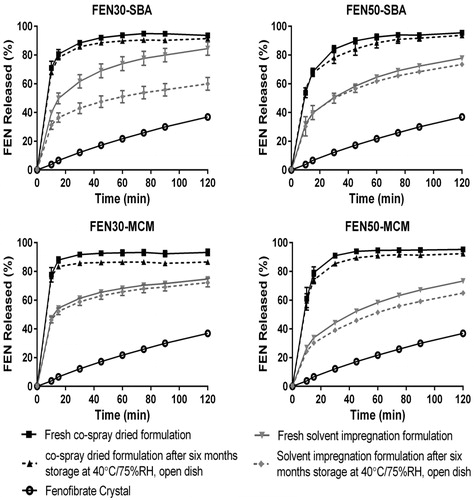
A statistical analysis of FEN 30-min release data indicate that drug-loading process (p = 0.044) is the only significant factor. No interaction among factors was observed. Co-spray drying seemed to enhance dissolution significantly better than solvent impregnation for samples with same drug loading. Although both processes are capable of producing amorphous FEN at 30% w/w drug load, co-spray-dried formulations out performed solvent impregnation formulations in all instances. Thus, the difference in dissolution profile observed cannot be explained by the crystalline fraction of FEN alone in the silica particle but is more likely due to the method of drug loading. A possible reason for this observation can also be due to the smaller particle size of co-spray dried formulations. It has been well studied that a decrease in particle size will result in the shortening of diffusion path length for the drug molecule, thus resulting in enhanced dissolution rate (Qu et al., Citation2006; Cauda et al., Citation2008).
From the statistical analysis, pore size and percent drug load do not affect the in vitro dissolution rate of FEN. Contrary to most reported findings, a bigger pore size should have allowed a faster diffusion of drug out of the pores of the silica (Andersson et al., Citation2004; Limnell et al., Citation2007; Van Speybroeck et al., Citation2010). This was not observed in our case as the larger surface area of MCM-41 could have compensated for its smaller pore diameter by attracting more water to its pores for drug dissolution. Percent drug load also showed no influence in vitro. Although percent drug load also showed no influence in vitro, increase in bioavailability was observed in 30% w/w drug load compared to 50% w/w drug load in vivo. The in vitro test conditions were meant to be a quality control tool and not for biorelevancy.
The dotted lines in represent the dissolution profiles of formulations stored at 40 °C/75% RH in open dish for six months. All stressed formulations, except FEN30-SBA-IMP, appear to overlap with the initial profiles substantiating the physical stability of the formulations. However, the reduced dissolution rate observed in FEN30-SBA-IMP, which has a p value < 0.05, is an anomaly. The reduction in dissolution rate is inconsistent with the XRD diffractogram, DSC profiles and absence of reduction in anhydrous drug or absence of additional impurities upon storage. More work will be required to understand this anomaly.
Chemical stability
The surface of mesoporous silica is populated by acidic functional groups, which can catalyze many chemical reactions and cause degradation of some drugs. However, to date, very limited studies have been conducted on the chemical stability of silica-based drug formulations (Limnell et al., Citation2011a). We thus performed stability studies on the FEN-loaded silica formulations under accelerated conditions of 40 °C/75% RH in open dish. In addition, we also performed drug assay, impurity and moisture analyses at initial and six-month time points. As shown in , the moisture levels generally increase upon storage, perhaps due to the hydrophilic nature of silica. Therefore, the drug assay results were normalized with the moisture level to determine the anhydrous drug load.
Table 4. Chemical stability of the samples.
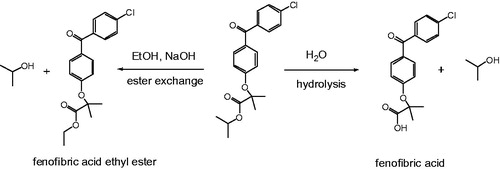
All formulations exhibited excellent chemical stability as evidenced from results in . No significant changes in drug assay were observed for all the formulations. The % impurities for the eight formulations are in the range of 0.08–0.60% (six months) as compared to the initial range of 0.06–0.45%. Two main impurities with relative retention time (RRT) of 0.64 and 0.88 were observed. The impurity with a RRT of 0.88 was only observed in formulations containing MCM-41 and did not increase after six-month storage. We elucidated the impurity structures as shown in . We purchased fenofibric acid commercially and synthesized fenofibric acid ethyl ester from FEN in our laboratory. The retention times of the impurities observed in the stability samples were tested against those of the authentic materials by the HPLC method. The retention time of fenofibric acid and fenofibric acid ethyl ester matched those of RRT 0.64 and RRT 0.88 impurity, respectively. It appears that fenofibric acid was generated by the hydrolysis of FEN, whereas the formation of fenofibric acid ethyl ester was generated by reaction of FEN with residual ethanol. The synthesis of MCM-41 involves the use of sodium hydroxide, and the presence of residual sodium hydroxide may serve as a catalyst for the formation of these two major impurities. This may explain why these two impurities are higher in the MCM-41 formulations.
Figure 7. Possible degradation pathways of fenofibrate.
In vivo study
Based on all the formulations' in vitro performance, only three formulations, FEN30-SBA-SD, FEN50-SBA-SD and FEN50-MCM-SD, were selected for animal dosing. Crystalline FEN was also dosed to serve as a control. The mean plasma FEN concentration versus time profile is illustrated in . The summary of all the pharmacokinetic parameters are listed in . As observed from the pharmacokinetic profile, all the formulations performed much better than the crystalline FEN. The Cmax for FEN30-SBA-SD was the highest among all the formulations at 9.15 µg/ml, almost two-fold higher than the 4.89 µg/ml observed in FEN50-SBA-SD. This is followed by FEN50-MCM-SD at 1.88 µg/ml and crystalline FEN at 0.023 µg/ml, respectively. It should also be noted that in terms of AUC/D, FEN30-SBA-SD also exhibited the highest AUC/D at 5.05 µg × hr/ml per mg/kg, more than two-fold of FEN50-SBA-SD at 2.22 µg/ml per mg/kg and FEN50-MCM-SD at 1.34 µg/ml per mg/kg. As expected, crystalline FEN has the lowest AUC/D at 0.38 µg/ml per mg/kg, less than 13-fold of FEN30-SBA-SD. From the pharmacokinetic profile, it appears that FEN30-SBA-SD exhibited significantly much better performance as compared to all other formulations, with p value < 0.05 for Cmax and AUC/D. The performance rank order: FEN30-SBA-SD > FEN50-SBA-SD > FEN50-MCM-SD > FEN crystal for Cmax and AUC/D; however, no quantitative in vitro–in vivo correlation was attempted.
Figure 8. Average plasma concentration versus time profile of fenofibric acid after dosing in fasted dogs.
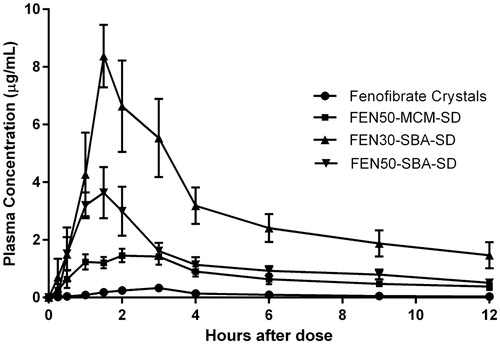
Table 5. Summary of fenofibric acid pharmacokinetic parameters after oral administration of fenofibrate to beagle dogs.
FEN30-SBA-SD's statistically significant increase in bioavailability as compared to FEN50-SBA-SD and FEN50-MCM-SD is an interesting observation. Having lower drug load, the pores in FEN30-SBA-SD are less hydrophobic in nature, thus, allowing faster intestinal fluid penetration into the pores and increasing the dissolution of FEN (Smirnova et al., Citation2003). As a result, more FEN diffused out of the pores and increase the bioavailability. Recrystallisation was also prevented with increased diffusion as the drug is present in the nano-sized pore, and supersaturation can be attained in a gradual and substantial amount. As compared to FEN crystal, FEN30-SBA-SD is expected to perform more favorably as it is present in amorphous state, which is generally known for its increased dissolution profile.
In the previous study by Van Speybroeck et al. (Citation2010), rat model was used to evaluate solvent-impregnated FEN-loaded mesoporous silica. According to their findings, the formulation using MCM-41 mesoporous silica demonstrated highest AUC followed by SBA-15 mesoporous silica. It was hypothesized that the high AUC observed in smaller pore size mesoporous silica was attributed to the slower release of MCM-41 formulations. The slow release resulted in a more sustained supersaturation in the intestine and enhances bioavailability. However, in our work, formulations with larger pore size (SBA-15) do not seem to differ statistically (p > 0.05) from smaller pore size (MCM-41). The lack of difference may be due to the use of a different animal model, whereby larger animal models, beagle dogs, were used in this study as compared to rats models in Van Speybroeck et al (Kararli, Citation1995; Van Speybroeck et al., Citation2010). Moreover, the difference may also be attributed to the different drug-loading methods. Nevertheless, more investigations maybe required to understand the effect of drug-loading methods on in vivo outcome.
Conclusion
We studied the three important aspects of mesoporous silica drug delivery systems: stability, manufacturability and bioavailability. The results indicated that up to 50% (w/w) FEN can be loaded onto the mesoporous silica in amorphous form and exhibits good physicochemical stability, manufacturability and enhanced bioavailability. With respect to the two drug-loading processes studied, co-spray drying of FEN with mesoporous silica was proven to be the more robust and effective technique in enhancing the dissolution and bioavailability of high drug load FEN. Being an industrial technique capable of loading up to 50% (w/w) drug load, co-spray drying of drug in mesoporous silica may prove to be an attractive technique to be studied for other poorly water soluble compounds.
Acknowledgements
The authors are also thankful for the technical assistance from Ms. Low Yan Ling Shawn.
Declaration of interest
The authors and scientists from AbbVie (formerly Abbott) Private Limited, Singapore, AbbVie Inc. and Institute of Chemical and Engineering Sciences (ICES) designed the study and analyzed and interpreted the data. The authors gratefully acknowledge the financial support provided by AbbVie Private Limited, Singapore, and Economic Development Board, Singapore. All authors contributed to the development of the content. The authors and AbbVie reviewed and approved the publication; the authors maintained control over the final content. S. H., D. C. T. T., X. L., A. W. I., S. A. N., K. M. and R. G. are employees of AbbVie and may own AbbVie stock. S. S., W. K. N., L. S. O. C. and R. T. are employees of Institute of Chemical and Engineering Sciences and have no additional conflicts of interest to report.
References
- Andersson J, Rosenholm J, Areva S, Lindén M. (2004). Influences of material characteristics on ibuprofen drug loading and release profiles from ordered micro- and mesoporous silica matrices. Chem Mater 16:4160–7
- Beck JS., Vartuli JC, Roth WJ, et al. (1992). A new family of mesoporous molecular sieves prepared with liquid crystal templates. J Am Chem Soc 114:10834–43
- Breitenbach J. (2002). Melt extrusion: from process to drug delivery technology. Eur J Pharm Biopharm 54:107–17
- Cauda V, Onida B, Platschek B, et al. (2008). Large antibiotic molecule diffusion in confined mesoporous silica with controlled morphology. J Mater Chem 18:5888–99
- Charnay C, Bégu S, Tourné-Péteilh C, et al. (2004). Inclusion of ibuprofen in mesoporous templated silica: drug loading and release property. Eur J Pharm Biopharm 57:533–40
- Fitzpatrick JJ, Barringer SA, Iqbal T. (2004). Flow property measurement of food powders and sensitivity of Jenike's hopper design methodology to the measured values. J Food Eng 61:399–405
- Gupta P, Bansal AK. (2005). Spray drying for generation of a ternary amorphous system of celecoxib, PVP, and meglumine. Pharm Dev Technol 10:273–81
- Heikkila T, Salonen J, Tuura J, et al. (2007). Evaluation of mesoporous TCPSi, MCM-41, SBA-15, and TUD-1 materials as API carriers for oral drug delivery. Drug Deliv 14:337–47
- Horcajada P, Rámila A, Pérez-Pariente J, et al. (2004). Influence of pore size of MCM-41 matrices on drug delivery rate. Microporous Mesoporous Mater 68:105–9
- Jamzad S, Fassihi R. (2006). Role of surfactant and pH on dissolution properties of fenofibrate and glipizide – a technical note. AAPS PharmSciTech 7:E17–E22
- Kararli TT. (1995). Comparison of the gastrointestinal anatomy, physiology, and biochemistry of humans and commonly used laboratory animals. Biopharm Drug Dispos 16:351–80
- Kaushal AM, Gupta P, Bansal AK. (2004). Amorphous drug delivery systems: molecular aspects, design, and performance. Crit Rev Ther Drug Carrier Syst 21:133–93
- Limnell T, Heikkila T, Santos HA, et al. (2011a). Physicochemical stability of high indomethacin payload ordered mesoporous silica MCM-41 and SBA-15 microparticles. Int J Pharm 416:242–51
- Limnell T, Riikonen J, Salonen J, et al. (2007). Surface chemistry and pore size affect carrier properties of mesoporous silicon microparticles. Int J Pharm 343:141–7
- Limnell T, Santos HA, Makila E, et al. (2011b). Drug delivery formulations of ordered and nonordered mesoporous silica: comparison of three drug loading methods. J Pharm Sci 100:3294–306
- Lipinski CA, Lombardo F, Dominy BW, Feeney PJ. (2001). Experimental and computational approaches to estimate solubility and permeability in drug discovery and development settings. Adv Drug Deliv Rev 46:3–26
- Mellaerts R, Mols R, Jammaer JA, et al. (2008). Increasing the oral bioavailability of the poorly water soluble drug itraconazole with ordered mesoporous silica. Eur J Pharm Biopharm 69:223–30
- Munoz A, Guichard JP, Reginault P. (1994). Micronised fenofibrate. Atherosclerosis 110:S45–8
- Muñoz B, Rámila A, Pérez-Pariente J, et al. (2002). MCM-41 organic modification as drug delivery rate regulator. Chem Mater 15:500–3
- Pan X, Julian T, Augsburger L. (2008). Increasing the dissolution rate of a low-solubility drug through a crystalline-amorphous transition: a case study with Indomethicin. Drug Dev Ind Pharm 34:221–31
- Qu F, Zhu G, Huang S, et al. (2006). Controlled release of Captopril by regulating the pore size and morphology of ordered mesoporous silica. Microporous Mesoporous Mater 92:1–9
- Salonen J, Laitinen L, Kaukonen AM, et al. (2005). Mesoporous silicon microparticles for oral drug delivery: loading and release of five model drugs. J Control Release 108:362–74
- Serajuddin AT. (1999). Solid dispersion of poorly water-soluble drugs: early promises, subsequent problems, and recent breakthroughs. J Pharm Sci 88:1058–66
- Shen SC, Ng WK, Chia L, et al. (2010). Stabilized amorphous state of ibuprofen by co-spray drying with mesoporous SBA-15 to enhance dissolution properties. J Pharm Sci 99:1997–2007
- Shen SC, Ng WK, Chia L, et al. (2011). Physical state and dissolution of ibuprofen formulated by co-spray drying with mesoporous silica: effect of pore and particle size. Int J Pharm 410:188–95
- Smirnova I, Mamic J, Arlt W. (2003). Adsorption of drugs on silica aerogels. Langmuir 19:8521–5
- Song SW, Hidajat K, Kawi S. (2005). Functionalized SBA-15 materials as carriers for controlled drug delivery: influence of surface properties on matrix−drug interactions. Langmuir 21:9568–75
- Takeuchi H, Nagira S, Yamamoto H, Kawashima Y. (2004). Solid dispersion particles of tolbutamide prepared with fine silica particles by the spray-drying method. Powder Technology 141:187–95
- Takeuchi H, Nagira S, Yamamoto H, Kawashima Y. (2005). Solid dispersion particles of amorphous indomethacin with fine porous silica particles by using spray-drying method. Int J Pharm 293:155–64
- Vallet-Regi M. (2006). Ordered mesoporous materials in the context of drug delivery systems and bone tissue engineering. Chemistry 12:5934–43
- Vallet-Regi M, Balas F, Arcos D. (2007). Mesoporous materials for drug delivery. Angew Chem Int Ed Engl 46:7548–58
- Vallet-Regi M, Rámila A, Del Real RP, Pérez-Pariente J. (2000). A new property of MCM-41: drug delivery system. Chem Mater 13:308–11
- Van Speybroeck M, Barillaro V, Thi TD, et al. (2009). Ordered mesoporous silica material SBA-15: a broad-spectrum formulation platform for poorly soluble drugs. J Pharm Sci 98:2648–58
- Van Speybroeck M, Mellaerts R, Mols R, et al. (2010). Enhanced absorption of the poorly soluble drug fenofibrate by tuning its release rate from ordered mesoporous silica. Eur J Pharm Sci 41:623–30
- Watanabe T, Wakiyama N, Usui F, et al. (2001). Stability of amorphous indomethacin compounded with silica. Int J Pharm 226:81–91
- Yang C, Xu X, Wang J, An Z. (2012). Use of the co-grinding method to enhance the dissolution behavior of a poorly water-soluble drug: generation of solvent-free drug-polymer solid dispersions. Chem Pharm Bull (Tokyo) 60:837–45
- Zhao D, Huo Q, Feng J, et al. (1998). Nonionic triblock and star diblock copolymer and oligomeric surfactant syntheses of highly ordered, hydrothermally stable, mesoporous silica structures. J Am Chem Soc 120:6024–36