
Abstract
Background: After the health reform in 2003, a need emerged to monitor patient satisfaction in Turkey.
Objective: To evaluate patient satisfaction with family practice in Turkey and compare with some other European countries.
Methods: The study was performed on a countrywide representative sample from all the 81 provinces of Turkey. Data were collected during the years 2010–2012 from patients visiting family practice centres. A three-year repeated cross-sectional study was conducted using the EUROPEP instrument. Twenty-six questions with a five-point Likert scale were applied. Primary outcome measures of the study were the mean EUROPEP scores (min. 1, max. 5).
Results: Mean (± SD) EUROPEP scores for the years 2010 (n = 34 472), 2011 (n = 34 764), and 2012 (n = 32 667) were 4.09 ± 0.77, 4.29 ± 0.59, and 4.42 ± 0.54 respectively (F = 1565.37; P < 0.001). The mean satisfaction percentage was calculated as 88.3%. Areas of lowest satisfaction were ‘Being able to speak to the GP on the telephone,’ ‘Getting through to the practice on the phone,’ and ‘Physical conditions of the family practice.’
Conclusion: Although in small increments, patient satisfaction with family practices in Turkey has increased during the last few years.
Healthcare models are increasingly considering the inclusion of patients in decision making and service provision.
In Turkey, patient satisfaction with family practice shows an increasing trend with satisfaction rates around 90%.
Important areas for quality improvement efforts pertaining to family practice centres in Turkey are related to accessibility of the practice.
INTRODUCTION
Similar to most countries, the main constitution of Turkey defines ‘Establishing the wealth, peace, and happiness of an individual as well as the population’ as one of the main duties of the state (Citation1). The state may accomplish this duty by imposing rules and regulations or directly providing necessary services. It is in accordance with the concept of total quality management to continuously monitor and improve the quality of the services (Citation2). This approach suggests the involvement of all stakeholders and their opinions, including the people who receive the service (Citation3). Particularly after the health reform in 2003, a need to monitor patient satisfaction in Turkey emerged.
Healthcare models are increasingly considering the inclusion of patients in both decision making and service provision (Citation4). For this purpose, it is suggested to determine the expectations, needs, and priorities of patients (Citation5). However, surveying patient satisfaction and feedback are of equal importance (Citation6). Patient satisfaction surveys are frequently employed (Citation7,Citation8), and are also regarded as an indirect indicator for evaluating outcomes of the healthcare services (Citation9).
The aim of this study was to evaluate patient satisfaction with family practice centres in Turkey by using the EUROPEP Instrument making comparisons between the years 2010 and 2012. Furthermore, a comparison between Turkey and other European countries pertaining to some demographic variables was also conducted. Although the tool used is validated for Turkey, additional questions were asked for collecting general opinions suitable to Turkish culture.
METHODS
Study design
A repeated cross-sectional study design was applied. Using a questionnaire, data was collected about the patients’ satisfaction with family practice centres using the EUROPEP instrument. The study was funded by the Turkish Ministry of Health, General Directorate for Health Related Research (Project Reference no. A.4.4.1/SAGEM/17).
The EUROPEP instrument
The ‘European Patients Evaluate General/Family Practice’ (EUROPEP) instrument was developed by the ‘European Working Party on Quality in Family Practice’ (EQuiP, http://www.equip.ch) in 1999 (Citation5). Previous surveys were published in Turkey (Citation10,Citation11). The instrument is still used in many European countries (Citation12–16).
The instrument was adapted for use in Turkey and (Citation17) used to measure patient satisfaction (Citation18). In the EUROPEP instrument, patients are asked to evaluate their most frequently visited family physician during the last six months based on 23 Likert-scale questions (1 = poor, 5 = excellent). The first 16 questions evaluate clinical behaviour, while the remaining questions evaluate service organization in five dimensions: 1. doctor–patient relationship; 2. health services; 3. information and support; 4. organization of health services; and 5. accessibility (Citation19,Citation20).
In this study, three additional questions were asked to make a general evaluation of the family practice. The questions were selected considering Turkish culture and previous surveys conducted by the Ministry of Health; ‘Question 24: How would you grade the general behaviour of the doctor in the family practice?’, ‘Question 25: How would you grade the health services given in this family practice in general?’, and ‘Question 26: How would you grade the physical conditions of this family practice in general?’
Sample size calculation and sampling method
Sample size was calculated using the square root sampling method based on city population, urban/rural population, and male/female population ratios (Citation21). For example, with 95% confidence and 3% difference, a necessary sample size of 29 977 participants was calculated for the 2012 survey. However, effective sample sizes were always higher than calculated. Urban/rural differentiation was according to the records of the Turkish Institute for Statistics (http://www.tuik.gov.tr). Districts with a population of < 20 000 people were regarded as rural.
A multi-layered sampling method was applied. First, the family practice centres were selected randomly using lists obtained from local health directorates. In total, 1501 practices needed to be visited. Second, patients visiting each family practice were selected based on systematic random sampling; every second patient was included.
Data collection
Data collection was performed in 2010–2012 during the autumn. The survey instrument was applied face-to-face by trained and experienced surveyors on exiting the family practice centre. Inclusion criteria were patients visiting family practice centres, aged 18 years or above, and mentally able to respond to the questions. Verbal consent was acquired from all participants.
Collected data were fed into the computer and checked for consistency using computer software. Error checking was applied before starting data analysis. Data for 34 472, 34 764, and 32 667 participants was available for analysis for the years 2010, 2011, and 2012, respectively.
Statistical analysis
The main outcome measure of the study was mean EUROPEP scores. Descriptive statistics (n, % or mean ± standard deviation), Chi square analysis, independent samples t-test and one-way ANOVA were applied for the analysis. The normal distribution for numerical data was checked. The variable ‘Yearly number of visits to the family practice’ was right skewed.
Internal consistency of the instrument was checked with Cronbach alpha. Pareto analysis was applied to check for reasons for dissatisfaction in the EUROPEP items. Data was analysed using the SPSS 20.0 software.
Differences between regions were compared after NUTS classification (Nomenclature des unités territoriales statistiques) (Citation22).
Satisfaction scores were calculated by taking the average of the Likert scores of the following questions: Doctor–patient relationship (Q1–6), health services (Q7–11), information and support (Q12–15), organization of health services (Q16,17), accessibility (Q18–23), general satisfaction (Q24–26), EUROPEP score (Q1–23), and all questions (Q1–26). Likert responses four and five were categorized as ‘satisfied’ whereas responses one and two were categorized as ‘dissatisfied.’ Score three was categorized as ‘average.’
RESULTS
Descriptive statistics
Internal consistency (Cronbach alpha) of the questionnaire was calculated as 0.96. In 2010, 2011 and 2012, 34 472, 34 764 and 32 667 participants joined the study, respectively. The response rate for patients was 83.1%. Sex distribution was almost equal (50 976 females vs 50 927 males). Distribution of rural/urban settlement was 11 896 (11.7%)/90 007 (88.3%). For the 2012 data, the mean age was 41.51 ± 15.49 years (min. 18; max. 92). The geometric mean for the number of visits to the family practice was 6.45 ± 2.46 (median = 6). Distribution of illiterates, primary school, high school, and university graduates was 2879 (8.8%), 17 745 (54.3%), 7311 (22.4%), and 4732 (14.5%), respectively.
Patient satisfaction
For the year 2012, patient satisfaction was high in all domains ().
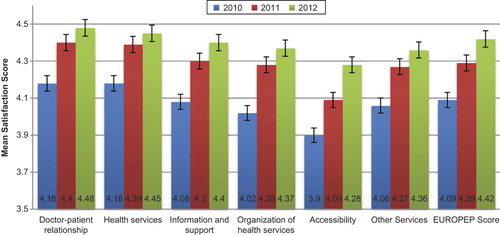
Comparison of EUROPEP scores between the different NUTS regions showed mean values from 4.28 ± 0.55 (Middle East Anatolia) to 4.56 ± 0.45 (West Marmara) (ANOVA F = 52.803; P < 0.001). Tamhane post-hoc comparisons showed that mean scores for Middle East Anatolia were lower than all other regions (P < 0.01).
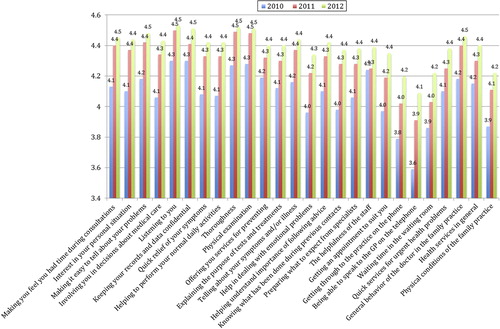
Separate analyses of individual questions showed an increase in satisfaction throughout the years. All questions for 2012 had mean scores greater than four. Questions with least scores were ‘Being able to speak to the GP on the telephone,’ ‘Getting through to the practice on the phone,’ and ‘Physical conditions of the family practice,’ respectively ().
The increase in mean satisfaction scores throughout the years (4.09 ± 0.77, 4.29 ± 0.59, and 4.42 ± 0.54 for 2010, 2011, and 2012, respectively) was statistically significant (ANOVA F = 1565.370; P < 0.001). Compared with independent t-test, the difference was significant between all three years (P < 0.001).
Women had significantly higher mean number of family practice centre visits compared to men (6.75 ± 2.4 vs 6.03 ± 2.5) (t = 20.07; P < 0.001). Mean EUROPEP scores for men and women were almost the same; however the difference was statistically significant (4.28 ± 0.63 vs 4.29 ± 0.65; t = 2.417, P = 0.016). Also the difference between rural/urban satisfaction (4.13 ± 0.77 vs 4.30 ± 0.62, respectively) was low and statistically significant (t = 20.691; P < 0.001).
Primary school graduates had significantly higher mean satisfaction scores compared with the individuals belonging to other education categories (illiterate, primary school, high school, and university 4.26 ± 0.63, 4.34 ± 0.62, 4.23 ± 0.69, and 4.25 ± 0.68, respectively. ANOVA F = 128.1; P < 0.01).
Reasons for dissatisfaction
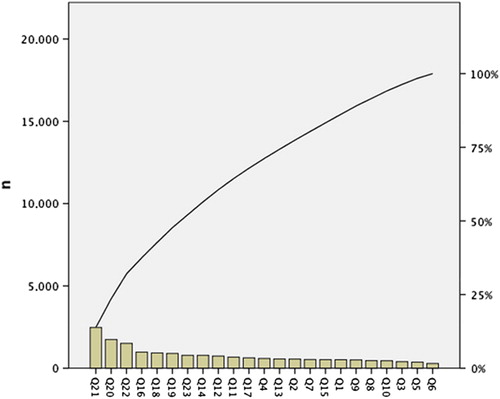
Using the 2012 data, a Pareto analysis was performed based on the EUROPEP questions to check for cumulative reasons of dissatisfaction. The six most important reasons leading to dissatisfaction ‘Being able to speak to the GP on the telephone’ (n = 2 475, 13.8%); ‘Getting through to the practice on the phone’, (n = 1 744, 9.7%); ‘Waiting time in the waiting room’, (n = 1 510, 8.4%); ‘Knowing what has been done during previous contacts’, (n = 982, 5.5%); ‘The helpfulness of the staff’ (n = 929, 5.2%); ‘Getting an appointment to suit you’ (n = 898, 5.0%) accounted for 47.7% of the patient dissatisfaction reasons ().
Moreover, when the responses as satisfied/dissatisfied were categorized, a gradual increase was observed in the satisfaction percentages throughout the years (), which was statistically significant for all questions (Chi square P < 0.001).
Table 1. Satisfaction percentages based on individual study questions throughout the years..
European comparison
A study evaluating patient satisfaction in eight European countries with the EUROPEP instrument was done in 2011 (Citation12). This study had a sample of 7492 patients from 251 practices. Categorization of satisfied/dissatisfied was same as in our study. Comparison of the data from our 2012 study with the European data is shown in and .
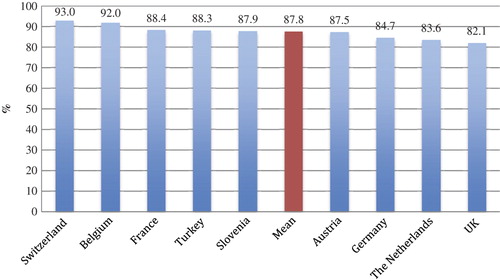
Table 2. Comparison of mean EUROPEP satisfaction percentages between European countries based on individual questions (Data of 2011).
DISCUSSION
Main findings
This study revealed a high satisfaction rate with primary care health services in Turkey. Middle East Anatolia has comparatively lower patient satisfaction scores. Since this geographic area of Turkey is economically less developed, we may conclude that this region has priority not only for economic development but also for primary care services.
Patient satisfaction
Patient satisfaction is regarded as one of the outcome indicators in evaluating and improving the quality of care of medical services (Citation23). Among the investigated domains, highest satisfaction was observed in the ‘doctor–patient relationship.’ The health reform initiated in 2003 (Health Transformation Project (Citation24) reorganized the delivery of healthcare services introducing patient lists and per capita payment instead of the formerly geographically defined and fixed salary-based system. The nature of the new system, putting patients to the forefront is probably one of the important factors increasing the continuity of care and communication between doctor and patient. ‘Accessibility’ of health care services on the other hand, received a relatively lower satisfaction (). Among the items defining the ‘accessibility’ dimension are questions about appointments, accessing via telephone, and waiting time in the office. In our opinion, this result is related to the health system and expectations of Turkish patients. First, there is almost no obligatory appointment system in Turkey. Patients see the doctor on a first come, first served basis. Hence, during crowded times patients may need to wait some time to see the doctor. In addition, telephone accessibility is not guaranteed in Turkey.
The consistent increase in the satisfaction rates throughout the years () suggests a gradual improvement in the services. This may be a joint product because of the continuity of care throughout the years and other changes in the healthcare system. Health reforms implemented after the year 2003 aimed to follow up all citizens registered in the system by one doctor in a biopsychosocial approach (Citation25). Patients are allowed to choose their family doctors, and doctors serve to a known list of population, which may be the reason for the satisfaction of both sides. Gradual improvements have been made concerning physical conditions, infrastructure, and technical facilities. Mobile health services for rural areas with difficulties in access to care and optional appointment system for family physicians are other improvements in the system, the latter being a more recent change.
The fact that women have higher mean health visits compared to men is a well-known entity (Citation26). There is no viable literature about gender differences in patient satisfaction (Citation27–29).
Main reasons for dissatisfaction
Pareto analysis helps to identify the top portion of causes that need to be addressed to resolve the majority of problems (Citation30). As expected, five out of the most important six reasons of dissatisfaction were related with the accessibility of health services (). ‘Knowing what has been done during previous contacts’ and ‘The helpfulness of the staff’ are items that require extra attention. Although, there is an electronic health record system connected online to a central repository in all family practice centres, high patient load and visiting without appointment may be reasons why the doctor is seemingly less informed about previous contacts. For the year 2012, the mean number of patients seen by family physicians in a day is reported as 42 (Citation31).
In the current practice, each family physician is working together with only one colleague (nurse or midwife), which makes it difficult for the staff to interact and help patients.
International comparison
Having a recent study conducted in Europe with a very similar methodology gives us the opportunity to make direct comparisons of our results (). Turkey's average satisfaction rates are better than six of the eight studied countries (Citation12), which can be regarded as an indicator that there was an enormous surge to close the gap with European countries during the last few years.
Most of the European reports point out that the waiting time is a reason for dissatisfaction with the family physician. In addition, the Italian study reports time in the waiting room as an exception, for which only 16% of the respondents expressed the highest level of satisfaction (Citation16). The natural consequence of coming without an appointment is waiting. We think this is a cultural issue, which may change over time.
Strengths and limitations
One of the important strengths of this study is its sample size and sampling method, which indicate a representation of the Turkish population. Alternatively, some limitations of the study can be listed as follows: the study was applied to patients visiting the family physician. Hence, satisfaction in this study refers to the satisfaction of people utilizing the family health centres.
In extraordinary situations, the Turkish health system allows patients to visit physicians other than those they are registered to. We did not check the patients’ registration status to the relevant family physicians.
For the years 2011 and 2012, data were collected from adults aged 18 years and above. However, in the 2010 data there were some participants included who were aged between 15 and 18 years.
This study may be criticized for being too resource consuming. The sample size was extraordinary high due to the sampling method chosen to represent not only Turkey in general but also each of the 81 cities.
Conclusion
Concluding, the health service in Turkey is improving and has reached a comparable level with other European countries. However, results also indicate that there are still some areas left to improve. Introducing a working appointment system for family physicians, adding extra staff to assist the consultation process, and enabling access to the offices and family physician by phone, will further improve the satisfaction rates.
ACKNOWLEDGEMENTS
The authors thank Jelle Stoffers for his valuable comments in editing the manuscript.
FUNDING
This work was supported by funding from the Ministry of Health, General Directorate for Health Related Research.
Declaration of interest: The authors report no conflicts of interest. The authors alone are responsible for the content and writing of the paper.
References
- Turkish Constitution—Title 5. Aims and duties of the State. Available at: https://www.tbmm.gov.tr/anayasa/anayasa_2011.pdf (accessed 10 July 2013).
- Marotta A. Total quality: Priority objective to improve the services of health facilities. Professioni infermieristiche 1998;51:41–5.
- Calkin C. Change management. Quality is a target for the total team. Health Serv J. 2012;122:19–21.
- Çoruh M. Total quality management in primary care practice. Ankara: Haberal EğitimVakfı; 1996.
- Grol R, Wensing M, Mainz J. Patients’ priorities with respect to general practice care: An international comparison. European Task Force on patient evaluations of general practice (EUROPEP). Fam Pract. 1999;16:4–11.
- Wensing M, Vedsted P, Kersnik J. Patient satisfaction with availability of general practice: An international comparison. Int J Qual Health Care 2002;14:111–8.
- Levin R. Measuring patient satisfaction. JADA 2005;136:362–3.
- Ervin NE. Does patient satisfaction contribute to nursing care quality? J Nurs Adm. 2006;36:126–30.
- Öztek Z. Quality in Primary care health services. Ankara: Haberal Eğitim Vakfı; 1995.
- Mollahaliloğlu S, Kosdak M, Sanisoğlu Y, Boz D, Demirok AB. Report on patient satisfaction from primary care services. Akdağ R, editor. Ankara: Hıfzıssıhha Mektebi Müdürlüğü; 2010.
- Mollahaliloğlu S, Kosdak M, Sanisoğlu Y, Ateşoğlu D, Çiftçi E, Tuncel T. Patient satisfaction in primary care services, 2011. Akdağ R, editor. Ankara: Hıfzıssıhha Mektebi Müdürlüğü; 2011.
- Petek D, Kunzi B, Kersnik J, Szecsenyi J, Wensing M. Patients’ evaluations of European general practice—revisited after 11 years. Int J Qual Health Care 2011;23:621–8.
- Grol R, Wensing M. Patients evaluate general/family practice: The EUROPEP instrument. Nijmegen: Center for Quality of Care Research; 2000.
- Klingenberg A, Bahrs O, Szecsenyi J. How do patients evaluate general practice? German results from the European project on patient evaluation of general practice care (EUROPEP). Z Arztl Fortbild Qualitatssich. 1999;93:437–45.
- Kersnik J, Svab I, Vegnuti M. Frequent attenders in general practice: Auality of life, patient satisfaction, use of medical services and GP characteristics. Scand J Prim Health Care 2001;19:174–7.
- Milano M, Mola E, Collecchia G, Carlo AD, Giancane R, Visentin G, et al. Validation of the Italian version of the EUROPEP instrument for patient evaluation of general practice care. Eur J Gen Pract. 2007;13:92–4.
- Akturk Z, Dagdeviren N, Sahin EM, Ozer C, Yaman H, Goktas O, et al. Patients evaluate doctors: The EUROPEP instrument. Dokuz Eylul Medical Journal 2002;16:153–60.
- Dagdeviren N, Akturk Z. An evaluation of patient satisfaction in Turkey with the EUROPEP instrument. Yonsei Med J. 2004; 45:23–8.
- Wensing M. EUROPEP 2006. Revised Europep instrument and user manual. The Netherlands: Center for Quality of Care Research (WOK); 2006.
- The EUROPEP questionnaire: Biomedcentral; Available at: http://www.biomedcentral.com/content/supplementary/1472-6963-7-46-s2.doc (accessed 4 May 2015).
- Press WH. Strong profiling is not mathematically optimal for discovering rare malfeasors. Proc Natl Acad Sci USA 2009; 106:1716–9.
- Classification of Turkish statistical regions. Available at: http://tr.wikipedia.org/wiki/T%C3%BCrkiye%27nin_%C4%B0BBS%27si (accessed 4 May 2015).
- Pollock AV. Outcome indicators. J R Soc Med. 1993;86:311.
- Turkey—health transition project: World Bank. Available at: http://documents.worldbank.org/curated/en/2004/04/3239002/turkey-health-transition-project (accessed 4 May 2015).
- Akdağ R. Turkish health transformation project evaluation report (2003–2010). Ankara: Hıfzıssıhha Mektebi Müdürlüğü; 2011.
- Smits FT, Mohrs JJ, Beem EE, Bindels PJ, van Weert HC. Defining frequent attendance in general practice. BMC Fam Pract. 2008;9:21.
- Al-Sakkak MA, Al-Nowaiser NA, Al-Khashan HI, Al-Abdrabulnabi AA, Jaber RM. Patient satisfaction with primary health care services in Riyadh. Saudi Med J. 2008;29:432–6.
- Margolis SA, Al-Marzouq S, Revel T, Reed RL. Patient satisfaction with primary health care services in the United Arab Emirates. Int J Qual Health Care 2003;15:241–9.
- Woods SE, Heidari Z. The influence of gender on patient satisfaction. J Gend Specif Med. 2003;6:30–5.
- Pareto analysis: Wikipedia, the free encyclopaedia. Available at: http://en.wikipedia.org/wiki/Pareto_analysis (accessed 4 May 2015).
- Başara BB, Güler C, Yentür GK, Birge B, Pulgat E, Ekinci BM. Turkish health statistics yearly 2012. Ankara: Ankara: Hıfzıssıhha Mektebi Müdürlüğü; 2013.