Abstract
A linear quantitative structure activity relationship (QSAR) model is presented for predicting human immunodeficiency virus-1 (HIV-1) reverse transcriptase enzyme inhibition. The 2D QSAR and 3D-QSAR models were developed by stepwise multiple linear regression, partial least square (PLS) regression and k-nearest neighbor-molecular field analysis, PLS regression, respectively using a database consisting of 33 recently discovered benzoxazinones. The primary findings of this study is that the number of hydrogen atoms, number of (−NH2) group connected with solitary single bond alters the inhibition of HIV-1 reverse transcriptase. Further, presence of electrostatic, hydrophobic and steric field descriptors significantly affects the ability of benzoxazinone derivatives to inhibit HIV-1 reverse transcriptase. The selected descriptors could serve as a primer for the design of novel and potent antagonists of HIV-1 reverse transcriptase.
Introduction
HIV-1 (human immunodeficiency virus type-1) is the pathogenic retrovirus and causative agent of acquired immunodeficiency syndrome (AIDS) or AIDS-related complexCitation1,Citation2. After viral penetration in the cell, its RNA is reversely transcripted to a viral DNA with the help of reverse transcriptase (RT) enzyme, which is then inserted in the cellular genome.
AIDS is a formidable pandemic that is still causing havoc world wide. The catastrophic potential of this viral disease has not been fully realized. The causative moiety of the disease is human immunodeficiency virus (HIV), which is a retrovirus of the lentivirus familyCitation3. Enzymes such as reverse transcriptase, protease and integrase encoded by the gag and gag-pol genes of HIV play an important role in the viral replication cycle. Among these enzymes, viral reverse transcriptase (RT) catalyzes the formation of proviral DNA from viral RNA which is the key stage in viral replication. As RT plays pivotal role in viral replication, it serves as a primary target for the anti-HIV-drug developmentCitation4.
Nucleoside analogues (e.g. AZT, 3TC, ddI, ddC) and non-nucleoside analogues (e.g. nevirapine, delaviridine and efavirenz) are the two main categories of HIV RT inhibitors available till date. Several NNRTIs (e.g. MKC442, troviridine, S-1153/ AG1549. PNU142721, ACT and HBY1293/GW420867X) are currently undergoing clinical trials. Efavirenz was the first potent anti-HIV drug to be approved by US Food and Drug Administration and studies have shown that efavirenz penetrates into the cerebrospinal fluid, a common viral sanctuary. The therapeutic efficacy of the drug is mainly restricted due to the development of viral resistance associated with mutations that include K103N, L1001 and Y188LCitation5.
In search of effective efavirenz analogues with minimal viral resistance problem, Patel et al.Citation6, synthesized and evaluated a novel set of benzoxazinones (analogues of efavirenz) for their HIV-1 reverse transcriptase inhibitory activity. Balaji et al.Citation7 reported a quantitative structure activity relationship (QSAR) study of the above mentioned benzoxazinone derivatives using a combination of P_VSA and pharmacophore feature descriptors. Dutchowicz et al.Citation8 reported a QSAR study of some benzoxazinone derivatives but the maximum correlation coefficient of the model is 0.799. The 2D QSAR studies have been carried out for anti-HIV activities of different groups of compoundsCitation9–23. Comparative molecular field analysis (CoMFA) and comparative molecular similarity indices analysis (CoMSIA) have also been carried out for anti-HIV activity of a given set of molecules in rational drug design and its related applicationsCitation24–37.
As a part of ongoing efforts to design novel molecules with potent HIV-1 reverse transcriptase (HIV-1 RT) activity, the 2D and 3D-QSAR analysis were performed on 33 benzoxazinone derivativesCitation6,Citation38 () to correlate their HIV-1 RT inhibitory activity with physico-chemical properties.
Table 1. Structures and HIV-1 RT inhibitory activity of the benzoxazinone derivatives.
Materials and methods
Molecular modeling studies were performed using software QSARPro (Product of VLife Sciences Technologies Private Limited, India; www.vlifesciences.com).
Biological data
Biological and chemical data of 33 benzoxazinone derivatives from the work of Patel et al.Citation6,Citation38 () was used. There is high structural diversity and a sufficient range of the biological activity in the selected series of benzoxazinone derivatives. HIV-1 RT inhibitory activities used in the present study were expressed as pIC50 = -log10 IC50, where IC50 is the micro molar concentration of the compounds producing 50% reduction in the HIV-1 RT activity stated as the mean of at least two experiments.
Sketching of molecules
The 2D structures of the compounds were drawn by using QSARPro software. The structures were then checked for errors, cleaned up and transferred to 3D form.
Energy minimization
The geometry of 3D structure was optimized to local minima by Merck molecular force field by considering distance-dependent dielectric constant of 1.0, convergence criterion or root-mean-square gradient at 0.001 kcal/mol Å and the iteration limit to 10,000. Most stable structure for each compound was generated and saved as .mol2 files for computing various physico-chemical and alignment independent descriptors.
2D QSAR analyses
Calculation of descriptor (independent variable)
Various physico-chemical and alignment-independent descriptors of energy-minimized molecules were calculated by using QSARPro software. The energy-minimized geometry was used for the calculation of the various 2D descriptors viz. individual, chi, chiv, path count, chichain, chivchain, chainpathcount, cluster, pathcluster, κ, element count, estate number, estate contribution, semi-impirical, hydophillic-hydophobic and polar surface area.
Various alignment-independent (AI) descriptors were also calculated. For calculation of alignment-independent, the independent descriptor was assigned the utmost three attributes. The first attribute was ‘T’ to characterize the topology of molecule. The second attribute was the atom type and the third attribute was assigned to atoms taking part in double or triple bond. The software developed the model with a total of 239 physico-chemical descriptors and more than 700 alignment-independent descriptors.
Dipole moment, electrostatic and hydrophobicity base log P descriptors were not selected, since these are 3D descriptors. The preprocessing of the independent variables (i.e. 2D descriptors) was done by removing the invariable (constant column), which resulted in a total of 150 descriptors to be used for QSAR analysis. Variable exclusion was done for constant variable or near constant variable at paired correlation. The total number of descriptors involved in the study was high for the series of compounds, so only significant descriptors have been elaborated in results and discussion.
Training and test set selection
The sphere exclusion (SECitation39) and random selection methods were adopted for division of training and test data set. The dissimilarity values used in sphere exclusion method was 1 and 1.5, where the sphere exclusion radius was given by dissimilarity value. The spherical exclusion method employs the following algorithm: (i) select a point and include it in the training set (ii) build a sphere with radius R with a center in this point (iii) include all points within the sphere, except for the center, in the test set (iv) discard all points in the sphere from the initial set (v) if no points are left, stop, otherwise go to step (i). The most active compound in the dataset was selected as the starting point for building a sphereCitation40. The selection of training and test set was further justified by uni-column statistics calculated for each case of study. Four trials (85%) were run for random selection method.
Feature selection and model development
Feature selection is a key step in QSAR analysis. An integral aspect of any model-building exercise is the selection of an appropriate set of features with low complexity and good predictive accuracy. This process forms the basis of a technique known as feature selection or variable selectionCitation41. Among several search algorithms, stepwise (SW) forward-backward variable selection methodCitation42, genetic algorithms (GACitation43) and simulated annealing (SACitation44) based feature selection procedures are found to be the most popular for building QSAR models and it can explain the situation more effectively.
To build QSAR equations, the cross-correlation limit was set at 0.5, the number of variables at 5, and the term selection criteria at q2. F value was specified to evaluate the significance of the variable. The variance cut-off was set at 0, with auto-scaling in which the number of random iteration was set at 100.
In SW forward-backward variable selection algorithm, the model is repeatedly altered from the previous one by adding or removing a predictor variable in accordance with the ‘stepping criteria’ (in this case F = 4 for inclusion; F = 3.99 for exclusion for the forward-backward selection method). In GA method, population and number of generations were set at 10 and 1000 with speed of 9999. In SA method, the maximum and minimum temperature were set as 100 and 0.01 K, respectively and the temperature was decreased by 5 units with 100 iterations at that particular temperature.
The relationship between dependent variable and various independent variables was established by multiple linear regression (MLR) analysis and partial least square (PLS) analysis by using QSARPro. Dataset having typically five times as many data points (molecules) as independent variables (descriptors) is required for getting reliable results.
Model quality and validation
The developed QSAR models are evaluated using the following statistical measures: n, (the number of compounds in regression); k, (number of variables); DF, (degree of freedom); optimum component, (number of optimum PLS components in the model); r2, (the squared correlation coefficient); r2se, (standard error of squared correlation coefficient); F-test, (Fischer’s value) for statistical significance; q2, (cross-validated correlation coefficient); q2_se, (standard error of cross-validated square correlation coefficient); pred_r2, (r2 for external test set); pred_r2se, (standard error of predicted squared regression); Z score, (Z score calculated by the randomization test); best_ran_q2, (highest q2 value in the randomization test); best_ran_r2, (highest r2 value in the randomization test). The regression coefficient r2 is the relative measure of fit by regression equation. It represents the part of variation in the observed data that is explained by the regression. However, a QSAR model is considered to be predictive, if the following conditions are satisfied: r2 > 0.6, q2 > 0.5 and pred_r2 >0.6. The F-test reflects the ratio of variance explained by the model and variance due to the error in regression. High values of F-test indicate that the model is statistically significant. The low standard error of r2 (r2_se), q2 (q2_se) and pred_r2 (pred_r2se) value shows absolute quality of fitness of the model.
Internal validation was carried out using ‘leave-one-out’ (q2, LOO) methodCitation45,Citation46. The cross-validated coefficient, q2, was calculated using the following equation:
where yi, and ŷi are the actual and predicted activity of the ith molecule in the training set, respectively and ymean is the average activity of all molecules in the training set. However, a high q2 value does not necessarily give a suitable representation of the real predictive power of the model for HIV-1 reverse transcriptase activity. So, an external validation was also carried out in the present study. The external predictive power of the model was assessed by predicting −logIC50 value of the test set molecules, which were not included in the QSAR model development. The predictive ability of the selected model was also confirmed by r2−r20/r2, r2−r’20/r2, k and k’.
where yi, and ŷi are the actual and predicted activity of the ith molecule in the test set, respectively, and ymean is the average activity of all molecules in the training set.
Another term to check the external predictability of the selected model is r2m, which was proposed by Roy and Roy (2007Citation47) and it was calculated by the following formula:
Where r2 is a squared correlation coefficient between observed and predicted values and r02 is a squared correlation coefficient between observed and predicted values with intercept value set to zero. A value of r2m is greater than 0.5 may be taken as an indicator for good external predictability.
3D-QSAR analyses
The molecular modeling studies were performed using QSARPro, supplied by VLife. The energy-minimized benzoxazinone derivatives used in the 2D QSAR studies were used as such for 3D-QSAR studies. The most significant requisite for any 3D-QSAR study is to align the data set on a suitable conformational template, either by taking a reported crystal structure of a bioactive compound or by considering the most active compound.
The most active compound was considered as a template for the alignment due to the absence of any reported crystal structure. The benzoxazinone moiety of the bioactive compound 9 was used as a substructure and the rest of the molecules were aligned on it using database alignment method. Electrostatic, steric and hydrophobic field descriptors were selected for 3D-QSAR studies. For calculation of field descriptor values, the cut-off values were set at 10.0 and 30.0 kcal/mole, respectively for electrostatic and steric field. The charge type was selected as Gasteiger-Marsili. Dielectric constant was set to 1.0 considering the distance-dependent dielectric function.
Calculation of descriptors (independent variables)
The QSARPro (VLife) software allows the user to choose probe, grid size and grid interval for the generation of descriptors. After suitable alignment of a given set of molecules, a common rectangular grid (lattice) was generated around the molecules. The steric, electrostatic and hydrophobic interaction energies were computed at the lattice points of the grid using a methyl probe of charge +1. These interaction energy values were considered for relationship generation and could be utilized as descriptors. The descriptors were considered as independent variables and biological activity as dependent variables.
Training and test set selection
The sphere exclusion (SE) and random selection methods were adopted for division of training and test data set. The dissimilarity value used in sphere exclusion method was 5, where the dissimilarity value gives the sphere exclusion radius. The compounds 11, 13, 15, 17 and 31 were selected as test set and remaining 28 compounds as training set. The predictive ability of the QSAR model was found to be less when the dissimilarity level is high. Four trials (85%) were run in the case of random selection method. The selection of training and test set was further justified by uni-column statistics calculated for each case of study.
Feature selection and model development
The kNN-molecular field analysis (MFA) and PLS methods were used to generate 3D-QSAR models using the variable selection methods viz. stepwise (SW) forward-backward, genetic algorithm (GA) and simulated annealing (SA). In all the methods F-test ‘in’ was set to ‘4.0’ and F-test ‘out’ was set to ‘3.99’. As some additional parameters, variance cut-off was set as 2 kcal/mol Å, scaling was set as auto-scaling, additionally the K-nearest neighbor parameter was set as 5, PLS optimum component was set as 5 and the prediction method was selected as distance base weighted average.
The statistical and validation parameters are same as 2D QSAR. In 3D QSAR, electrostatic, steric and hydrophobic fields were generated around the aligned molecules in the grid. Negative value in electrostatic field descriptors (blue points in the dialog box) indicates that negative electronic potential is essential for activity and more electronegative substituent group is preferred at that position, and positive electronic potential range indicates the vice-versa. Negative range in steric field (green points in the dialog box) signifies that negative steric potential is required for activity and less bulky substituent group is preferred in that region. The positive value of steric descriptors reveals that positive steric potential is favorable for increase in activity and more bulky group is preferred in that region. Positive value in hydrophobic field descriptors (yellow points in the dialog box) indicates that positive hydrophobic potential is favorable for activity and more hydrophobic substituent group is preferred at that position, and negative hydrophobic potential range indicates the vice-versa
Results and discussion
The 2D QSAR study of 33 benzoxazinone derivativesCitation6,Citation38 for HIV-1 reverse transcriptase inhibitory activity () through MLR and PLS methodology is based on various feature selection methods viz. SW, GA and SA using QSARPro (VLife) software resulted many QSAR models, considering the term selection criterion as r2, q2 and pred_r2. The training and test sets were selected by sphere exclusion (dissimilarity value 1 and 1.5) and random selection (85%) method and the models were validated by both internal and external validation procedure. A uni-column statistics for training set and test set was generated to check the correctness of selection criteria for trainings and test set molecules.
The maximum and minimum value in training and test set were compared in such a way that:
1. The maximum value of −logIC50 of test set should be less than or equal to maximum value of −logIC50 of training set.
2. The minimum value of −logIC50 of test set should be higher than or equal to minimum value of −logIC50 of training set.
This observation showed that test set was interpolative and derived within the minimum–maximum range of training set. The mean and standard deviation of −logIC50 values of training and test sets provide insights into relative difference of mean and point density distribution of two sets. The mean of the test sets was higher than the training set indicating the presence of relatively more active molecules as compared to the inactive ones. Some selected 2D QSAR models were given below.
Model 1
Training and test set selection: SE (dissimilarity value 1), Variable selection: SW,
Regression: MLR
−log IC50 = −0.0970 (Hydrogen count) − 0.6443 (SsNH2 count) + 7.8558
n = 26, Degree of freedom = 23, r2 = 0.651, q2 = 0.520, F = 21.41, r2se = 0.294, q2se = 0.345, pred r2 = 0.630, pred r2se = 0.363, Z Score R2 = 6.868, Z Score Q2 = 5.912, Best rand R2 = 0.260, Best rand Q2 = 0.093
Model 2
Training and test set selection: SE (dissimilarity value 1), Variable selection: SW,
Regression: PLS
−log IC50 = −0.0956 (Hydrogen count) − 0.6563 (SsNH2 count) + 7.8399
Optimum Components = 1
n = 26, Degree of freedom = 24, r2 = 0.650, q2 = 0.541, F = 44.653, r2se = 0.288, q2se = 0.329, pred r2 = 0.622, pred r2se = 0.367, Z Score R2 = 3.383, Z Score Q2 = 3.145, Best rand R2 = 0.442, Best rand Q2 = 0.319
Model 3
Training and test set selection: SE (dissimilarity value 1.5), Variable selection: SW,
Regression: MLR
−log IC50 = −0.01078 (Hydrogen count) − 0.5035 (SsNH2 count) + 8.0066
n = 23, Degree of freedom = 20, r2 = 0.658, q2 = 0.534, F = 19.264, r2se = 0.288, q2se = 0.337, pred r2 = 0.628, pred r2se = 0.358, Z Score R2 = 4.943, Z Score Q2 = 3.950, Best rand R2 = 0.351, Best rand Q2 = 0.162
Model 4
Training and test set selection: SE (dissimilarity value 1.5), Variable selection: SW,
Regression: PLS
−log IC50 = −0.1017 (Hydrogen count) − 0.5706 (SsNH2 count) + 7.9381
Optimum Components = 1
n = 23, Degree of freedom = 21, r2 = 0.655, q2 = 0.562, F = 39.894, r2se = 0.253, q2se = 0.289, pred r2 = 0.635, pred r2se = 0.305, Z Score R2 = 8.629, Z Score Q2 = 5.235, Best rand R2 = 0.108, Best rand Q2 = 0.039
Model 5
Training and test set selection: Random selection (85%, 3rd trial), Variable selection: SA, Regression: MLR
−log IC50 = 0.2631 (chi4) + 0.9831 (Chlorines count) − 0.4968 (SssssCE-index) − 0.0505 (smr) + 4.1622
n = 28, Degree of freedom = 23, r2 = 0.636, q2 = 0.500, F = 10.048, r2se = 0.322, q2se = 0.377, pred r2 = 0.762, pred r2se = 0.237, Z Score R2 = 5.665, Z Score Q2 = 5.191,
Best Rand R2 = 0.297, Best Rand Q2 = −0.006
Model 6
Training and test set selection: Random selection (85%, 3rd trial), Variable selection: SW, Regression: PLS
−log IC50= −0.0925 (Hydrogen count) − 0.5831 (SsNH2 count) + 7.7926
Optimum Components = 3
n = 28, Degree of freedom = 26, r2 = 0.642, q2 = 0.554, F = 46.530, r2se = 0.300, q2se = 0.335, pred r2 = 0.564, pred r2se = 0.321, Z Score R2 = 3.913, Z Score Q2 = 3.593, Best rand R2 = 0.299, Best Rand Q2 = 0.151
Model 1 was developed by MLR technique using SW variable selection method and SE (dissimilarity value 1) for training and test set selection. Model 1 could explain 65.06% and predict 62.96% of the variance of the HIV-1 RT inhibitory data. There was no inter-correlation between the descriptors. Uni-column statistics () confirmed that the selection of trainings and test set molecules for this model was according to selection criteria. The parameters involved in the selected model (Hydrogen count and SsNH2 count) are given in . The calculated HIV-1 RT inhibitory values by model 1 are shown in .
Table 2. Uni-column statistics for model 1 and 2.
Table 3. Selected parameters involved in selected 2D QSAR model of benzoxazinones.
Table 4. Observed and predicted anti-HIV-1 reverse transcriptase inhibitors of benzoxazinone derivatives (training set & test set).
The selected model showed good internal prediction (q2 = 0.519). The predictive ability of the selected models was also confirmed by external validation method. The proposed QSAR model is predictive as it satisfies the conditions r2Pred > 0.6 (r2Pred = 0.629). The robustness of this model was checked by Y-randomization test (maximum R2 value is 0.259 and maximum Q2 is 0.093). The low R2 and Q2 values indicate that good results in our original model are not due to a chance correlation or structural dependency of the training set.
Model 2 was developed by PLS technique using SW variable selection method and SE (dissimilarity value 1) for training and test set selection. Model 2 could explain 65.04% and predict 54.14% of the variance of the HIV-1 RT inhibitory data. There was no inter-correlation between the descriptors. Uni-column statistics () confirmed that the selection of trainings and test set molecules for this model was according to selection criteria. The parameters involved in the selected model (same parameters as model 1) are given in . The calculated HIV-1 RT inhibitory values by model 2 are presented in .
The selected model showed good internal prediction (q2 = 0.541). The predictive ability of the selected model was also confirmed by external validation method. The proposed QSAR model is predictive as it satisfies the conditions r2Pred > 0.6 (r2Pred = 0.622). The robustness of this model was checked by Y-randomization test (maximum R2 value is 0.442 and maximum Q2 is 0.319). The low R2 and Q2 values indicate that the good results in our original model are not owed to a chance correlation or structural dependency of the training set.
Model 3 was developed by MLR technique using SW variable selection method and SE (dissimilarity value 1.5) for training and test set selection. Model 3 could explain 65.83% and predict 62.83% of the variance of the HIV-1 RT inhibitory data. There was no inter-correlation between the descriptors. Uni-column statistics () confirmed that the selection of trainings and test set molecules for this model was according to selection criteria. The parameters involved in the selected model (same parameters as model 1) are given in . The calculated HIV-1 RT inhibitory values by model 3 are given in .
Table 5. Uni-column statistics for models 3 and 4.
The selected model showed good internal prediction (q2 = 0.534). The predictive ability of the selected models was also confirmed by external validation method. The proposed QSAR model is predictive as it satisfies the conditions r2Pred > 0.6 (r2Pred = 0.628). The robustness of this model was checked by Y-randomization test (maximum R2 value is 0.350 and maximum Q2 is 0.162). The low R2 and Q2 values indicate that the good results in our original model are not attributed to a chance correlation or structural dependency of the training set.
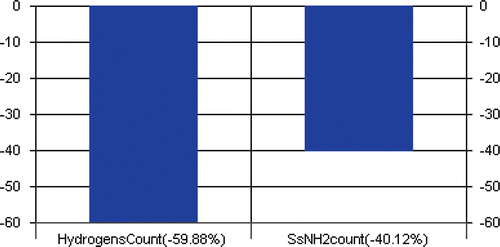
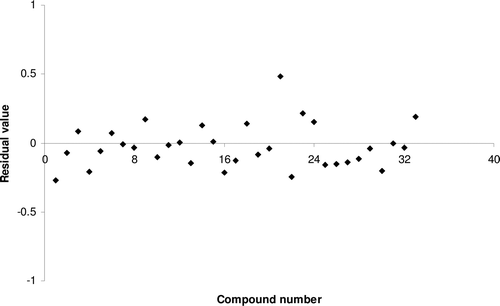
Model 4 was developed by PLS technique using SW variable selection method and SE (dissimilarity value 1.5) for training and test set selection. Model 6 could explain 65.51% and predict 63.52% of the variance of the HIV-1 RT inhibitory data. There was no inter-correlation between the descriptors. Uni-column statistics () confirmed that the selection of training and test set molecules for this model was according to selection criteria. The parameters involved in the selected model (same parameters as model 1) are given in . The calculated HIV-1 RT inhibitory values by model 4 are shown in , residual value of observed and predicted HIV-1 RT inhibitory activities are graphically shown in and the contribution of descriptors in the model is shown .
Figure 1. Residual plot between experimental and predicted HIV-1 reverse transcriptase inhibitory activities of benzoxazinone derivatives by model 4.
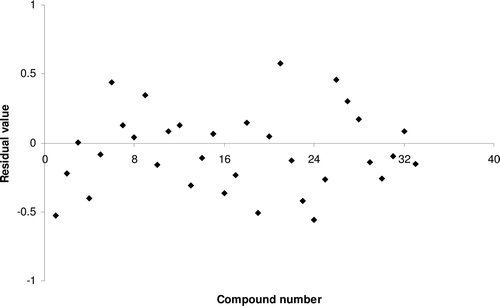
Figure 2. Contribution graph for model 4.
The selected model showed good internal prediction (q2 = 0.562). The predictive ability of the selected models was also confirmed by external validation method. The proposed QSAR model is predictive as it satisfies the conditions r2Pred > 0.6 (r2Pred = 0.635). The robustness of this model was checked by Y-randomization test (maximum R2 value is 0.108 and maximum Q2 is 0.039). The low R2 and Q2 values indicate that the good results in our original model are not due to a chance correlation or structural dependency of the training set.
Model 5 was developed by MLR technique using SA variable selection method and random selection (85%, 3rd trial) for training and test set selection. Model 5 could explain 63.60% and predict 76.23% of the variance of the HIV-1 RT inhibitory data. There was no inter-correlation between the descriptors. Uni-column statistics () confirmed that the selection of training and test set molecules for this model was according to selection criteria. The parameters involved in the selected model (Chlorine count, SssssCE-index, smr) are given in . The calculated HIV-1 RT inhibitory values by model 5 are shown in .
Table 6. Uni-column statistics for model 5
The selected model showed good internal prediction (q2 = 0.50). The predictive ability of the selected models was also confirmed by external validation method. The proposed QSAR model is predictive as it satisfies the conditions r2Pred > 0.6 (r2Pred = 0.762). The robustness of this model was checked by Y-randomization test (maximum R2 value is 0.297 and maximum Q2 is −0.006). The low R2 and Q2 values indicate that the good results in our original model are not due to a chance correlation or structural dependency of the training set.
Model 6 was developed by PLS technique using SW variable selection method and random selection (85%, 3rd trial) for training and test set selection. Model 6 could explain 64.15% and predict 56.47% of the variance of the HIV-1 RT inhibitory data. There was no inter-correlation between the descriptors. Uni-column statistics confirmed that the selection of trainings and test set molecules for this model was according to selection criteria. The parameters involved in the selected model (Hydrogen count, SsNH2 count) are given in . The calculated HIV-1 RT inhibitory values by model 6 are given in .
The selected model showed good internal prediction (q2 = 0.554). The predictive ability of the selected models was also confirmed by external validation method. The proposed QSAR model was found to be predictive as it satisfies the conditions r2Pred > 0.6 (r2Pred = 0.564). Y-randomization test was used to check the robustness of the model and the maximum R2 and Q2 value was found to be 0.298 and 0.150, respectively. The low R2 and Q2 values indicate that the good results in our original model are not due to a chance correlation or structural dependency of the training set.
All the above selected models showed more or less the same coefficient of determination (r2) and internal prediction (q2). Based on external prediction, model 5 was found to exhibit better prediction than other models. Beside this, the other statistical parameters (F-test, r2se, q2se, Z score R2, Z Score Q2, Best rand R2 and Best Rand Q2) indicate that model 4 was found to be the best model among the selected ones. The proposed 2D QSAR model 4 was found to be predictive as it satisfies the following conditions:
r2Pred = 0.635 > 0.6, r2m = 0.639 > 0.5; k = 0.99; k’ = 1.006 (0.85 < k or k’ < 1.15); r2−r20/r2 = −0.171; r2−r’20/ r2 = 0.212 (r2−r20/r2 or r2−r’20/ r2 < 0.1).
The descriptors hydrogen count and SsNH2 count were encompassed in the models 1, 2, 3, 4 and 6. The model 5 incorporated the descriptors chlorine count, SssssCE-index and smr. The negative coefficient of hydrogen count in the models 1, 2, 3, 4 and 6 suggested that increase in the value of this descriptor is not beneficial for the HIV-1 RT inhibitory activity of benzoxazinone derivatives. This explanation was supported by the compounds 5, 16, 17, 19 and 23–27, which showed higher hydrogen counts than other compounds. The descriptor SsNH2 count (in the models 1, 2, 3, 4 and 6) defines that the total number of −NH2 group connected with one single bond, is an estate number type descriptor and was negatively contributing. It also showed that an increase in value of this descriptor may result in decreased HIV-1 RT inhibitory activity of benzoxazinone derivatives. These findings were supported by the compounds 1–3 and 33, which are having −NH2 group connected with one single bond.
All the selected 2D QSAR models showed statistical significance and good external prediction but none of the models is preeminent. To investigate the contribution of steric, electrostatic and hydrophobic parameters on HIV-1 RT inhibitory activity of benzoxazinone derivatives, 3D-QSAR studies was carried out on the same series of compounds.
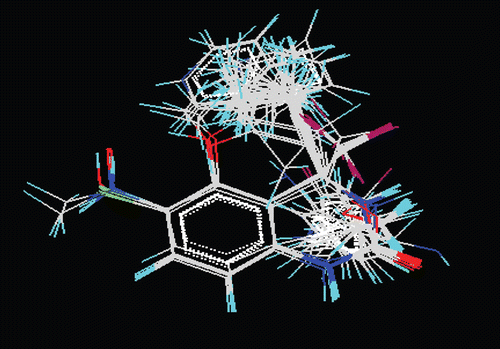
The 3D-QSAR study of template aligned 33 benzoxazinone derivatives () for HIV-1 reverse transcriptase inhibitory activity () was performed through PLS and kNN-MFA methodology. Based on various feature selection methods viz. SW, GA and SA using QSARPro (VLife) software, many 3D-QSAR models were generated, considering the term selection criterion as q2. The training and test sets were selected by sphere exclusion (dissimilarity value 5) and random selection (85%) method and the models were validated by both internal and external validation. A uni-column statistics for training set and test set was generated to check the correctness of selection criteria for trainings and test set molecules. Some of the selected 3D-QSAR models are given below:
Figure 3. Template based alignment of benzoxazinone derivatives.
Model 7kNN-MFA-SW-SE-(dissimilarity value 5)
Training set size = 28, Test set size = 5
Statistics
k-Nearest neighbour = 2, n = 28, Degree of freedom = 24, q2 = 0.836, q2_se = 0.199,
Pred r2 = 0.962, pred_r2se = 0.096
Descriptor range
E_845: −0.0697 to −0.0323, E_352: −0.0489 to −0.0180, S_766: −0.4160 to −0.3749
Model 8 kNN-MFA-GA-SE-(dissimilarity value 5)
Training set size = 28, Test set size = 5
Statistics
k-Nearest neighbor = 2, n = 28, Degree of freedom = 24, q2 = 0.565, q2_se = 0.324,
Pred r2 = 0.789, pred_r2se = 0.228
Descriptor range
S_765: 6.7036 to 8.1576, E_31: 0.3728 to 0.5541, H_773: 0.4981 to 0.5770
Model 9: kNN-MFA-SW-random selection-(85%)
Training set size = 28, Test set size = 5
Statistics
k-Nearest neighbor= 2, n = 28, Degree of freedom = 25, q2 = 0.856, q2_se = 0.184,
Pred r2 = 0.863, pred_r2se = 0.201
Descriptor range
E_195: −0.0003 to 0.0010, H_2: 0.2058 to 0.2375
Model 10: PLS- SW-SE-(dissimilarity value 5)
Training set size = 28, Test set size = 5
Statistics
Optimum components = 3, n = 28, Degree of freedom = 24, r2 = 0.897, q2 = 0.715,
F = 69.723, r2 se = 0.167, q2 se = 0.278, pred_r2 = 0.835, pred_r2se = 0.201
Selected descriptors
E_535, E_748, E_764, S_555, S_176
Coefficient
0.0569, −0.0420, −0.0731, 1.6282, 0.6393,
Constant
7.5273
Most significant models were generated by SW variable selection method. Uni-column statistics for models 7 and 9 are given in and . Cross-validated correlation coefficient of the best model (model 7) was found to be 0.836 which explains the goodness of internal prediction of the model. The external predictive power of the model was 0.962. A closer view of the selected descriptors suggests that descriptors included in the model E_845, E_352 and S_766 () play a significant role in the structure activity relationship (. The other best models are reported as models 8, 9 and 10.
Table 7. Uni-column statistics for model 7.
Table 8. Uni-column statistics for model 9.
Table 9. 3D parameters involved in model 7 and 10.
Table 10. Comparative observed and predicted HIV-1 RT inhibitors of benzoxazinonederivatives (training set & test set).
The models 7, 8 and 9 were generated by kNN-MFA methodology. This method was used with electrostatic, steric and hydrophobic field descriptors along with its k-nearest neighbors (k = 2) to evaluate the activity of new molecules. Model 10 was generated by PLS methodology with electrostatic and steric field descriptors along with optimum components 3.
Developed kNN-MFA and PLS models showed the relative position and ranges of the corresponding electrostatic, steric and hydrophobic fields and provided guidelines for designing new molecules. Negative range indicates that, negative electrostatic potential and steric potential are favorable for increase in activity and hence more electronegative substituent with small steric groups (Cl, F, CH3, C=O, SO2 or CN) is preferred in that region. Positive range indicates that, positive electro potential and steric potential are favorable for increase in activity and hence a less electronegative and bulky group is preferred in this region (branched alkyl groups, cyclic groups). The positive range of hydrophobic field descriptors indicates that the substitution of hydrophobic groups at these positions is conducive for HIV-1 RT inhibitory activity. It also indicates that these hydrophobic groups may interact with amino acid residues (Leu234, Tyr318, His235, Phe227, Trp229, Tyr118) of HIV-1 reverse transcriptase and inhibit the HIV multiplication. Thus kNN-MFA and PLS models provide direction for design of new molecules in a rather convenient way. The points which contribute to the selected kNN-MFA (models 7 and 9) and PLS (model 10) models in data sets are illustrated in , and . The residual values of observed and predicted HIV-1 RT inhibitory activities are shown graphically in , and . The range of property values for the chosen points may also assist in the design of new potent molecules. The range is based on the variation of the field values at the chosen points using the most active molecule and its nearest neighbor set.
Figure 4. Contour maps for model 7; E-Electrostatic, S-Steric.
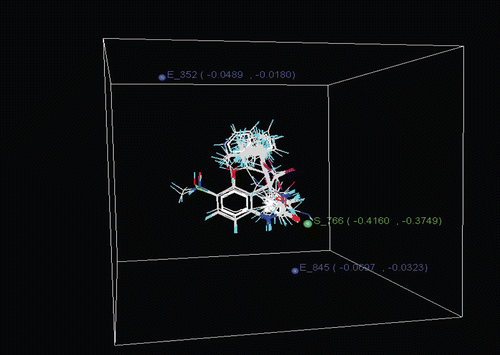
Figure 5. Contour maps for model 9; E-Electrostatic, H-Hydrophobic.
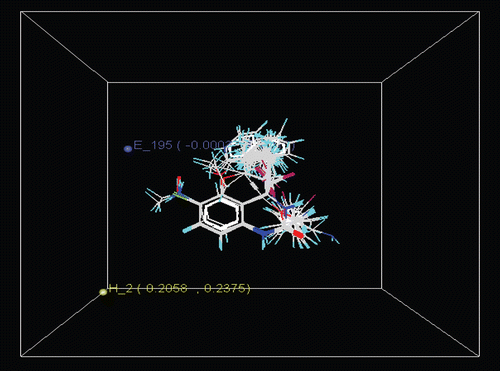
Figure 6. Contour maps for model 10; E-Electrostatic, S-Steric.
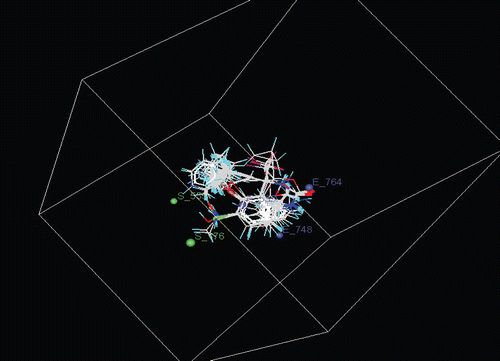
Figure 7. Residual plot between experimental and predicted HIV-1 reverse transcriptase inhibitory activities of benzoxazinone derivatives by model 7.
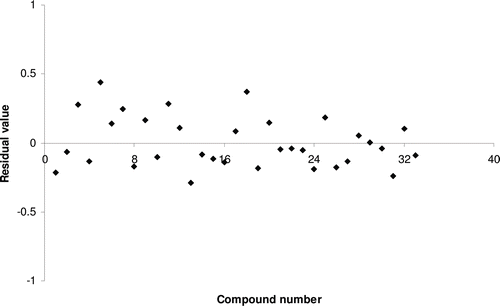
Figure 8. Residual plot between experimental and predicted HIV-1 reverse transcriptase inhibitory activities of benzoxazinone derivatives by model 9.
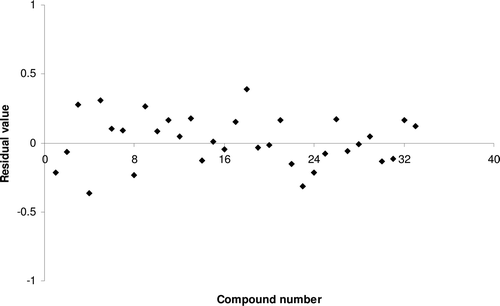
Figure 9. Residual plot between experimental and predicted HIV-1 reverse transcriptase inhibitory activities of benzoxazinone derivatives by model 10.
The proposed QSAR model 7 was predictive since it satisfies the following conditions:
r2Pred = 0.962 > 0.6, r2m = 0.640 > 0.5; k = 1.008; k’ = 0.991 (0.85 < k or k’ < 1.15); r2−r20/r2 = −0.256; r2−r’20/ r2 = −0.229 (r2−r20/r2 or r2−r’Citation20/ r2 < 0.1).
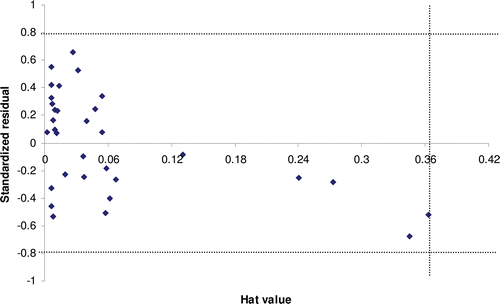
The applicability domain was established for models 4 and 7, determining the leverage values for each compound. and show the Williams plot; i.e. plot of standardized residuals (y-axis) versus leverages (x-axis) for each compound of the models 4 and 7. The applicability domain was established inside a squared area with standard deviations of 0.8 for model 4 and 7. A leverage threshold value of h* = 0.273 (h* = 3p´/n, being p´ the number of model parameters + 1, and n the number of compounds) and 0.364 was observed for models 4 and 7, respectively. As seen in and , all compounds of training and test set are found to be inside of the square area. The predicted HIV-1 RT inhibitory activity data must be considered reliable only for those chemicals that fall within the applicability domain on which the model was constructed for future predictionsCitation48.
Figure 10. Williams plot for model 4: Plot of standardized residuals (y-axis) versus leverages (hat values; x-axis) for each compound.
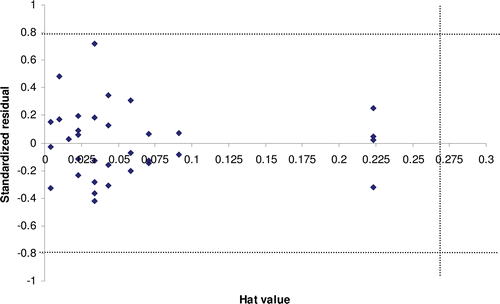
Figure 11. Williams plot for model 7: Plot of standardized residuals (y-axis) versus leverages (hat values; x-axis) for each compound.
It was also stated that the reported QSAR models may not be useful to predict the activity of other type of molecules against HIV-1 RT enzymes. The applicability domain of the derived QSAR models is specifically related to benzoxazinone derivatives. However, it is very important to point out an eventual limitation of QSAR models i.e. activity cliffs shown by similar molecules exhibits different biological activityCitation49.
Conclusion
This study established 2D QSAR and 3D-QSAR models for benzoxazinone derivatives, which were found to be statistically significant and highly predictive to inhibit HIV-1 RT. More electronegative substituent with small steric groups (Cl, F, CH3, C = O, SO2 or CN), less electronegative and bulky group (branched alkyl groups, cyclic groups) and substitution of hydrophobic groups in the specific positions are essential to design potent HIV-1 RT inhibitors. These findings could be utilized in the development and optimization of new HIV-1 RT inhibitors. It was concluded that the reported QSAR models might be used specifically for predicting HIV-1 RT inhibitory activity of benzoxazinone derivatives.
Acknowledgment
Authors are thankful to Dr. Yogesh Wagh, VLife Sciences, Pune, India for providing software to carry out this work.
Declaration of interest
The authors declare no conflicts of interest.
References
- Gallo RC, Salahuddin SZ, Popovic M, Shearer GM, Kaplan M, Haynes BF et al. Frequent detection and isolation of cytopathic retroviruses (HTLV-III) from patients with AIDS and at risk for AIDS. Science 1984;224:500–503.
- Barré-Sinoussi F, Chermann JC, Rey F, Nugeyre MT, Chamaret S, Gruest J et al. Isolation of a T-lymphotropic retrovirus from a patient at risk for acquired immune deficiency syndrome (AIDS). Science 1983;220:868–871.
- Clercq ED. Toward improved anti-HIV chemotherapy: Therapeutic strategies for intervention with HIV infections. J Med Chem 1995;38:2491–2517.
- Milton J, Slater MJ, Bird AJ, Spinks D, Scott G, Price CE et al. Biaryl acids: Novel non-nucleoside inhibitors of HIV reverse transcriptase types 1 and 2. Bioorg Med Chem Lett 1998;8:2623–2628.
- Young SD, Britcher SF, Tran LO, Payne LS, Lumma WC, Lyle TA et al. L-743, 726 (DMP-266): A novel, highly potent non-nucleoside inhibitor of the human immunodeficiency virus type-1 reverse transcriptase. Antimicrob Agents Chemother 1995;39:2602–2605.
- Patel M, McHugh RJ Jr, Cordova BC, Klabe RM, Erickson-Viitanen S, Trainor GL et al. Synthesis and evaluation of benzoxazinones as HIV-1 reverse transcriptase inhibitors. Analogs of efavirenz (SUSTIVA). Bioorg Med Chem Lett 1999;9:3221–3224.
- Balaji S, Karthikeyan C, Hari Narayana Moorthy NS, Trivedi P., Trivedi, QSAR modeling of HIV-1 reverse transcriptase inhibition by benzoxazinones using a combination of P_VSA and pharmacophore feature descriptors. Bioorg Med Chem Lett 1999;14:6089–6094.
- Duchowicz PR, Fernández M, Caballero J, Castro EA, Fernández FM. QSAR for non-nucleoside inhibitors of HIV-1 reverse transcriptase. Bioorg Med Chem 2006;14:5876–5889.
- Leonard JT, Roy K. QSAR by LFER model of HIV protease inhibitor mannitol derivatives using FA-MLR, PCRA, and PLS techniques. Bioorg Med Chem 2006;14:1039–1046.
- Thomas Leonard J, Roy K. Comparative QSAR modeling of CCR5 receptor binding affinity of substituted 1-(3,3-diphenylpropyl)-piperidinyl amides and ureas. Bioorg Med Chem Lett 2006;16:4467–4474.
- Ravichandran V. QSAR based prediction of anti-HCV activity of thiourea derivatives. Mol Simulation 2010;36:878–886.
- Barreca ML, Carotti A, Carrieri A, Chimirri A, Monforte AM, Calace MP et al. Comparative molecular field analysis (CoMFA) and docking studies of non-nucleoside HIV-1 RT inhibitors (NNIs). Bioorg Med Chem 1999;7:2283–2292.
- Ravichandran V, Jain PK, Mourya VK, Agrawal RK. QSAR study on some arylsulfonamides as anti-HIV agents. Med Chem Res 2007;16:342–351.
- Ravichandran V, Mourya VK, Agrawal RK. QSAR study of novel 1,1,3-trioxo [1,2,4]-thiadiazine (TTDs) analogues as potent anti-HIV agents. Arkivoc 2007;XIV:204–212.
- Ravichandran V, Mourya VK, Agrawal RK. QSAR prediction of HIV–1 reverse transcriptase inhibitory activity of benzoxazinone derivatives. Internet Electron J Mol 2007;6:363–374.
- Ravichandran V, Mourya VK, Agrawal RK. QSAR modeling of HIV-1 reverse transcriptase inhibitory activity with PETT derivatives. Digest J Nanomat Biostruct 2008;3:9–17.
- Ravichandran V, Mourya VK, Agrawal RK. Prediction of HIV-1 protease inhibitory activity of 4-hydroxy-5,6-dihydropyran-2-ones: QSAR study. J Enzyme Inhib Med Chem 2011;26:288–294.
- Ravichandran V, Jain A, Mourya VK, Agrawal RK. Prediction of anti-HIV activity and cytotoxicity of pyrimidinyl and triazinyl amines: QSAR study. Chem Pap 2008;62:596–602.
- Ravichandran V, Mourya VK, Agrawal RK. Prediction of anti-HIV activity of 1,3-thiazolidin-4-ones: QSAR approach. Digest J Nanomat Biostruct 2008;3:19–31.
- Ravichandran V, Jain A, Mourya VK, Agrawal RK. Prediction of HIV-1 protease inhibitory activity of (4-hydroxy-6-phenyl-2-oxo-2H-pyran-3-yl) thiomethanes: QSAR study. Current Trends in Biotech Pharm 2009;3:37–42.
- Ravichandran V, Mourya VK, Agrawal RK. QSAR Analysis of benzodithiazines as HIV-1 integrase inhibitors. Asian Pac J Trop Med 2009;2:15–22.
- Ravichandran V, Shalini S, Sundram K, Sokkalingam AD. QSAR study of substituted 1,3,4-oxadiazole naphthyridines as HIV-1 integrase inhibitors. Eur J Med Chem 2010;45:2791–2797.
- Sahu KK, Ravichandran V, Jain PK, Sharma S, Mourya VK, Agrawal RK. QSAR analysis of caffeoyl naphthalene sulphonamide derivatives as HIV-1 integrase inhibitors. Med Chem Res 2007;5:418–430.
- Klebe G, Abraham U, Mietzner T. Molecular similarity indices in a comparative analysis (CoMSIA) of drug molecules to correlate and predict their biological activity. J Med Chem 1994;37:4130–4146.
- Böhm M, St rzebecher J, Klebe G. Three-dimensional quantitative structure-activity relationship analyses using comparative molecular field analysis and comparative molecular similarity indices analysis to elucidate selectivity differences of inhibitors binding to trypsin, thrombin, and factor Xa. J Med Chem 1999;42:458–477.
- Buolamwini JK, Assefa H. CoMFA and CoMSIA 3D-QSAR and docking studies on conformationally-restrained cinnamoyl HIV-1 integrase inhibitors: exploration of a binding mode at the active site. J Med Chem 2002;45:841–852.
- Ravichandran V, Prashantha Kumar BR, Sankar S, Agrawal RK. Predicting anti-HIV activity of 1,3,4-thiazolidinone derivatives: 3D-QSAR approach. Eur J Med Chem 2009;44:1180–1187.
- Pungpo P, Hannongbua S. Three-dimensional quantitative structure-activity relationships study on HIV-1 reverse transcriptase inhibitors in the class of dipyridodiazepinone derivatives, using comparative molecular field analysis. J Mol Graph Model 2000;18:581–90, 601.
- Jayatilleke PR, Nair AC, Zauhar R, Welsh WJ. Computational studies on HIV-1 protease inhibitors: influence of calculated inhibitor-enzyme binding affinities on the statistical quality of 3D-QSAR CoMFA models. J Med Chem 2000;43:4446–4451.
- Ravichandran, V, Prashanthakumar BR, Sankar S, Agrawal RK. Comparative molecular similarity indices analysis for predicting anti-HIV activity of phenyl ethyl thiourea (PET) derivatives. Med Chem Res 2008;17:1–11.
- Debnath AK. Three-dimensional quantitative structure-activity relationship study on cyclic urea derivatives as HIV-1 protease inhibitors: application of comparative molecular field analysis. j Med Chem 1999;42:249–259.
- Ravichandran V, Agrawal RK. Predicting anti-HIV activity of PETT derivatives: CoMFA approach. Bioorg Med Chem Lett 2007;17:2197–2202.
- Qin B, Jiang X, Lu H, Tian X, Barbault F, Huang L et al. Diarylaniline derivatives as a distinct class of HIV-1 non-nucleoside reverse transcriptase inhibitors. J Med Chem 2010;53:4906–4916.
- Hu R, Barbault F, Delamar M, Zhang R. Receptor- and ligand-based 3D-QSAR study for a series of non-nucleoside HIV-1 reverse transcriptase inhibitors. Bioorg Med Chem 2009;17:2400–2409.
- Hu R, Barbault F, Maurel F, Delamar M, Zhang R. Molecular dynamics simulations of 2-amino-6-arylsulphonylbenzonitriles analogues as HIV inhibitors: interaction modes and binding free energies. Chem Biol Drug Des 2010;76:518–526.
- Teixeira C, Serradji N, Maurel F, Barbault F. Docking and 3D-QSAR studies of BMS-806 analogs as HIV-1 gp120 entry inhibitors. Eur J Med Chem 2009;44:3524–3532.
- Liu K, Lu H, Hou L, Qi Z, Teixeira C, Barbault F et al. Design, synthesis, and biological evaluation of N-carboxyphenylpyrrole derivatives as potent HIV fusion inhibitors targeting gp41. J Med Chem 2008;51:7843–7854.
- Patel M, McHugh RJ Jr, Cordova BC, Klabe RM, Bacheler LT, Erickson-Viitanen S et al.. Synthesis and evaluation of novel quinolinones as HIV-1 reverse transcriptase inhibitors. Bioorg Med Chem Lett 2001;11:1943–1945.
- Johns BA, Weatherhead JG, Allen SH, Thompson JB, Garvey EP, Foster SA et al. The use of oxadiazole and triazole substituted naphthyridines as HIV-1 integrase inhibitors. Part 1: Establishing the pharmacophore. Bioorg Med Chem Lett 2009;19:1802–1806.
- Hudson BD, Hyde RM, Rahr E, Wood J. Parameter based methods for compound selection from chemical databases. Quant Struct Act Rel 1996;15:285–289.
- Lather V, Fernandes MX. QSAR models for prediction of PPARδ agonistic activity of indanylacetic acid derivatives. QSAR Comb Sci 2009;28:447–457.
- Guyon A., Elisseeff, An introduction to variable and feature selection. J Mach Learning Res 2003;3:1157–1182.
- Darlington RB. Regression and Linear Models. McGraw-Hill Higher Edu., New York, 1990: 365–377.
- Hasegawa K, Kimura T, Funatsu K. GA strategy for variable selection in QSAR studies. Quant Struct Act Relat 1999;18:262–272.
- Golbraikh A, Tropsha A. Beware of q2! J Mol Graph Model 2002;20:269–276.
- Cramer RD, Patterson DE, Bunce JD. Comparative molecular field analysis of steroids to carrier Proteins. J Am Chem Soc 1988;110:5959–5967.
- Roy PP, Roy K. On some aspects of validation of predictive quantitative structure–activity relationship models. Expert Opin Drug Discov 2007;2:1567–1577.
- Vighi M, Gramatica P, Consolaro F, Todeschini R. QSAR and chemometric approaches for setting water quality objectives for dangerous chemicals. Ecotoxicol Environ Saf 2001;49:206–220.
- Maggiora G. On outliers and activity cliffss-Why QSAR often disappoints. J Chem Inf Model 2006;46:1535–35.