
Abstract
In the present computational analysis, pharmacophore-based active conformer selection method was used to derive active conformers for the physicochemical descriptors calculation. The significant regression models were validated using different validation methods, which provided significant Q2 values. The distance-based approaches were also used to analyze the discriminant property of the molecules contributed in the models. The Mahalanobis distance (MD) values obtained from these studies revealed that the compounds with very high and very low acting human ether-a-go-go-related gene blockers possessed high MD values, while the predicted activity of those compounds exhibited less residual errors. The results obtained in the studies suggest that the distance-based approaches can be used to validate the quantitative structure-activity relationship models significantly. The descriptors contributed in the models explain that the flexibility of the bonds connected to the aromatic rings or non-polar region of the molecules make π–π interaction with the aromatic residues of the protein.
Introduction
The development of novel therapeutic agents is a formidable task for medicinal and pharmaceutical scientists. More than 35% of all drugs in the development phase fail due to inadequate absorption, distribution, metabolism, excretion and toxicity (including human ether-a-go-go-related gene (hERG) blockade) behaviorsCitation1,Citation2. The interactions between drug molecules and some metabolic molecular targets cause toxic activities and that are responsible for the withdrawal of many marketed drugs and late-stage failures of drugsCitation3. The hERG encodes the major protein underlying a rapid delayed rectifier K+ current in the heart. The blockade of the hERG channel has been associated with the acquired long-QT syndrome (LQTS), is a disorder of myocardial repolarization characterized by a prolonged QT interval on the electrocardiogram (ECG). The blockade of hERG K+ channel is used as a significant target for class III antiarrhythmic drugs, but for all other therapeutic agents, it is an unwanted side effect and which affect the efficiency of the drugsCitation4–10. Therefore, prediction of the hERG binding properties at the early stage of new drug development has become increasingly important. Computational tools in drug design are rapidly growing field and an important component of the computational chemistry disciplineCitation4,Citation11.
Since last few years, in our laboratory, computational-based structure feature analyses works on biologically active moieties and hERG blockers are undergoing for the development of toxic-free novel moleculesCitation5,Citation11–13. Quantitative structure-activity relationship (QSAR) analysis is a technique that analyzes the correlation between the molecular structural features and the activity of the bioactive molecules, which provide information on the structural features responsible for the toxicity of the moleculesCitation5,Citation11–13.
The receptor-based approach and the ligand-based approach have appeared in the literature for the hERG blockers modelingCitation14–16. It showed that within a few years, several hERG models were reported, including classification, 2D-QSAR, 3D-QSAR, pharmacophore, virtual screening, homology models, etc. The 2D-QSAR (regression) methods could give more useful topological structure-activity relationship (SAR) information than other classification models (although classification models are certainly useful)Citation10–19.
In this analysis, we have used a discrete series of hERG blockers for the structural analysis to predict the hERG blocking activity of small molecules. Pharmacophore-based active conformer search method was used to derive significant conformers for descriptor calculationCitation20,Citation21. In this analysis, we have used the distance-based approach to validate the predictive ability of the QSAR modelsCitation22,Citation23. In this study, the Mahalanobis distance (MD) was used to analyze the discriminant property of the molecules contributed in the models. Also the distances between the predicted and the observed activities of the compounds were calculated to examine the predictive ability of the models. Distance-based approaches provide the biased compounds with respect to the contributed descriptors in the regression models. In this analysis, we have used MD-based approach to validate the QSAR models and to confirm the selected descriptors are not biased the regression coefficient prediction.
Experimental
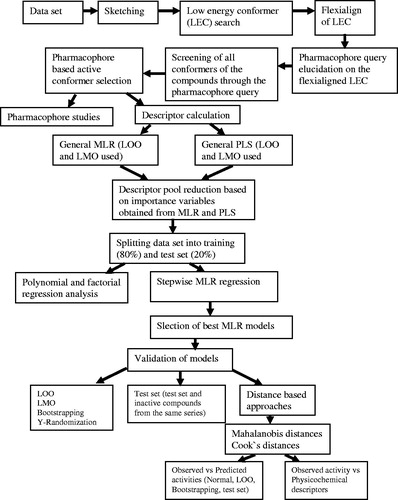
A series of structurally discrete compounds possessed hERG blocking activity has been considered for this computational studies (Table S1)Citation24. Among the 74 compounds, only 64 compounds, those possessed defined hERG blocking activity were considered for the study. The inhibitory constant (Ki, µM) of the molecules was converted into pKi to reduce the skewness of the data. The study flowchart for the present analysis is provided in .
Figure 1. Flow chart for the QSAR work conducted in this analysis.
The Molecular Operating Environment (MOE) software (MOE, Chemical Computing Group Inc., Montreal, Canada, 2007) was used to optimize the energy and to calculate the physicochemical descriptors of the sketched molecules. The semi-empirical MOPAC program with Hamiltonian Austin Model 1 (AM1) force field with 0.05 RMS gradients of MOE software was used to optimize the molecules.
The pharmacophore analysis of the data set was carried out using MOE software. The conformers of the data set was developed by stochastic search with the following force field parameters (maximum number of conformers generated to 250, superpose RMSD to 0.15 and the fragment strain limit of 4 kcal/mol). It calculates the following properties of the aligned structures: the strain energy (U), the mutual similarity score (F) and the value of the objective function (S) of each alignment. The flexialigned structure exhibit lower U, F and S values was considered for the pharmacophore query (template) development and further selection of bioactive conformers. The pharmacophore query is a collection of restrictions imposed upon a ligand annotation and the atoms of a molecule. The purpose of the query is to select a limited subset from a given set of ligand conformations such that all restrictions of the query are satisfied. The pharmacophore contours such as Acc, Don and Aro/Hyd of the query structure were considered as pharmacophore contours for the conformers development. The pharmacophore search option in the software was used to select the bioactive conformers (pharmacophore based) from the conformers of the molecules obtained from the stochastic search method.
In order to investigate and to select the significant variables required for the model development, we have developed a number of multiple linear regression (MLR) models using different training sets (like leave-many-out (LMO)) and leave-one-out (LOO) and only the models exhibiting descriptorsCitation25 with significant statistical parameters were selected for further studies. Also the partial least square (PLS) analysis was performed in order to investigate the importance of the variables for the model building. The data set (with defined activity) was divided randomly as training set (80%) and test set (20%) for the correlation analysis using the Statistica 8.0 software (Statistica (8.0) StatSoft Inc., Tulsa, OK, 2010). The descriptors selected from preliminary analyses were considered for the model building and further validation studies. The statistically significant models were selected for further validation studies by internal (LOO, LMO, bootstrapping (BS) and Y-randomization), distance-based approaches and external (test set) methodsCitation23,Citation26,Citation27 and a data set composed of 58 drugs were used to validate the modelsCitation28 (Table S2). The MD and Cook’s distances were calculated for the compounds to investigate the reliability and predictive ability of the models by distance-based approaches.
Results and discussions
The correlation between the biological activity (hERG blocking activity) and the physicochemical features of the molecules were performed by MLR analysis. Internally consistent QSAR models obtained from the analyses are provided below.
N = 52, R = 0.8423, R2 = 0.7094, Adj R2 = 0.6847, F(4,47,0.01) = 28.6830(3.6490), SEE = 0.4581, t(47,0.0005) = 12.6090(3.2905), p = 0.0000, Beta values SMR_VSA0 = −0.360, vsurf_HL1 = −0.690, vsurf_ID4 = 0.268 and vsurf_Wp2 = 0.366.
N = 52, R = 0.8211, R2 = 0.6743, Adj R2 = 0.6539, F(3,48,0.01) = 33.1230(4.1260), SEE = 0.4799, t(48,0.0005) = 25.4760(3.2905), p = 0.0000, Beta values for vsurf_CW4 = −0.920, vsurf_ID5 = 0.347 and vsurf_IW4 = −0.240.
N = 52, R = 0.8204, R2 = 0.6730, Adj R2 = 0.6526, F(3,48,001) = 32.9330(4.1260), SEE = 0.4809, t(48,0.0005) = 36.2720(3.2905), p = 0.0000, Beta values for PEOE_VSA_FPNEG = −0.370, vsurf_CW5 = −0.870 and vsurf_W7 = 0.302.
The significant QSAR models selected considering their statistical parameters were used for further validation studies. As mentioned earlier, the PLS analysis was performed for the data set with the Nonlinear Iterative Partial Least Squares (NIPALS) algorithm, which provided important variables for the robust and reliable models development. The PLS and the LOO-MLR analysis on the complete data set yielded mainly the van der Waals surface (vdW) area descriptors as the significant contributors for the model development. Hence, we have developed numerous models with the vdW surface area (also vsurf_) and other descriptors to explain the hERG blocking activity of the compounds elaborately. However, the developed models with inadequate statistical parameters were rejected from further validation studies and discussion.
In these models, R is the correlation coefficient and R2 is the squared correlation coefficient. These correlation coefficients describe the relative measure of the quality of fit by the regression equations. R value explains the variation in the observed data (experimental) and its values vary from −1 to +1. The closer the R values to 1, better the fit of the regression equation. R2 values of the training set models are >0.67 (R ≥ 0.8) in MLR analysis. The other regression analysis () such as polynomial and factorial regressions also give the R2 values >0.68 with the same descriptors as the normal MLR. It reveals that the models developed with training set compounds possessed significant fit for activity prediction.
Table 1. QSAR models derived from polynomial and factorial methods.
The values within the parentheses that follow the calculated F values are the tabulated values at 99% significance. t is the Student ttest and the values in the parenthesis after the calculated values, are the tabulated t values at the 99.95% significant level. The F statistics and the ttest values of the models have a large margin of difference for their limiting values at 0.01 (99%) and 0.0005 (99.95%) confidence levels, respectively, which shows that the models are statistically significant for further validation study.
Validation of the models
The goal of any QSAR study is the development of statistically robust models capable of making accurate and reliable predictions of biological activities of new compounds. This can be achieved with the accurate input data, the appropriate descriptors selection and statistical tools and the most importantly validation methods. The derived models were validated to examine the self-consistency between them, which imply a quantitative assessment of the model’s robustness and its predictive power. In this analysis, the statistically significant models derived from the MLR analysis were validated by internal (LOO, LMO, BS and Y-randomization) and external (test set from same data set and drugs from literature) validation methods ().
Table 2. Summary of the QSAR results derived from the present study.
As mentioned earlier, the correlation coefficient values (R or R2) of the models are significant for all the methods of analysis (MLR, polynomial and factorial). The LOO, LMO and BS methods provided significant cross-validated correlation coefficient (Q2) values, which are >0.6. However, the test set compounds also give the Q2 values of >0.5 for all models including the test set of the literature compounds. It may be considered that a high Q2 (for instance Q2 > 0.5) is one of the indicators, that the model is significantly predictiveCitation26,Citation27,Citation29. The residual error analysis is also important to investigate the predictive capacity of the models. The predicted residual analysis explains that the QSAR models developed against the hERG blocking activity provided low SPRESS (<0.6) and SDEP (<0.5 for training set, <0.86 for test set) values and which reveal that the training set models provide small residual values between observed and predicted activities. The PRESS value has significant effect with the Q2 of the models and also affects the SPRESS and SDEP values. The training set models give the PRESS values between 12 and 13.3 and the test sets have the values between 7 and 9 for all models. These show that the predicted residual error values of the training set models are little higher than that of the test set compounds, while the Q2 values for the training and test sets are significant. The predictive capacity of the training set models is also confirmed by other calculated correlation coefficient parameters (predicted R2). The predictive R2 () is one of the parameters that signify the predictive capability of the models to the test set compounds and these values are >0.6. These calculated values are comparatively equal to their corresponding correlation coefficient values (R2), which explain that the selected models exhibited acceptable predictive ability with small prediction errors (Table S3). The scatter plot between the observed and the predicted activity of the training and the test set compounds are represented in .
Figure 2. Observed and predicted activity of (A) training set, (B) test set.
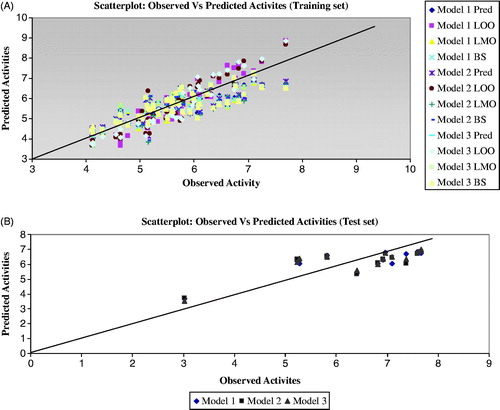
At least one slope of regression lines (k or k′) should pass through the origin, which is confirmed by the values close to 1. The slope of regression lines (k or k′) for the training and the test sets have the values >0.9. It shows that the slope of the regression lines of the training set passes through the origin (0.85 ≤ k ≤ 1.15 or 0.85 ≤ k′ ≤ 1.15).
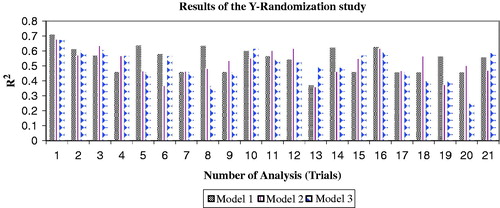
The Y-randomization test was also used to validate the models and it was carried out with the permuted activity data. The randomization experiments yield R2 values with the same descriptors in the original model and are possible comparison with the original R2. If the original QSAR model is statistically significant, its score (R2 value) should be significantly better than those from permuted data. The R2 values for 20 trials based on permuted data are shown in . The R2 values of the original models are higher than any of the trials using permuted data. Hence, the training set models 1–3 are statistically significant and robust.
Figure 3. Randomization analysis results of the study (trial one represent the original R2 values of the models).
The internal and external validation results confirmed that the selected models are reliable and robust. In order to explain the predictive power for the models, further, the activities of the inactive compounds in the data set and the activity of 58 drugs were also predicted (Table S2). The predicted activity (Ki) values of the experimentally inactive compounds are given in Table S3. The predicted activities of some compounds (inactive) are comparable to the experimentally low active compounds in the series. However, some of other compounds in the series (inactive) have the predicted activity values in the range of the active compounds. This may be caused by the topology of activity landscapes, which describes that a small changes in chemical structure of active compounds provide a wide variation in activity. But these compounds have almost same physicochemical properties. Hence, the predicted activity of those compounds (experimentally inactive) fall under the region of active compounds. It also explains that if the chemically similar compounds have different potency, the resulting topology is rugged (when the activity data added at third dimension to a 2D chemical space) and may contain activity cliffs (discontinuous SAR). By contrast, chemically diverse compounds have similar potency in the defined region of smooth topology (continuous SAR). The predicted activity of some compounds deviate widely from the experimental activity that may be due to the experimental conditions in which the compounds possibly did not reach the active site, which would result in good activitiesCitation30,Citation31. When predicting the activities, the physicochemical descriptors determine the activity of the compounds, not the physiological conditions. Hence, those compounds have wide difference between the predicted and the experimental activities.
The multicollinearity and the autocorrelation properties affect the stability, reliability and robustness of the models. In multiple linear models, the multicollinearity results from the regression coefficients of the descriptors may change erratically in response to small changes in the model or the data. But it does not reduce the predictive power or reliability of the model as a whole; it only affects calculations regarding individual predictors. The variance inflation factor (VIF) was used to interpret the multicollinearity problem of each parameter in the regression equation. Not uncommonly, a VIF of 10 or even one as low as 4 (equivalent to a tolerance level of 0.10 or 0.25) have been used as rule-of-thumb to indicate excessive or serious multicollinearityCitation23,Citation29. The VIF values are less than 1.5 for models 1 and 2 and it is near to 2.1 for model 3, confirm that the descriptors in the selected models are free from multicollinearity (Table S4).
The autocorrelation problem was tested by employing the Durbin–Watson (DW) statistics. The DW statistics is useful for evaluating the presence or absence of a serial autocorrelation of residuals from the regression models. If the DW statistic is substantially less than 2, there is evidence of positive serial autocorrelation and a value toward 4 indicates negative autocorrelationCitation23,Citation29.
The tabulated upper and lower bound values of Durbin–Watson were considered to test the hypothesis of zero autocorrelation against the positive and negative autocorrelations. In the present study, the DW values of all models except model 1 (training set) are closer to 2, which show that the values are above the positive autocorrelation and below the negative autocorrelation of the tabulated upper and lower bound values at the 5% significance level (Table S4). These statistical analyses confirm that the selected training set models (1–3) are reliable and robust. It reveals that the descriptors in the models are not biased the activity prediction.
Distance-based approaches
In order to evaluate the distribution of the physicochemical properties and the activities on multidimensional space (also to investigate the outlier property of the molecules), the distance-based approaches were used. These approaches are also used to examine the reliability of the QSAR models. In this analysis, we have calculated the Mahalanobis and Cook’s distances and these approaches represent the distance from each point (case) to a particular point (centroid) in a multidimensional space. Cook’s distances indicate the distances between the computed B values (standard coefficient values) and the values one would have obtained if the respective case has been excluded (LOO). All distances should be of about equal magnitude, otherwise there is reason to believe that the respective case(s) biased the estimation of the regression coefficientsCitation32–34. The maximum Cook’s distance for the training set models are <0.50 which is <1 (squared Cook’s distances)Citation32,Citation33, show that the models have significantly predicted the hERG blocking activity (). This confirms that none of the compounds in the data set (training set) biased for the estimation of regression coefficients of the models. But the test set compounds have the Cook distance values >1 for model 1 and 2 (correlation between observed and predicted activities). This may be due to a variation in activity of the compounds. It reveals that the models predicted the activity of the test compounds with large residual values to their corresponding observed activity. But those compounds have acceptable cross-validated correlation coefficient values of >0.5.
Table 3. Summary of MD-derived from all models using different validation techniques.
The MD is the distance of a case from the centroid (the mean point in the multidimensional space), defined by the correlated independent variables (either physicochemical properties or predicted activity). Thus, this MD value indicates that whether or not an observation is an outlier with respect to the independent variable values. If the distance between the test point and the center of mass is less than one standard deviation, then we might conclude that it is highly probable that the test point belongs to the set. Further, if the point is away from the centroid, the more likely that the test point should not be classified as belonging to the setCitation22,Citation23.
MD values identify the interpolation region by assuming that the data have a normal distribution and are calculated by Equations (1) and (2).
where ∑−1 is the inverse of the covariance matrix.
where
is the determinant of the variance–covariance matrix.
Mahalanobis distances improve the prediction accuracy and speed up a solution for QSARCitation22,Citation23. The higher the Mahalanobis distances for a case (molecule), the more the independent variables diverge from the average values (Tables S5, S6; ). Those compounds may consider as outlier in the series or biased in the model building and activity prediction. In this analysis, the calculated minimum MD values of the MLR regression models are between 0.08 and 0.46, while the validation methods (correlated between observed and predicted activities) are provided the values <0.005. The average MD values of the training set compounds are <4 and the test set are <1 (). The maximum MD values of the compounds provide the information on the significance of the compound in the data set contributed for activity prediction (whether biased or not biased the estimation of regression coefficient prediction). Considering the maximum MD values of the models, the model 1 has provided the maximum value of 11.1929 (compound 63). This reveals that the compound which possessed high MD values may discriminate from other compounds in multidimensional space and the high MD values may be due to the structural topology of the compounds. When comparing the physicochemical descriptor values, this compound (compound 63) has comparable vsurf-ID4 (0.5036), vsurf_Wp2 (666.75) and vsurf_HL1 (0.0963) values as the active and medium active compounds, but has relatively high SMR_VSA0 value (120.96). Hence, this SMR_VSA0 value may cause the discriminant property. The MD values calculated between the observed and the predicted activities explain that the MD values of the compounds have increased with small (decreased) biological activity than the medium activity. It shows that the low active compounds in the series have biased in the activity prediction (biased the regression coefficient). The activity predicted through LOO showed that the compound (compound 46) with higher activity possessed higher MD values for all models (models 1–3). It explains that the highly active and low active compounds in the series may discriminate from the rest of the molecules in the data set, which caused the structural topology of the molecules (in MLR analysis we can consider those compounds as outliers). Interestingly, the compound 46 (highly active compound) has very low SMR_VSA0. In the model 1, the SMR_VSA0 has contributed negatively, which showed that higher descriptor values detrimental to the activity. However, the compounds 26 and 27 also have the SMR_VSA0 values near to the value compound 46, but those compounds do not have activity.
Figure 4. Graphical representation of MD obtained from different studies.
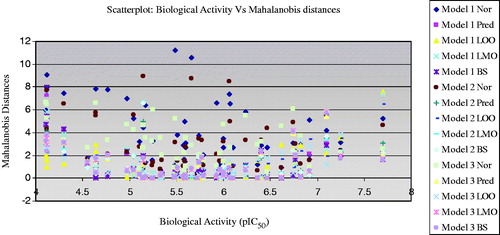
Table 4. Mahalanobis distances of the test set compounds.
The MD results obtained from the regression between the observed and the predicted activities showed that less number of compounds possessed high MD values. Compound 46 has almost higher MD values for all the validation results as discussed earlier. Other compounds in this series do not have high MD values as compound 46 against all the validation results revealing that those compounds are not biased by the regression coefficient determination. It confirms that the selected regression models have constructed with proper descriptors and are predicted the activity with acceptable residual errors and MD values.
The compounds 53 and 63 have the MD values >10 for model 1, but these compounds have moderate hERG blocking activity. The MD values of the predicted activity of these compounds are small, hence only the MLR model yielded high MD values. Compounds 35 and 37 have high MD values for all models and the predicted activity of these compounds also biased from the centroid point. Also these compounds possessed very low activity. However, these compounds have the SMR_VSA value of 114.27 and 90.41, respectively, which are higher in the series and these two compounds possessed higher vdW_CW4 values (>0.7). These results confirmed that the physicochemical descriptor values play an important role for the calculation of MD values of the models and affects the predictive capacity of the molecules.
Three significant models selected from the studies are made of the vsurf_ descriptors such as vsurf_Wp2, vsurf_ID4 and vsurf_HL1 in model 1, the vsurf_ID5, vsurf_IW4 and vsurf_CW4 in model 2 and the vsurf_W7 and vsurf_CW5 in model 3. The vsurf_ descriptors are volume, shape and surface properties depending on the structural connectivity and the conformation (dimensions are measured in Å) of the molecules. These descriptors explain the interaction of molecules with hydrophobic and hydrophilic part of the protein through some surface properties such as shape, electrostatic, hydrogen-bonding and hydrophobicityCitation25,Citation34. The vsurf_ descriptors contributed in these models (1–3) showed that those descriptors display hydrophobic properties with positive sign on the regression coefficient and those descriptors which illustrated the hydrophilic properties have negative sign. It revealed that the hydrophobic properties on the vdW surface have significant contribution for the activity prediction. The positive contribution of the hydrophobic integy moments (vsurf_ID4 and 5) and the negative contribution of the hydrophilic integy moments (vsurf_IW4) reveal that the dense hydrophobic properties on the vdW surface area separated from the distributed hydrophilic properties provided considerable impact on the activity. The polar and hydrophilic volume descriptors such as vsurf_Wp2 and vsurf_W7 have showed favorable effect on the activity prediction. This suggests that the increased surface volume can decrease the density of hydrophilic property on unit surface of the molecules (vsurf_CW4 and 5). The negative sign of the hydrophilic and hydrophobic balance also suggests that the hydrophobic property of the molecules has significant effect. The hydrophobic effect of the molecules may be aroused from the substitution of the hydrophobic groups or aromatic rings in the molecules. The reported compounds show that the molecules with more aromatic rings have better activity.
The subdivided surface area (SMR_VSA0) and the partial charge descriptors (PEOE_VSA_FPNEG) are also contributed negatively in the models. These are explaining the molar refractivity and the fractional negative polar vdW surface area of the molecules. These polar descriptors on the models also confirm the necessity of hydrophobic properties on the vdW surface of the molecules for the hERG blocking activity.
The above-mentioned statements (the importance of hydrophobic property for the activity) are also supported by the descriptors values of the compounds. Those molecules possessed high SMR_VSA0 values that have less hERG blocking activity and the molecules with very low descriptor values have high hERG blocking activity. The beta values of the models described the relative contribution of the descriptors for the activity prediction. This statistical parameter explains that the ratio between the hydrophilic and hydrophobic property is an important vdW surface property for the hERG blocking activity. The descriptors contributed in the models as well as the statistical data (beta values) of the models confirm that the less distribution of hydrophilic property on the vdW surface area of the molecules have proper implementation for the activity prediction.
In order to support the significance of the physicochemical descriptors for the hERG blocking activity, the pharmacophore and molecular surface analysis on the flexialigned compounds were performed, which explain that the polar properties are distributed in the molecular surface and the aromatic/hydrophobic property of the molecules should be far away from the polar site (Figure S1 and S2). The pharmacophore contours showed that the acceptor and the hydrophobic/aromatic/acceptor regions in the molecules play an important role for the activity.
The effect of the hydrophobic and hydrophilic descriptors for the hERG blocking interactions were compared with their active site features. The earlier reports explain that the amino acid residues present in the pore domain of the α-subunit in the active site cause the channel blockade. The Phe656 and Tyr652 amino acid residues in the pore domain (especially in the S6 helix) is preferable for the molecules binding. It makes aromatic/hydrophobic environment for the molecules binding. Other amino acid residues such as Tyr623 and Ser624 also have affinity towards activators or blockers, but it has less affinity than the former one (Phe656 and Tyr652)Citation35–39. This supports the importance of the contributed descriptors for the interactions. The active site environment of the protein showed that the aromatic amino acids play a crucial role for the inhibitors binding. The results obtained from the QSAR and pharmacophore analysis reveal that the vdW surface properties especially the hydrophobic property play an important role for the blocking activity. The hydrogen bond donor and acceptor properties also needed for the activity because the active site of the protein has Ser624 amino acid.
Conclusion
The results derived from the study showed that the distance-based approach can be used to validate the models with other methods. In this study, limited compounds provided higher MD values, while those compounds yielded the predicted activities with small residuals errors (evenly, have low MD values with predicted activities). The fragmental analysis of the studied compounds also showed that the compounds possessed more aromatic rings have significant activity and the presence of more polar substituents in the aromatic rings have unfavorble effect on the activity. Flexibility of the bonds connected to the aromatic rings or non-polar region of the molecules also pertain better activity. The presence of aromatic rings with flexible bonds makes π–π interaction with the aromatic residues of the protein and which provide hydrophobicity to the molecules. The results derived from this study along with the structure-based drug design and mechanism studies will be helpful for designing novel moieties with less/free of hERG blockade.
Declaration of interest
Authors do not have any conflict on the manuscript.
N.S.H.N. Moorthy is grateful to the Fundaçao para a Ciencia e Technologia (FCT), Portugal for a Postdoctoral Grant (SFRH/BPD/44469/2008).
References
- Thai KM, Ecker GF. A binary QSAR model for classification of hERG potassium channel blockers. Bioorg Med Chem 2008;16:4107–19
- Moorthy NSHN, Karthikeyan C, Trivedi P. Synthesis, cytotoxic evaluation and in silico pharmacokinetic prediction of some benzo[a]phenazine-5-sulfonic acid derivatives. Med Chem 2009;5:549–57
- Bugrim A, Nikolskaya T, Nikolsky Y. Early prediction of drug metabolism and toxicity: systems biology approach and modeling. Drug Discov Today 2004;9:127–35
- Aronov AM. Predictive in silico modeling for hERG channel blockers. Drug Discov Today: Biosilico 2005;10:149–55
- Moorthy NSHN, Sousa SF, Ramos MJ, Fernandes PA. In silico based structural analysis of arylthiophene derivatives for FTase inhibitory activity, hERG and other toxic effects. J Biomol Screen 2011;16:1037–46
- Durdagi S, Guo J, Lees-Miller JP, et al. Structure-guided topographic mapping and mutagenesis to elucidate binding sites for the human ether-a-go-go-related gene 1 potassium channel (KCNH2) activator NS1643. J Pharmacol Exp Ther 2012;342:441–52
- Subbotina J, Yarov-Yarovoy V, Lees-Miller J, et al. Structural refinement of the hERG1 pore and voltage-sensing domains with ROSETTA-membrane and molecular dynamics simulations. Proteins 2010;78:2922–34
- Vandenberg JI, Perry MD, Perrin MJ, et al. hERG K+ channels: structure, function, and clinical significance. Physiol Rev 2012; 92:1393–478
- Sanguinetti MC, Tristani-Firouzi M. hERG potassium channels and cardiac arrhythmia. Nature 2006;440:463–9
- Su BH, Shen MY, Esposito EX, et al. In silico binary classification QSAR models based on 4D-fingerprints and MOE descriptors for prediction of hERG blockage. J Chem Inf Model 2010;50:1304–18
- Moorthy NSHN, Ramos MJ, Fernandes PA. hERG binding feature analysis of structurally diverse compounds by QSAR and fragmental analysis. RSC Adv 2011;1:1126–36
- Moorthy NSHN, Ramos MJ, Fernandes PA. Analysis of van der Waals surface area properties for human ether-a-go-go-related gene blocking activity: computational study on structurally diverse compounds. SAR QSAR Environ Res 2012;23:521–36
- Moorthy NSHN, Ramos MJ, Fernandes PA. Structural analysis of 2-piperidin-4-yl-actamide derivatives for hERG blocking and MCH R1 antagonistic activities. Curr Drug Discov Tech 2012;9:25–38
- Du L, Li M, You Q, Xia L. A novel structure-based virtual screening model for the hERG channel blockers. Biochem Biophy Res Comm 2007;355:889–94
- Durdagi S, Duff HJ, Noskov SJ. Combined receptor and ligand-based approach to the universal pharmacophore model development for studies of drug blockade to the hERG1 pore domain. J Chem Inf Model 2011;51:463–74
- Du-Cuny L, Chen L, Zhang S. A critical assessment of combined ligand- and structure-based approaches to hERG channel blocker modeling. J Chem Inf Model 2011;51:2948–60
- Yoshida K, Niwa T. Quantitative structure–activity relationship studies on inhibition of hERG potassium channels. J Chem Inf Model 2006;46:1371–8
- Beshore DC, Liverton NJ, McIntyre CJ, et al. Discovery of triarylethanolamine inhibitors of the Kv1.5 potassium channel. Bioorg Med Chem Lett 2010;20:2493–6
- Shen MY, Su BH, Esposito EX, et al. Comprehensive support vector machine binary hERG classification model based on extensive but biased end point hERG data sets. Chem Res Toxicol 2011;24:934–49
- Lavalle SM, Finn P, Kavraki LE, Latombe JC. A randomized kinematics-based approach to pharmacophore-constrained conformational search and database screening. J Comput Chem 2000;21:731–47
- Moorthy NSHN, Ramos MJ, Fernandes PA. Pharmacophore based screening and QSAR analysis of structurally diverse compounds for lead selection and optimization against multiple targets. OpenTox InterAction Meeting on Innovation in Predictive Toxicology; 2011 Aug 10–12; Munich, Germany
- De Maesschalck R, Jouan-Rimbaud D, Massart DL. The Mahalanobis distance. Chemom Intell Lab Sys 2000;50:1–18
- Moorthy NSHN, Sousa SF, Ramos MJ, Fernandes PA. Structural feature study of benzofuran derivatives as farnesyltransferase inhibitors. J Enz Inhibit Med Chem 2011;26:777–91
- Jamieson C, Moir EM, Rankovic Z, Wishart G. Medicinal chemistry of hERG optimizations: highlights and Hang-ups. J Med Chem 2006;49:5029–46
- Lin A. QuaSAR-descriptors. Montreal, Canada: Chemical Computing Group Inc.; 2002
- Golbraikh A, Tropsha A. Beware of Q2. J Mol Graphs Model 2002;20:269–76
- Moorthy NSHN, Ramos MJ, Fernandes PA. Analysis of α-glucosidase inhibitory activity of chromenone derivatives by its molecular features: a computational study. Med Chem 2011;7:526–33
- Choe H, Nah KH, Lee SN, et al. A novel hypothesis for the binding mode of hERG channel blockers. Biochem Biophy Res Comm 2004;344:72–8
- Moorthy NSHN, Ramos MJ, Fernandes PA. Structural analysis of α-glucosidase inhibitors by validated QSAR models using topological and hydrophobicity based descriptors. Chemom Intell Lab Sys 2011;109:101–12
- Guha R, Van Drie JH. Structure-activity landscape index: identifying and quantifying activity cliffs. J Chem Inf Model 2008;48:646–58
- Moorthy NSHN, Ramos MJ, Fernandes PA. Comparative structural analysis of α-glucosidase inhibitors against difference species: a computational study. Arch Pharm 2012;345:265–74
- Moorthy NSHN, Ramos MJ, Fernandes PA. Structural analysis of structurally diverse α-glucosidase inhibitors for active site feature analysis. J Enz Inhibit Med Chem 2012;27:649–57
- Cook RD. Influential observations in linear-regression. J Am Stat Assoc 1979;74:169–74
- Cruciani C, Crivori P, Carrupt PA, Testa B. Molecular fields in quantitative structure-permeation relationships: the VolSurf approach. J Mol Struct (Theochem) 2000;503:17–30
- Myokai T, Ryu S, Shimizu H, Oiki S. Topological mapping of the asymmetric drug binding to the human ether-a-go-go-related gene product (hERG) potassium channel by use of tandem dimmers. Mol Pharmacol 2008; 73:1643–51
- Moorthy NSHN, Ramos MJ, Fernandes PA. Human ether-a-go-go-related gene channel blockers and its structural analysis for drug design. Curr Drug Targets 2013;14:102–13
- Durdagi S, Subbotina J, Lees-Miller J, et al. Insights into the molecular mechanism of hERG1 channel activation and blockade by drugs. Curr Med Chem 2010;17:3514–32
- Perrin MJ, Kuchel PW, Campbell TJ, Vandenberg JI. Drug binding to the inactivated state is necessary but not sufficient for high-affinity binding to human ether-à-go-go-related gene channels. Mol Pharmacol 2008;74:1443–52
- Durdagi S, Deshpande S, Duff HJ, Noskov SY. Modeling of open, closed, and open-inactivated states of the hERG1 channel: structural mechanisms of the state-dependent drug binding. J Chem Inf Model 2012;52: 2760–74