
Abstract
The human pathogen Mycobacterium tuberculosis contains three β-carbonic anhydrases (CAs, EC 4.2.1.1) in its genome. Inhibition of some of these CAs was shown to modulate the growth of M. tuberculosis. 3D-QSAR Comparative molecular field analyses (CoMFA) were carried out on inhibitors of the enzyme Rv3588c (also denominated mtCA 2). A series of sulfonamides known to inhibit mtCA 2, including some diazenylbenzenesulfonamides, was considered in our study. The predictive ability of the model was assessed using a test set of seven compounds. The best model has demonstrated a good fit having predictive r2 value of 0.93 and cross-validated coefficient q2 value as 0.88 in tripos CoMFA region. Our results indicate that the steric and electrostatic factors play a significant role in mtCA 2 inhibition for the investigated compounds. We proposed nine new not yet synthesized mtCA 2 inhibitors, all of them probably with significantly improved anti-Rv3588c inhibitory activity.
Introduction
The carbonic anhydrases (CAs, EC 4.2.1.1) are enzymes widely distributed throughout the phylogenetic tree, with five genetically unrelated classes (α, β, γ, δ and ζ) known to dateCitation1,Citation6. These proteins which catalyze the interconversion between carbon dioxide and bicarbonate, with release of a proton, are involved in crucial physiological processes connected with respiration and transport of CO2/bicarbonate between metabolizing tissues and lungs, pH and CO2 homeostasis, electrolyte secretion in a variety of tissues/organs, biosynthetic reactions (such as gluconeogenesis, lipogenesis and ureagenesis), bone resorption, calcification, tumorigenicity and many other physiologic/pathologic processesCitation2–6.
The widely spread human pathogen Mycobacterium tuberculosis contains three β-CA genes in its genome, that is, Rv1284 (encoding for a protein we named mtCA 1), Rv3588c (encoding for mtCA 2) and Rv3273 (encoding for a third enzyme, mtCA 3)Citation7–10. Other, Mycobacterium related infections (e.g. Mycobacterium avium) affect a large number of the world population, with an estimated 8.7 million new cases each year, many (1.4 million) of which leading to deathsCitation11–14.
Multi-drug resistant and extensively multi-drug resistant tuberculosis (TB) worsens even more the situation, as such strains are now present in many countries, and posing serious concern to the global healthcare system, as this disease is largely unresponsive to the presently available drugsCitation11. The drug resistance problem of antifungals and antibiotics represents a serious medical problemCitation15.
β-CAs inhibition offers the possibility to discover new drug targets, belonging to the anti-infective classes (antifungal and antibacterial agents), possessing a different mechanism of action compared to the classical pharmacological agents in clinical use for a long period, for which pathogenic fungi and bacteria developed various degrees of resistanceCitation16–18. One of our groups reported the characterization and inhibition studies with a panel of sulfonamides for the M. tuberculosis β-CA, the one encoded by gene Rv3588c and denominated mtCA 210. This enzyme has been reported and characterized crystallographically by Covarrubias et al.Citation7,Citation8.
3D quantitative structure-activity relationship (3D-QSAR) studies have been found to be of great importance to design and develop potent drugs. Comparative molecular field analysis (CoMFA) used for the 3D-QSAR methodology correlates the biological activity of a series of molecules with their 3D shape and their electrostatic and steric characteristics. Thus, attempts have been made to design and develop potent inhibitors for the β-CA from M. tuberculosis (mtCA 2 encoded, by the gene Rv3588c) for the treatment of TB. QSAR finds the parameters of the compounds that govern their biological activities and throw the light on their mechanism of action. Both these aspects of QSAR greatly help modify the structures of the compounds leading to compounds of high therapeutic valueCitation19–25.
Materials and methodology
Calibration set (experimental data)
Recently, one of our groups has reportedCitation10 the first inhibition study against M. tuberculosis, a β-CA (encoded by gene Rv3588c also denominated mtCA 2) with a series of sulfonamides. The set of 25 sulfonamide and their inhibitory activities against mtCA 2 is presented in and . The enzyme inhibition data KI values in the micromolar range were converted in “A” according to the formula A = log (3.460 × 10³/KI) and subsequently, used as the dependent variable for 3D-QSAR study (). The inhibitory activity (A) value of the molecules under the study spanned a wide range from 1 to 4.
Figure 1. Structural details of benzene sulphonamide and diazenylbenzenesulfonamides as mtCA 2 inhibitor (index with asterisk * molecules of test set).
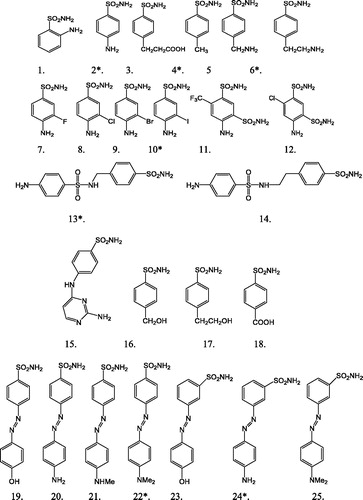
Table 1. Observed, estimated, residual, values of mtCA 2 inhibitory activity (A) for the molecules used in the calibration set for CoMFA (tripos standard region).
Validation set (test set)
For the validation of the method, we have proceeded to a QSAR study with a validation set (test set) and reduced calibration set (training set). The test set was extracted from the homogenized calibration set. For the present work, the selection of the test set was done based on the hierarchical clustering techniqueCitation26. Cluster analysisCitation26 is a method of arranging objects into groups. In the present work, the molecules with rank 2, 4, 6, 10, 13, 22 and 24 have constituted the test set and the remaining as the training set. The test set of seven molecules (28% of database) has captured all the features and spans the activity range of the entire dataset. The series of inhibitory activity (A) values and compounds chosen to be part of the training and test sets are listed in and .
Table 2. Observed log KI, calculated log KI and residual values of compound used in the test set for CoMFA (tripos region).
Prediction set (design of new compounds)
The prediction set contains nine other not yet synthesized substituted sulfonamides generated by BroodCitation27 software having unknown observed values of activity () and their structure is provided in . Brood uses the shape and attachment geometry of the query fragment to identify a family of similar fragments. The search for new mtCA 2 inhibitors is important for medicinal chemistry. Therefore, the structures of the prediction set molecules were selected mainly by their possibility to be synthesized in laboratory conditions and taking into account the commercial availability of the raw materials.
Figure 2. The chemical structure of prediction set molecules not yet synthesized having unknown observed values of activity (A).
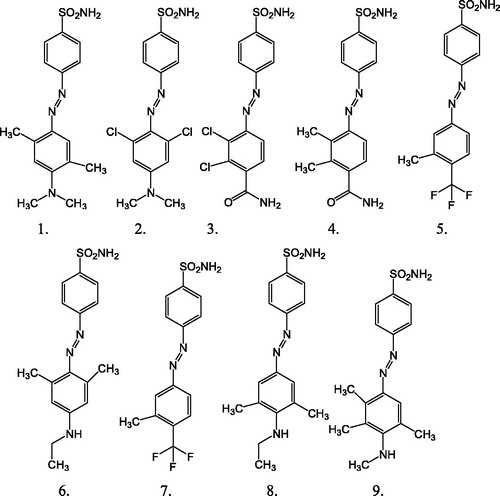
Table 3. Estimated inhibitory activity (A) of mtCA 2 (Mycobacterium tuberculosis) inhibitors of not yet synthesized molecule.
Template selection and alignment
In the development of the 3D-QSAR models, the choice of the template conformation is important to provide the illustration of a reliable pharmocophore model. Compound no. 21 was selected as a molecular template. This compound was chosen mainly for its importance as a lead structure; in addition, compound no. 21 is one of the most potent inhibitors of mtCA 2. There are three different methods of alignment in the CoMFA viz Multifit, Atom fit and Database. We have used database alignment in the CoMFA study on mtCA 2 inhibitor.
CoMFA
The initial CoMFA model was calculated using the Sybyl 7.2 molecular modeling software, for the calculation of charges, the Gastiger–Huckel method was used as implemented in Sybyl 7.2. The aligned data set molecules were placed in a 3D grid box, such that a entire set was included in it, CoMFA fields were generated using sp3 carbon probe atom carrying +1 charge to generate steric (Lennard–Jones) 6–12 potential, and electrostatic (Coulombic potential) fields at each grid point. The steric and electrostatic energy values in CoMFA were truncated at 30 Kcal/mol. The CoMFA fields were sealed standard tripos CoMFA. The CoMFA fields with observed biological activity (A) were included in a molecules spread sheet and Partial Least Square (PLS)Citation28 method was applied to generate 3D-QSAR models. The PLS algorithm with the leave-one-out (LOO)Citation29 cross-validation method was employed to choose optimum number of component and assess the statistical significance of each model. All cross-validation PLS analyses were performed with a column filters values of 2.0.
The cross-validated coefficient, q2 was calculated using
where Y predicted, Y observed and Y mean are predicted, actual and mean values of the target inhibitory activity (A), respectively.
The optimum number of components was chosen which gave less SE of prediction and high . In addition, the
and number of components, the conventional correlation coefficient r2 and its SE were also computed for model. The predictive r2 (
) value was calculated using
where SD is the sum of squared deviation between biological activity of the test set and mean activity of training set molecules, and PRESS is the sum of squared deviation between the actual and the predicted activity values for every molecule in the test set. The CoMFA results were graphically interpreted by field contribution maps, using the stDEV × COEFF: field type. The used statistical method does not identify outlier molecules in calibration set.
Results and discussion
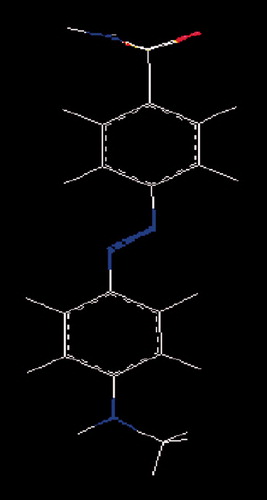
The CoMFA 3D-QSAR methods are used on the assumption that the changes in binding affinities of ligands are related to changes in molecular properties represented by fields. The alignment rule and the bioactive conformation are crucial variables in any 3D-QSAR analysis as both will affect outcome of statistical analysis. We have used database alignment in the study and compound no. 21 was used a template for the molecules. The best fit conformation and sub structure used for alignment are shown in .
Figure 3. Best fit conformation.
CoMFA 3D-QSAR analysis
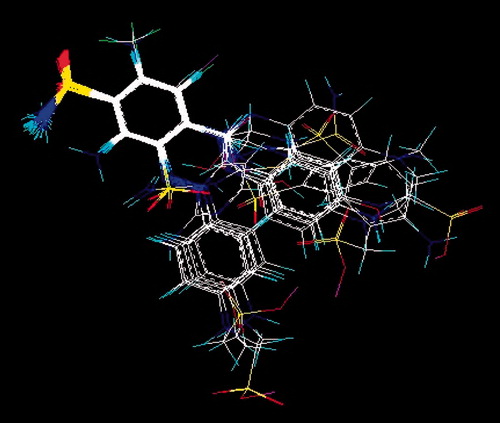
Steric and electrostatics CoMFA fields were generated using standard procedure. The calibration set of 25 modulators was aligned () to derive the conventional CoMFA models. Thus, one model was generated, with template molecule using database alignment rule.
Figure 4. Alignment of molecule in database.
In this study, we have used the default CoMFA setting, which included both steric and electrostatic fields, and use by alignment in tripos standard region. The LOO cross-validated PLS analysis of the best model gave rise to a cross-validated value (q2) of 0.88 at three component suggesting that the model is a useful tool for predicting mtCA 2 inhibitory activity. The correlation coefficient between the calculated and experimental activities of non cross validated value (r2) of 0.993 with SE 0.058 indicates that the fitness of analyzed results is 99% compared to experimental results. The steric and electrostatic fields contribution of the model is (58:42), indicating that the contribution of steric fields and electrostatics both are requirement on ligand fields interaction.
The statistical parameters of CoMFA analysis of calibration set compounds are summarized in . Based on the above observation, the best CoMFA model obtained with database alignment was then chosen for further analysis. The observed and estimated inhibitory activity (A) values of the calibration set are shown in . The correlation of observed vs. estimated inhibitory activity of the calibration set are shown in .
Figure 5. Observed versus estimated inhibitory activity (A) of calibration set.
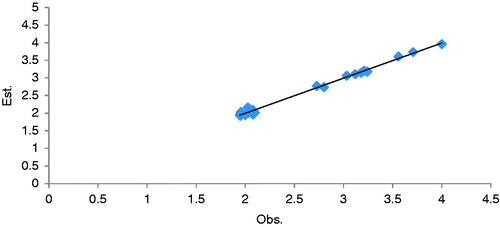
Table 4. Summary of 3D-ASAR analysis on mtCA 2 inhibitors of CoMFA on tripos standard region.
Predictive ability of CoMFA models
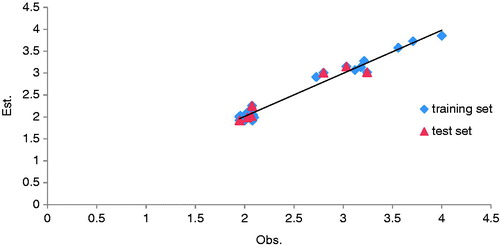
The predictive ability of CoMFA models can be evaluated based on q2, the cross-validated LOO correlation coefficient, which quantifies the predictive ability of the model. Models are considered to be good predictive power when q2 is >0.5. A test set was to further validate the predictive power of CoMFA models, a predictive r2 value (pred-r2). In the presence of the test set, we obtained the 3D-QSAR CoMFA model for the training set (for 18 molecules); predicted results are summarized in . exhibit the q2 and are 0.854 and 0.934, respectively, so the 3D-QSAR model should be suitable for the design of new mtCA 2 inhibitors. The observed and estimated inhibitory activity (A) values of test set are shown in . We can state that the estimated value for the molecules in the test set (validation set) are close to the mtCA 2 experimental inhibitory value and has ordered the molecules in a sequence similar enough to the real one inhibitory value. The correlation of observed vs. estimated inhibitory activity of the training and test set are shown in .
Figure 6. Observed versus estimated inhibitory activity (A) of training set and test set.
The contour map of CoMFA divided in region
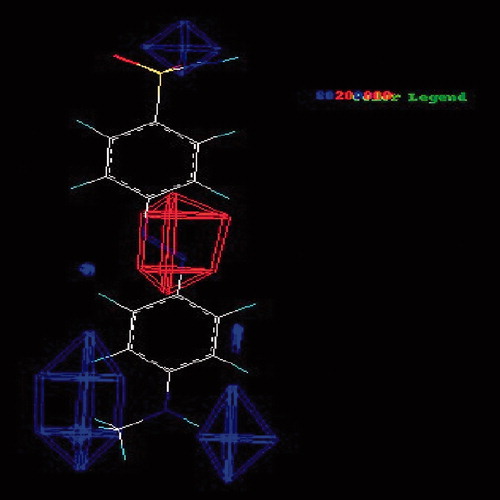
The CoMFA steric field, the green (stererically favorable) and yellow (stererically unfavorable) contour’s represent 80% and 20% level contribution shown in . The red (negative charge favorable) and blue (positive charge favorable) contours in the CoMFA electrostatic field also represent 20% and 80% level contribution shown in .
Figure 7. The CoMFA the steric field, the green (stererically favorable) and yellow (sterically unfavorable) contours.
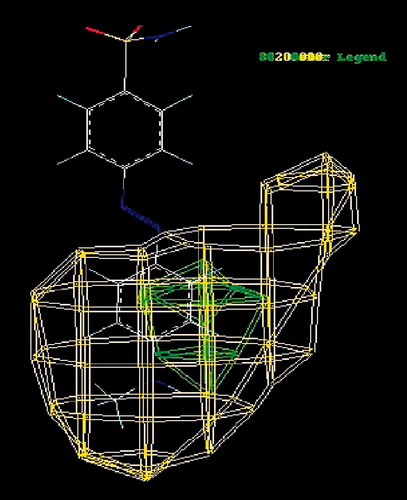
Figure 8. The CoMFA the electrostatic field, the red (negative charge favorable) and blue (positive charge favorable) contours.
The steric and electrostatic contour map elucidate the CoMFA models with the highly active inhibitor compound no. 21 (A = 4) as a reference. The steric contour map for the CoMFA model shows that one region at benzene ring positions (diazenylbenzenesulfonamides) has been identified with green polyhedron, which indicate that bulky substituents at these positions may improve the activities. So, addition of a bulky group at this position is favorable to the binding affinities. The greater values of bioactivity measurement are correlated with more bulk near green, less bulk near yellow.
The electrostatic contour map for the CoMFA models shows that two regions of the both side of benzene ring positions have been identified with blue polyhedron, which indicate that the electropositive groups at these positions may improve the activities and the big red region between the two benzene ring shows that the electronegative group at this position may also improve the activity. So, indicates that the more positive charge near blue and more negative charge near red, favorable to the binding affinities.
Prediction set (design of virtually new compounds)
This work allowed the prediction of a set compounds shown in , not yet synthesized molecule, and their inhibitory activity (A) has also been calculated by the PLS method. We have proposed a library of nine new structures, some of which may show improved mtCA 2 inhibitory activity () in comparison with the parent compounds. This hypothesis should be verified experimentally.
Conclusions
This is the first study which evidenced by means of 3D-QSAR calculations specific features for the inhibition of Rv3588c (mtCA 2), in its interaction with sulfonamide inhibitors. The developed model possesses promising predictive ability as discerned by the test set of seven compounds which were not included in training set. So, the model should be useful to explain the relationship between compound structures and biological activities and to facilitate design of more potent compounds as mtCA 2 inhibitors.
The contour plots provided many useful insights into relationships between structural features and inhibitory activity and also give a picture of the main chemical features responsible for the significant inhibitory activity. The steric and electrostatic fields were shown to be the most important parameters controlling the inhibitory activity. These fields identified the functional group and atoms possibly related to the binding and inhibition. Thus, the proposed models can used to predict the biological activity of compounds before their actual biological testing and provide some insight into structural features for screening of compounds for mtCA 2 inhibitory activities in early drug development stage. The proposed nine molecules (not yet synthesized, belonging to the diazenylbenzenesulphonamide class) prediction set includes molecules presumably having high inhibitory activity.
Declaration of interest
Authors do not have any conflict on the manuscript.
Acknowledgements
One of the author (S.S.) expresses her thanks to the University Grants Commission, New Delhi, India for providing financial support under UGC Research Award No. F.30-29/2011(SA-II). This article is dedicated to the memory of the late Prof. Padmakar V. Khadikar (1936–2012).
References
- Supuran, CT. Carbonic anhydrase inhibitors. Bioorg Med Chem Lett 2010;20:3467–74
- Supuran CT. Therapeutic applications for inhibitors and activators. Nat Rev Drug Discov 2008;7:168–81
- Mincione F, Menabuoni L, Supuran CT. Clinical applications of the carbonic anhydrase inhibitors in ophthalmology. In: Supuran CT, Scozzafava A, Conway J, eds. Carbonic anhydrase, its inhibitors and activator. Boca Raton (FL): CRC Press; 2004
- Supuran, CT. Carbonic anhydrases: catalytic and inhibition mechanisms, distribution and physiological roles. In: Pacscas I, ed. Carbonic anhydrase and modulation of physiologic and pathologic process in the organism. Timisoara, Romania: Helicon; 1994
- Supuran CT, Scozzafava A, Casini A. Development of sulfonamide carbonic anhydrase inhibitors (CAIs). In: Supuran CT, Scozzafava A, Conway J, eds. Carbonic anhydrase, its inhibitors and activators. Boca Raton (FL): CRC Press; 2004
- Supuran CT, Scozzafava A, Casini A. Carbonic anhydrase inhibitors. Med Res Rev 2003;23:146–89
- Covarrubias AS, Larsson AM, Hogbom M, et al. Structure and function of carbonic anhydrases from Mycobacterium tuberculosis. J Biol Chem 2005;280:18782–9
- Covarrubias AS, Bergfors T, Jones TA, Hogbom M. Structural mechanics of the pH-dependent activity of beta-carbonic anhydrase from Mycobacterium tuberculosis. J Biol Chem 2006;281:4993–9
- Nishimori I, Minakuchi T, Vullo D, et al. Carbonic anhydrase inhibitors. Cloning, characterization, and inhibition studies of a new beta-carbonic anhydrase from Mycobacterium tuberculosis. J Med Chem 2009;52:3116–20
- Carta F, Maresca A, Covarrubias AS, et al. Carbonic anhydrase inhibitors. Characterization and inhibition studies of the most active beta-carbonic anhydrase from Mycobacterium tuberculosis, Rv3588c. Bioorg Med Chem Lett 2009;19:6649–54
- Dye C. Doomsday postponed? Preventing and reversing epidemics of drug-resistant tuberculosis. Nat Rev Microbiol 2009;7:81–7
- Ginsberg AM. Emerging drugs for active tuberculosis. Semin Respir Crit Care Med 2008;29:552–9
- Showalter HD, Denny WA. A roadmap for drug discovery and its translation to small molecule agents in clinical development for tuberculosis treatment. Tuberculosis 2008;88:S3–17
- Tomioka H, Tatano Y, Yasumoto K, Shimizu T. Recent advances in antituberculous drug development and novel drug targets. Expert Rev Respir Med 2008;2:455–71
- Pai MP, Turpin RS, Garey KW. Association of fluconazole area under the concentration-time curve/MIC and dose/MIC ratios with mortality in nonneutropenic patients with candidemia. Antimicrob Agents Chemother 2007;51:35–9
- Bennett JE, Izumikawa K, Marr KA. Mechanism of increased fluconazole resistance in Candida glabrata during prophylaxis. Antimicrob Agents Chemother 2004;48:1773–7
- Tsai HF, Krol AA, Sarti K, Bennett JE. Candida glabrata PDR1, a transcriptional regulator of a pleiotropic drug resistance network, mediates azole resistance inclinical isolates and petite mutants. Antimicrob Agents Chemother 2006;50:1384–92
- Hanage WP, Fraser C, Tang J, et al. Hyper-recombination, diversity and antibiotic resistance in pneumococcus. Science 2009;324:1454–7
- Saini L, Gupta SP, Kumar Satuluri VSA. QSAR study on some series of sodium and potassium channel blockers. Med Chem 2009;5:570–6
- Singh S, Supuran CT. Chemometric QSAR modeling and in silico design of carbonic anhydrase inhibition of a coral secretory isoform by sulfonamide. Bioorg Med Chem 2013;21:495–1502
- Singh, S. A QSAR study on novel series of carbonic anhydrase inhibitors hCA IX tumor-associated (hypoxia). Med Chem 2012;8:656–72
- Singh S, Supuran C T. QSARs on human carbonic anhydrase VA and VB inhibitors of some new not yet synthesized, substituted aromatic/heterocyclic sulphonamides as anti-obesity agent. J Enzyme Inhib Med Chem 2012;27:666–72
- Singh S. A comparative molecular field (CoMFA) studies on carbonic anhydrase inhibitor hCA IX-tumor-associated (hypoxia). Lett Drug Des Discov 2011;8:877–83
- Singh S, Singh S, Shukla, P. Modeling of novel HIV-1 protease inhibitors incorporating N-Aryl-oxazolidinone-5-carboxamides as P2 ligands using quantum chemical and topological finger print descriptors. Med Chem Res 2011;20:1556–65
- Singh S, Khadikar PV, Scozzafava A, Supuran, CT. QSAR studies for the inhibition of the transmembrane carbonic anhydrase isozyme XIV with sulfonamides using PRECLAV software. J Enzyme Inhib Med Chem 2009;24:337–49
- Everitt B, Landau S, Leese M. Cluster analysis. London: Arnold Press; 2001
- BROOD (version 2.0.0), OpenEye Science Software, 3600 Cerrillos Road, Suite1107, Santa Fe, USA; 2010
- Geladi P. Notes on the history and nature of partial least squares (PLS) modeling. J Chemon 1988;2:231–46
- Cramer RD III, Bunce JD, Patterson DE. Crossvalidation, bootstrapping, and partial least squares compared with multiple regression in conventional QSAR. Quant Struct Act Relat 1988;7:18–25