
Abstract
Human carbonic anhydrase (CA) I and II are cytosolic proteins, where their expression disorders can cause diseases such as glaucoma, edema, epilepsy or cancer. There are numerous inhibitors that target these isozymes, but it is difficult to design compounds that could bind to one of these proteins specifically. The binding of sulfonamide inhibitor to a CA is linked to several protonation reactions, namely, deprotonation of the sulfonamide group, protonation of the active site zinc hydroxide and the compensating protonation–deprotonation of buffer. By performing binding experiments at various pHs and buffers, all those contributions were dissected and the “intrinsic” binding parameters were calculated. Intrinsic thermodynamic binding parameters to CA I and II were determined for such widely studied drugs as acetazolamide, ethoxzolamide, methazolamide, trifluoromethanesulfonamide and dichlorophenamide. The assignment of all contributions should enhance our understanding of the underlying energetics and increase our capability to design more potent and specific CA inhibitors.
Introduction
Carbonic anhydrases (CAs) are metalloenzymes that catalyze carbon dioxide and water conversion to bicarbonate ion and proton. This reaction occurs slowly at physiological pH [kCO2 = 0.037 (±0.002) s−1], but CAs make it faster about 106 timesCitation1. Carbon dioxide is an essential metabolite in all living systems, therefore, five different CA classes have been identified in different kingdoms of living organisms: α-, β-, γ-, δ- and ζ-CACitation2. They have little chain or structure similarities, but perform the same functionCitation3. α-CA is the most investigated of all five classes, because it is most spread and is the only class that is found in human. There are 15 different CA isoforms in human body, only 12 of them are catalytically activeCitation4–6.
CA I and II are cytosolic CA isoforms, as are CA III, VII and XIII. Three-dimensional structural analysis shows a high degree of structural similarity between CA I and II isoformsCitation7. High concentrations of CA I and II isozymes are found in erythrocytes. CA I is the most abundant non-hemoglobin protein in red blood cells and it is important for bone ossification process. However, its overexpression can cause retina and brain edema. CA II is the most spread isoform that has the highest catalytic activity. It is found in almost all organs and tissues but disorder of expression can be a reason of edema, epilepsy, glaucoma or several tumors, such as esophagus, kidney, pulmonary and othersCitation8. Therefore, these CA isoforms are important targets for pharmaceutical research.
Numerous compounds have been designed as CA inhibitors. Best known are ligands that have primary sulfonamide group. About 30 of them are used as drugs. However, the main problem is to find an inhibitor that would be selective for one isoform. Design of such inhibitors requires detailed investigation of the structure–activity relationships (SARs) of the new compound. Most inhibitors are only characterized by determining their binding or inhibition constants. We think that it is important to determine the full thermodynamic profile, including the enthalpies and entropies of binding and estimate intrinsic parameters of protein–ligand binding. This would let us more deeply understand the SAR and allow the design of isoform-specific inhibitorsCitation4,Citation9. Sulfonamide inhibitors bind CAs as anions, whereas they exist in solution at pH 7.0 as electrostatically neutral moleculesCitation10,Citation11, thus exhibiting linked protonation events upon binding that should be subtracted.
Determination of intrinsic thermodynamic parameters of binding requires predetermination of Zn-bound hydroxy ion protonation parameters by performing numerous experiments by isothermal titration calorimetry (ITC) at various pHs in at least two different buffers. However, it is enough to perform this analysis only once for each CA isoform by using one model inhibitor. Intrinsic parameters of binding of other inhibitors can then be calculated by subtracting protonation contributionsCitation12,Citation13.
Here, we determine the intrinsic parameters of well-known inhibitors, ethoxzolamide (EZA), trifluoromethanesulfonamide (TFS), acetazolamide (AZM), dichlorophenamide (DCP) and methazolamide (MZM) binding to CA I and CA II isoforms. Experiments were performed by ITC and fluorescent thermal shift assay (FTSA) methods.
ITC is the method that can determine the binding constant and binding enthalpy in a single experiment. However, there is a limit of binding constants that can be determined by ITC (about 108 M−1 depending on protein concentration). As some inhibitors bound strongerCitation6, the binding constants of all inhibitors were also confirmed by FTSA (also called differential scanning fluorimetry and, in high-throughput format, ThermoFluor®). This method measures the increase in protein melting temperature in the presence of the inhibitorCitation14–18. FTSA is a rapid screening method, that requires small amounts of proteins and can be applied to nearly all soluble protein–ligand systemsCitation16,Citation17,Citation19–22. A good agreement between the ITC and ThermoFluor® data confirmed the accuracy of binding constant determination by ITC.
Materials and methods
Proteins
CA isozymes I and II were purified as described in previous studiesCitation27,Citation28. For comparison, we used CA isozyme I (from human erythrocytes, cat. # C4396) and II (from human erythrocytes, cat. # C6165) purchased from Sigma Chemical Company, St. Louis, MO. Concentration was determined by dry weight and spectrophotometrically (discrepancy between the methods did not exceed 15%). The observed thermodynamic parameters of inhibitor binding to CA I and II purchased from Sigma and the CAs purified from Escherichia coli cells in our laboratory were identical within the error margin of the experiment.
Inhibitors
EZA was purchased from Aldrich, TFS was purchased from Alfa Aesar and Lancaster Synthesis, AZM, DCP and MZM were purchased from Sigma Chemical Co, St. Louis, MO. All inhibitors were used without further purification. Inhibitors, purchased from different suppliers, bound to the same enzymes with identical affinity.
Isothermal titration calorimetry
ITC experiments were performed by using VP-ITC and ITC200 instruments (Microcal, Inc., GE-Healthcare, Northampton, MA). Measurements of protein–ligand binding reactions were performed using 4–20 µM protein solution in the cell and 40–200 µM ligand solution in the syringe. A typical experiment consisted of 25 injections, 10 µL each. Intervals between injections were 2 or 3 min. Experiments were performed at 25°C in 50 mM sodium phosphate and Tris-chloride buffers, containing 100 mM NaCl and 2% DMSO, concentration equal in the syringe and the cell. For the determination of ligand binding at various pHs, the solution pH was carefully checked in the syringe and cell solution before and after the experiment. ITC data were integrated, fit and analyzed as described previouslyCitation29.
Fluorescent thermal shift assay
FTSA experiments were performed with Corbett Rotor-Gene 6000 (QIAGEN Rotor-Gene Q, Hilden, Germany) instrument using the blue channel (excitation 365 ± 20, detection 460 ± 15 nm), applying the heating rate of 1 °C/min. The samples contained 20 µL of 10 µM protein, 0–400 µM ligand, 50 µM 8-anilino-1-naphthalene sulfonate (ANS), 50 mM sodium phosphate at pH 7.0, 50 mM NaCl and 2% DMSO. The pH dependence of the observed binding constant (Kb) was determined in the buffer containing 50 mM sodium phosphate, 50 mM sodium acetate and 25 mM sodium borate. The fluorescence and ligand dosing curves were fit as described previouslyCitation17,Citation27.
Results
Protonation reactions occurring upon binding
At least three protonation–deprotonation reactions (R2, R3 and R4) accompany the reaction of sulfonamide anion binding to CA (R1). First, the hydroxide ion that bound to zinc atom at the active site, must be protonated (R2). Second, amino group of the sulfonamide must become negatively charged – deprotonated (R3). Third, there will be a compensating protonation or deprotonation of the buffer (R4). Such reactions may be summarized as follows (R – inhibitor chemical groups other than sulfonamide):
(R1)
(R2)
(R3)
(R4)
(R5)
Observed thermodynamic parameters represent the sum of all linked events (R5), whereas (R1) is the intrinsic binding reaction, free of protonation–deprotonation contributions representing a displacement of water molecule by a deprotonated inhibitor molecule.
Observed thermodynamics of inhibitor binding to CA
Chemical structures of sulfonamide inhibitors used in this study are shown in . These inhibitors exhibited the observed binding affinities spanning the range from 106 to 108 M−1 (). shows several typical FTSA data for inhibitor binding to CA. shows the CA II melting curves in the presence of EZA, whereas – in the presence of TFS. shows the dosing curves obtained from the data in panels A and B. Same concentration of EZA shifted the melting temperature of CA II more than TFS. Therefore, EZA is a stronger binder than TFS at pH 7.0. However, these are only the observed binding parameters.
Figure 1. Chemical structures and abbreviations of the CA inhibitors used in this study. Every inhibitor bears a sulfonamide group that binds to the zinc atom of the CA active site.
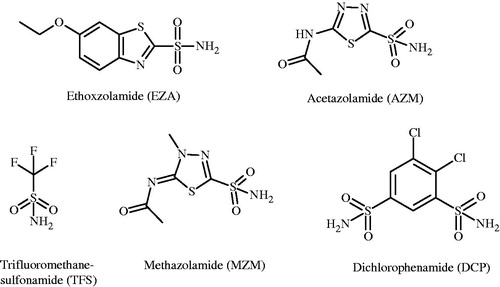
Figure 2. EZA and TFS binding to CA II observed by the FTSA at pH 7.0. (A) and (B) show the protein melting fluorescence curves at several added concentrations of EZA and TFS, respectively. (C) Shows the dependence of the protein melting temperatures Tm on the added compound concentrations. Datapoints are the experimental values obtained from the upper graphs and the solid lines are simulated according to the model as described in the methods.
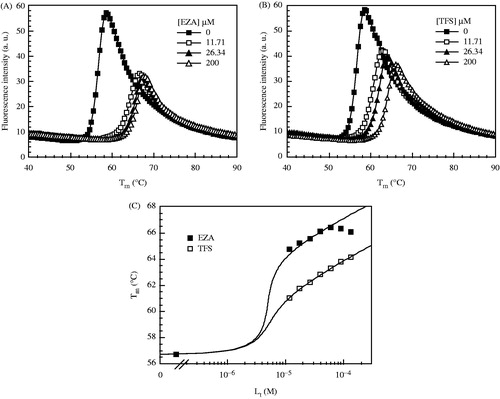
Table 1. The observed thermodynamic parameters of EZA, TFS and AZM binding to CA I and II in phosphate and Tris buffers at various pH, 25°C, determined by ITC.
Binding is highly dependent on buffer and pH. ITC experiments were carried out in buffers of different protonation enthalpy to determine the protonation reactions linked to the binding reaction. ITC curves in illustrate the binding dependence on buffer and its pH. If a net change in protonation occurs upon ligand binding, a corresponding change in buffer protonation should add to the observed enthalpy. We have performed the binding experiments in the sodium phosphate and Tris-chloride buffers at 25 °C. Deprotonation enthalpies of these buffers at this temperature are 5.10 kJ/mol and 47.5 kJ/mol, respectively.
Figure 3. ITC data shows EZA binding to CA II dependence on buffer solution and pH value at the same temperature (25 °C). Integrated curves show observed data in Tris-chloride buffer at pH 7.0 (filled triangle) and pH 9.0 (filled square) and sodium phosphate buffer at pH 7.0 (open circle). The inset shows raw ITC curve in Tris-chloride buffer, pH 7.0, 25 °C.
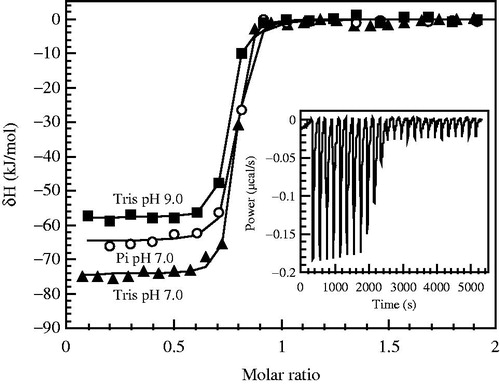
The observed binding constants (observed Gibbs free energies), enthalpies and entropies are listed in and in . Both the observed binding constants and the observed enthalpies are dependent on pH and buffer. For example, EZA binding to CA I in phosphate buffer was about 10-fold weaker at pH 9.0 than at pH 7.0, but the enthalpy was much more exothermic at pH 9.0 (−75.60 kJ/mol) than at pH 7.0 (−29.07 kJ/mol). In Tris buffer, however, the enthalpy was more exothermic at pH 7.0 (−63.39 kJ/mol) than at pH 9.0 (−46.44 kJ/mol). The trend for CA II was generally similar but had significant differences discussed below.
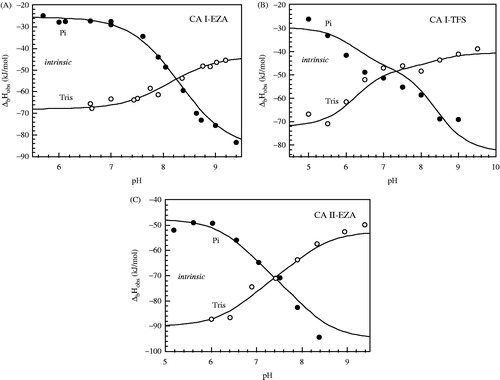
Figure 4. The observed enthalpies of binding are shown as a function of buffer pH. Panel A: CA I-EZA, Panel B: CA I-TFS and Panel C: CA II-EZA. Filled circles show the observed binding enthalpies in sodium phosphate buffer, open circles show binding enthalpies observed in Tris-chloride buffer. Experiments were performed by ITC at 25°C. Dotted line represents the intrinsic binding enthalpy. Curves are fit according to Equation (5).
Furthermore, binding of a given sulfonamide ligand to CA will be strongest at the pH when the ligand is deprotonated and the hydroxide ion bound to zinc is protonated. Therefore, optimal binding is in the pH region between the respective pKas when pKa-sulfonamide < pKa-Zn-water. When pH is below the pKa-sulfonamide or above the pKa-Zn-water, then the binding is weaker. The observed binding constant Kb-obs is equal to the intrinsic binding constant Kb multiplied by the available fractions of deprotonated inhibitor and protonated zinc hydroxy anion:
(1)
The Gibbs free energy in turn is:
(2)
Fraction of deprotonated sulfonamide can be calculated when the protonation pKa is known:
(3)
Similarly, the fraction of enzyme molecules with protonated water molecules bound to the active site Zn atom can be calculated if respective protonation pKa is known:
(4)
shows the pH dependence of the observed binding constants obtained by using FTSA and ITC methods. Both methods yielded similar pH dependence as seen for TFS binding to CA I. However, due to high EZA affinity to CA II at pH range from 7.5 to 8.5, it was difficult to observe the binding constants by ITC because the Wiseman (c = Kb × C, where C is protein molar concentration) factor falls out of the useful range of 5–500.
Figure 5. The observed Gibbs free energy (ΔbGobs) of EZA (Panel A) and TFS (Panel B) binding to CA I, and EZA binding to CA II (Panel C) at various pH. TFS binding to CA I was determined by ITC in Tris-chloride (open triangle, Panel B) and sodium phosphate (open diamond) buffers and by FTSA (filled square). EZA binding to CA I and CA II was performed by FTSA (Panels A and C). Solid line shows the fit according to Equation (2) using parameters listed in tables. Dashed and dotted lines show the contributions of deprotonated ligand and protonated CA, respectively. Straight line shows the intrinsic Gibbs free energy of binding.
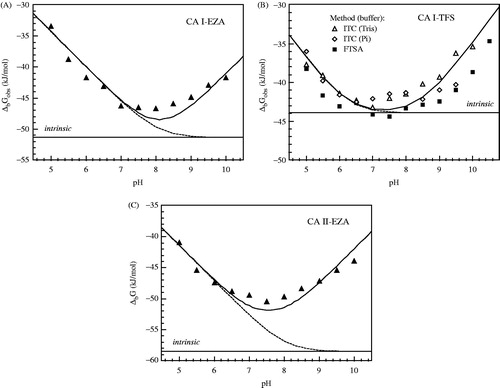
The binding constant does not depend on the chemical nature of the buffer provided that the buffer does not bind the ligand or the protein. There was essentially no difference between the binding Gibbs free energies obtained in phosphate and Tris buffers.
The intrinsic enthalpy of binding has contributions from the observed binding enthalpy (ΔbHobs), enthalpies of inhibitor (Δb_proton_inhH), CA (Δb_proton_CAH) and the buffer protonation (Δb_proton_bufH):
(5)
where:
(6)
Energetics of inhibitor protonation
Equation (R3) represents the deprotonation of the sulfonamide group. Only the deprotonated sulfonamide form is thought to bind to the CACitation23. The ionization form of inhibitor depends on the pKa and pH of the solution. Most sulfonamide inhibitors are protonated at physiological pH and must undergo a linked deprotonation reaction upon binding to the protein.
The inhibitor protonation enthalpy is observed by titrating alkaline solution of the inhibitor (1.5 equivalent of base was added) with acid (). The enthalpy of the second transition is equal to the enthalpy of inhibitor protonation. The first transition is due to neutralization of 0.5 equivalent of NaOH.
Figure 6. Panel A – representative raw ITC data of alkaline inhibitor (MZM) protonation with HCl at 25°C. About 1.5 equivalents of NaOH were added to the neutral inhibitor solution. Concentrations and volumes used for ITC experiments were identical to pH titration experiments shown in Panel C. First portion of the titration curve represents the reaction between H+ and excess OH−. The second portion of the titration curve having the stoichiometry of 1.0 represents the inhibitor protonation. Solid line is the baseline. Panel B – integrated ITC curves of TFS (open diamond) at 13 °C and MZM (filled diamond) at 37 °C titration with HCl. The enthalpy of the first portion of the titration (stoichiometry ∼0.5, ΔH ∼ −54 kJ/mol) is a value close to the expected value for the reaction of H+ + OH− = H2O. The enthalpy of the second portion of the titration curve (stoichiometry ∼1.0) represents the enthalpy of sulfonamide protonation. Panel C – the pH titration curves for MZM (filled diamond) and TFS (open diamond), determined potentiometrically at 24 °C. Concentrations and volumes were identical to ITC experiments (panels A and B). Two transitions are seen: 0.5 equivalent of H+ reaction with OH−, and one equivalent of sulfonamide protonation. The pKa is approximately equal to the pH at the midpoint of the second stage of the titration. Datapoints are experimental pH values and the line is fit according to another studyCitation24. Panel D – the temperature dependence of inhibitor sulfonamide group protonation (reaction R3 in reverse) enthalpy as determined by ITC. Datapoints are experimentally determined integral enthalpies for, TFS (open square), AZM (filled circle), MZM (inverted open triangle), and DCP (filled diamond). Lines are linear fits of the experimental data. Slopes of the lines are positive and equal to the heat capacities of about 190–290 J × mol−1 K−1.
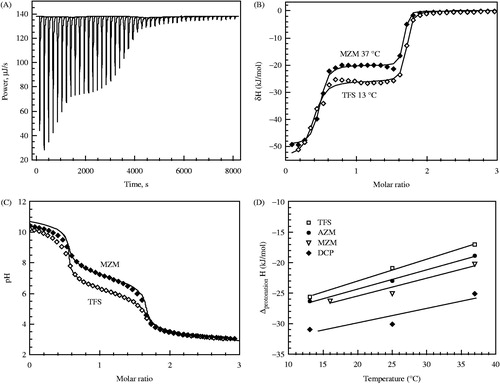
The same solutions and volumes as in the calorimetric experiments were used for potentiometric titration by using a pH-meter. A function describing two transitions was derived according to another studyCitation24 and curves were simulated to match the experimental datapoints. Two representative titration curves are shown in . The midpoint of the second transition matches the pKa of the inhibitor.
The heat capacities of sulfonamide protonation were also determined by carrying out the ITC titration at different temperatures (. The slope of the enthalpy dependence on temperature is equal to the heat capacity of inhibitor protonation.
TFS has a pKa of 6.25; therefore, at pH 7.0, almost all of the inhibitor exists in a negatively charged form (fraction = 0.91) and the affinity to CA is strong. The pKa values of other measured inhibitors were > 7. The enthalpies of inhibitor protonation (25 °C) were quite similar (−22.4 to −29.5 kJ/mol). Entropies of protonation were from 13.3 to 18.7 kJ/(mol × K).
The thermodynamic parameters of EZA and TFS protonation have been previously describedCitation12. Parameters for AZM, MZM have been described in other studiesCitation23,Citation25, DCP alsoCitation25 and are consistent with these results.
Energetics of zinc hydroxy anion protonation
The hydroxy anion bound to the active site Zn must be protonated (electrostatically neutral) in order for the sulfonamide inhibitor binding reaction to occur. Equation (R2) shows this reaction. lists the thermodynamic parameters of protonation of the hydroxide bound to Zn atom. The pKa of CA II was found to be 7.1. However, the pKa of CA I was significantly higher, = 8.4. Therefore, the Gibbs free energies of reaction (R2) for CA I and II differed by about 5 kJ/mol.
Table 2. Thermodynamic parameters of inhibitor sulfonamide groups and also CA I and CA II Zn-bound hydroxide anion protonation at 25°C.
The enthalpies of (R2) for CA I and II were −41 kJ/mol and −26 kJ/mol, respectively. Thus, the enthalpy was slightly more exothermic for CA I than for CA II. The entropies were also contributing favorably to the protonation reaction. Comparison of observed parameters shows that the entropy contribution to the CA I protonation was greater than to CA II.
Comparing the thermodynamics of (R2) for CA I and II with other CAs (), it is clear that the pKa of CA I is similar to the pKa of CA XIII, whereas that of CA II to CA VII and XII. However, there is no clear pKa correlation with the enthalpy and entropy of hydroxy anion protonation. The enthalpies varied from −26 to −41 kJ/mol, whereas the entropies varied from 5.3 to 21.1 kJ/mol. The process of protonation is primarily enthalpy-driven but also has smaller favorable entropy contribution.
Intrinsic thermodynamics of binding parameters
lists the intrinsic thermodynamic parameters of inhibitor binding to CA I and II. These parameters are independent of pH, buffer and linked protonation events. Intrinsic binding constants of CA II are greater than the observed Kb values by about one order of magnitude except for EZA. However, the difference of intrinsic and observed binding constants for CA I is generally smaller than for CA II. Inhibitors bound tighter to CA II than to CA I by about an order of magnitude. This difference may be due to the different recognition of the surface of the binding pocket. The difference is not due to the linked protonation events and thus may be correlated to structure. In terms of Gibbs free energy, it is clear that TFS, MZM and DCP bind to CA I with nearly identical intrinsic affinity of −42.9 to −43.9 kJ/mol. The value for AZM is also quite similar (−37.8 kJ/mol), but EZA bound significantly tighter (−51.4 kJ/mol). Similar tendency is also observed for CA II. All these values differed significantly from the observed Gibbs free energies.
Table 3. Intrinsic thermodynamic parameters of deprotonated inhibitor binding to CA I and CA II containing the protonated Zn-bound water molecule at 25° C.
Inhibitor binding was enthalpy driven and had relatively negligible entropic contribution to binding except intrinsic thermodynamic parameters of DCP binding to CA II.
Discussion
Structure–activity relationships in drug design are usually limited to the analysis of enzyme inhibition constants or inhibitor binding constants. However, other thermodynamic parameters describing protein–inhibitor interaction, such as enthalpy, entropy, heat capacity and volume add significant information for inhibitor improvement and may lead to the design of drugs with better properties of target bindingCitation9,Citation26.
Thermodynamic parameters of ligand–protein binding are often thought to be determinable by a single titration calorimetry experiment. Unfortunately, most such determinations cannot be understood in terms of structural features of protein–ligand interface. Instead, a detailed study is needed to be able to correlate binding parameters with structure. First, it is necessary to perform experiments in various buffers to show that there are no linked protonation–deprotonation reactions. Only if there are no linked reactions one can relate such parameters to structure. In reality, even the simplest reactions of one inhibitor molecule binding to a specific site on a protein is usually linked to a series of complicated protonation–deprotonation and other reactions such as conformational changes or other ion binding.
CA–sulfonamide inhibitor binding is linked to at least three protonation reactions. Their impact on observed thermodynamic parameters is very significant. Without the dissection of the linked reactions, the structural reason for the observed parameters cannot be understood. The enthalpy of hydroxide or amino group protonation (−40 to −50 kJ/mol) is comparable with the enthalpy of binding.
The contributing linked reactions of MZM binding to CA I were determined earlierCitation23. Their obtained enthalpy of MZM binding to CA I (−56.5 kJ/mol) is close to our intrinsic enthalpy (−56.9 kJ/mol) (). The pKa of zinc hydroxide protonation was assumed to be the same as that of the CA I containing cobalt atom in the active site. The presence of cobalt enabled pKa determination by spectral methods. The Co hydroxide protonation pKa was equal to 7.41 ± 0.04. Our determined zinc hydroxide pKa in CA I was = 8.4. Therefore, an assumption that Co and Zn enzymes will have the same pKa is not correct. Furthermore, our results show that CA I and CA II zinc hydroxide pKas differ significantly (it is = 7.1 for CA II).
Interestingly, DCP-bound CA I with the negative entropy (TΔbSintr = −11.7 kJ/mol) while CA II with the positive entropy (16.2 kJ/mol). Furthermore, DCP bound stronger to CA II than to CA I, but the enthalpy was more exothermic for the binding to CA I. There is no clear reason for such behavior, but there is enthalpy–entropy compensation effect.
Thermodynamic dissection of contributing linked reactions should improve the design of CA inhibitors. The major contributor to the binding weakness of some of the studied inhibitors is a large pKa of inhibitor deprotonation. It should be advantageous to design inhibitors with pKas < 8. This may be achieved by introducing electron withdrawing groups on the inhibitor molecule.
Specificity and selectivity of the studied inhibitors is limited. There is about 10 × preference to bind CA II over CA I. Apparently, large differences in chemical structures of ligands such as TFS and MZM actually lead to very small differences in intrinsic binding constants. Instead, most of the difference lies in the deprotonation of sulfonamide group necessary for the binding to occur. In order to be more specific, inhibitors need to bear larger structural differences.
Conclusions
Dissection of all contributing reactions to the observed thermodynamics of inhibitor binding to a protein is necessary in order to correlate the thermodynamic parameters with the structure of the protein–ligand complex. Sulfonamide inhibitors bound stronger to CA II isozyme than to CA I. An especially large difference of about two orders of magnitude was observed for AZM. The smallest difference among the two isozymes was observed for TFS binding. The major difference in affinities of the inhibitors lay within the differences of sulfonamide group pKas. For all ligands, the binding was enthalpy driven.
Declaration of interest
The authors report no conflict of interest. This research was funded by the European Social Fund under the Global Grant measure (no. VP1-3.1.-SMM-07-K-02-009). Authors thank FP7-REGPOT-2009-1 grant ‘MoBiLi’ agreement No.: 245721 and the COST projects TD0905 and CM0804.
Related Research Data
References
- Khalifah RG. The carbon dioxide hydration activity of carbonic anhydrase. i. stop-flow kinetic studies on the native human isoenzymes b and c. J Biol Chem 1976;246:2561–73
- Xu Y, Feng L, Jeffrey PD, et al. Structure and metal exchange in the cadmium carbonic anhydrase of marine diatoms. Nature 2008;452:56–61
- Supuran CT. Carbonic anhydrase inhibitors. Bioorg Med Chem Lett 2010;20:3467–74
- Krishnamurthy VM, Kaufman GK, Urbach AR, et al. Carbonic anhydrase as a model for biophysical and physical-organic studies of proteins and protein-ligand binding. Chem Rev 2008;108:946–1051
- Sly WS, Hu PY. Human carbonic anhydrases and carbonic anhydrase deficiencies. Annu Rev Biochem 1995;64:375–401
- Supuran CT. Carbonic anhydrases: novel therapeutic applications for inhibitors and activators. Nat Rev Drug Discov 2008;7:168–81
- Hassan I, Shajee B, Waheed A, et al. Structure, function and applications of carbonic anhydrase isozymes. Bioorg Med Chem 2013;21:1570–82
- Alterio V, Di Fiore A, D'Ambrosio K, et al. Multiple binding modes of inhibitors to carbonic anhydrases: how to design specific drugs targeting 15 different isoforms? Chem Rev 2012;112:4421–68
- Ladbury JE, Klebe G, Freire E. Adding calorimetric data to decision making in lead discovery: a hot tip. Nat Rev Drug Discov 2010;9:23–7
- King RW, Burgen AS. Kinetic aspects of structure-activity relations: the binding of sulphonamides by carbonic anhydrase. Proc R Soc Lond B Biol Sci 1976;193:107–25
- Kumar K, King RW, Carey PR. Carbonic anhydrase-aromatic sulfonamide complexes, a resonance raman study. FEBS Lett 1974;48:283–87
- Baranauskiene L, Matulis D. Intrinsic thermodynamics of ethoxzolamide inhibitor binding to human carbonic anhydrase XIII. BMC Biophys 2012;5:12
- Jogaite V, Zubriene A, Michailoviene V, et al. Characterization of human carbonic anhydrase XII stability and inhibitor binding. Bioorg Med Chem 2013;21:1431–6
- Pantoliano MW, Petrella EC, Kwasnoski JD, et al. High-density miniaturized thermal shift assays as a general strategy for drug discovery. J Biomol Screen 2001;6:429–40
- Todd MJ, Salemme FR. Direct binding assays for pharma screening. Genetic Eng News 2003;23:28–9
- Kranz JK, Schalk-Hihi C. Protein thermal shifts to identify low molecular weight fragments. Methods Enzymol 2011;493:277–98
- Cimmperman P, Matulis D. Protein thermal denaturation measurements via a fluorescent dye. Cambridge, UK: RSC Publishing; 2011, Ch. 8, pp. 247–74
- Niesen FH, Berglund H, Vedadi M. The use of differential scanning fluorimetry to detect ligand interactions that promote protein stability. Nat Protoc 2007;2:2212–21
- Zubriene A, Matuliene J, Baranauskiene L, et al. Measurement of nanomolar dissociation constants by titration calorimetry and thermal shift assay – radicicol binding to Hsp90 and ethoxzolamide binding to CA II. Int J Mol Sci 2009;10:2662–80
- Matulis D, Kranz JK, Salemme FR, Todd MJ. Thermodynamic stability of carbonic anhydrase: measurements of binding affinity and stoichiometry using thermofluor. Biochemistry 2005;44:5258–66
- Mezzasalma TM, Kranz JK, Chan W, et al. Enhancing recombinant protein quality and yield by protein stability profiling. J Biomol Screen 2007;12:418–28
- Zubriene A, Kazlauskas E, Baranauskiene L, et al. Isothermal titration calorimetry and thermal shift assay in drug design. Eur Pharmaceut Rev 2011;16:56–9
- Khalifah RG, Zhang F, Parr JS, Rowe E. Thermodynamics of binding of the CO2-competitive inhibitor imidazole and related compounds to human carbonic anhydrase I: an isothermal titration calorimetry approach to studying weak binding by displacement with strong inhibitors. Biochemistry 1993;32:3058–66
- Butler JN, Cogley DR. Ionic equilibrium. Solubility and pH calculations. New-York: John Wiley and Sons Inc.; 1998
- Matulis D, Todd MJ. Thermodynamics-structure correlations of sulfonamide inhibitor binding to carbonic anhydrase. Chichester, England: John Wiley & Sons; 2004, Ch. 6, pp. 107–32
- Ladbury JE. Calorimetry as a tool for understanding biomolecular interactions and an aid to drug design. Biochem Soc Trans 2010;38:888–93
- Baranauskiene L, Hilvo M, Matuliene J, et al. Inhibition and binding studies of carbonic anhydrase isozymes I, II, and IX with benzimidazo[1,2-c][1,2,3]thiadiazole-7-sulphonamides. J Enzyme Inhib Med Chem 2010;25:863–70
- Cimmperman P, Baranauskiene L, Jachimoviciute S, et al. A quantitative model of thermal stabilization and destabilization of proteins by ligands. Biophys J 2008;95:3222–31
- Kazlauskas E, Petrikaite V, Michailoviene V, et al. Thermodynamics of aryl-dihydroxyphenyl-thiadiazole binding to human Hsp90. PLoS One 2012;7:e36899
- Pilipuityte V, Matulis D. Intrinsic thermodynamics of trifluoromethanesulfonamide and ethoxzolamide binding to human carbonic anhydrase VII. Submitted