
Abstract
An HPLC-size exclusion method was developed as an assay method to evaluate the binding of tested compounds with carbonic anhydrase III (CAIII) enzyme. Inhibition of CAIII by a group of benzoic acid analogues was characterized by vacancy (negative) peak intensity representing the fraction of the compounds bound with CAIII enzyme. Interestingly, p-hydroxyl benzoic acid and aspirin were found potent inhibitors against CAIII with affinity constants of 9954 and 9013 M−1 respectively. Affinity values of twenty training compounds were modeled against thirty-five descriptors derived from their structures. Strong correlation was obtained between the affinity values and the formal charge of the molecules. Docking studies on training set compounds generated consensus scores having a strong agreement with affinity factors obtained from the chromatographic analysis.
Introduction
Carbonic anhydrases (CA) catalyze the inter-conversion between carbon dioxide and bicarbonate across the body organsCitation1–3. They contain zinc atom in their prosthetic groupsCitation1. Three classes of CA were isolated from animal and plant kingdoms namely; α, β and γCitation4. More than fourteen of α-CA isoenzymes were isolated from higher vertebrates, seven of them were found in humanCitation1,Citation4–6. Isoenzymes such as I, II, III and VII are cytoplasmic, others like IV, IX, XII and XIV are bound to the cell membrane, whereas V was found in mitochondria and VI in salivaCitation1. In addition to their activity in carbon dioxide hydration, they can hydrate cyanate to carbamate and cyanamide to ureaCitation1. Inhibition of CAs is a target in treatment of many diseases including, hypertension, glaucoma, epilepsy and edemaCitation7–9.
CAIII governs a quarter of the total protein content in human adipocytes and lacks a distinctive known functionCitation10–12. Although CAIII structure resembles the most active isoform (CAII; 1). It has a low carbon dioxide hydratase activity, equals 0.3% of the CAII activityCitation1. Instead of one of histidine groups around the zinc atom of CAII, there is a lysine moiety in CAIII which reduces its aptitude in proton shuttling and consequently the activity in carbon dioxide hydrationCitation1. Also its cone-shape active site is partially blocked by phenylalanine residue which makes it insensitive to sulfonamides such as acetazolamideCitation1. However, small phenols were found moderately potent inhibitors against isoenzymes I, II, IV, IX, XII and XIV and particularly against CAIIICitation13–16.
Our research group had previously found that vanillic acid has strong inhibition potency against CAIIICitation17. The binding assessment was conducted by measuring the intensity of negative peaks generated from vacancy chromatography using size exclusion separation. This method has advantage over currently available colorimetric methods in its stability against false results generated from pH fluctuation due to intrinsic acidity or basicity of analyte compoundsCitation17–19. Additionally, colorimetric methods are not considered sensitive in evaluating the CAIII inhibition due to the limited catalytic activity of this isoform in carbon dioxide hydrationCitation1.
Affinity values of binding for a set of benzoic acid analogues against CAIII, obtained from chromatographic analysis, were modeled against a set of structure descriptors by multiple regression analysis to generate quantitative structural activity relationship (QSAR). Subsequently, a docking study was conducted to optimize the results of QSAR model.
Experimental
Instrumentation
Thermo scientific HPLC system (Tewksbury, MA) equipped with Spectra system UV1000 detector, Spectra system P1000 pump, and SN 4000 controller. Chromatographic data were acquired and processed by ChromQuest 3.1.6 software. BioSep-SEC Phenomenex column of s2000, 300 × 7.8 mm (MA) was used for size exclusion separation. The mobile phase flow was maintained at 1 ml/min during the run time. Wavelengths used for analyte groups were maximum lambda of each analyte.
Chemicals
Carbonic anhydrase III, from Biovar Ltd (Yerevan, Armenia), was stored and handled according to the producer instructions. 4-Hydroxybenzaldehyde was purchased from Riedel-deHaen (Seelze, Germany) whereas 3-aminophenol was purchased from Merck-schuchardt (Darmstadt, Germany). Gallic acid, caffeic acid and ferulic acid were purchased from Molekula (Dorset, UK) and also salicylic acid was purchased from Daejung (Gyeonggi-do, Korea). Other chemicals, used in testing and training sets, were purchased from Sigma-Aldrich (St. Louis, MO) including: phenol, benzoic acid, catechol, 5-hydroxy-1,4-naphthoquinone, 4-aminobenzoic acid, 4-nitrophenol, 4-hydroxybenzoate, N-(4-hydroxyphenyl) acetamide, 4-aminophenol, 4-chlorocresol, 5-hydroxyanthranilic acid, aspirin, 3,4-dihydroxybenzaldehyde, 4-aminosalicylic acid, vanillic acid and 1,3,5-trihydroxybenzene. HPLC grade methanol and acetonitrile, from Fisher scientific (Loughborough, UK), were used without further purification. Sodium dihydrogen phosphate monohydrate from Gainland (Flintshire, UK), Hydrochloric acid from Carlo Erba (Milano, Italy), sodium hydroxide from Lonver (England), and deionized water were used in mobile phase preparation. 4-Hydroxy-3-methoxy-5-sulfamoylbenzoic acid was synthesized and fully characterized by the research group using vanillic acid as a starting material.
Mobile phase and sample preparation
Each compound from training and testing sets was dissolved in a mixture of acetonitrile: phosphate buffer, pH 6.0 (1:9 v/v) to obtain concentrations of 0.24, 0.20 and 0.18 mM. Subsequently, mobile phases were filtered and degassed by a sonic bath prior the use. An excess concentration of CAIII in water (6.3 mM) was injected in each run.
QSAR model
Training set which embraces twenty molecules was treated by using specialized protocol in Discovery Studio 3.5 software (CA) to extract the values of molecular properties. These values were studied in details and the most promising descriptors were used effectively in building up the QSAR model, thirty five descriptors were carefully selected and measured according to their potential against CAIII. SIMCA-P software (version 12.0, CA) was used to refine the descriptors according to their correlation with the Kf values as dependent variables by applying Partial Least Square Regression analysis (PLSR) and also it was employed to accomplish clustering analysis according to the underlined properties of the molecules. The strongest descriptors were then treated by multiple linear regression and ANOVA through Minitab software (version 16, Coventry, UK). The results of the training set were validated by permutations plot and jack-knifing internal validation using SIMCA-P. Furthermore, external set of compounds were used to launch external validation for the QSAR model.
Docking study
The crystal structure of carbonic anhydrase III (PDB code: 3UYQ)Citation20 which has a very good resolution of 1.7 Å has been downloaded from the Protein Data Bank and was prepared for the following steps using Prepare Protein protocol implemented in Discovery Studio 3.5 software (DS 3.5) from Accelrys® (CA). The preparation steps include standardization of atom names, insertion of missing atoms in residues and removal of alternate conformations, insertion of missing loop regions, calculation of pKa values and protonation of the structure functionalities. Once the protein is prepared it becomes ready for docking steps.
Within the docking procedure of metalloenzymes, it is essential to determine the boundaries of active site around the metallic ion. A virtual sphere of 7 Å was suggested which is enough to accommodate the natural substrate and the suggested inhibitors of both the training and the test sets.
Consensus scoring strategyCitation21,Citation22 has been implemented in this study by employing different docking programs namely; CDOCKER, LibDock, LigandFit and GOLD. Several docking programs were used because each one operates different pose fitting methods of the ligand inside the active site and also each one uses its own energy calculation methodology. Thus, using all these techniques should minimize any bias that could arise from a single docking program.
CDOCKER uses a CHARMm-based molecular dynamics (MD) scheme to dock ligands into a receptor binding site; then random conformation will be produced using high temperature molecular dynamics. Once these conformations are translated to the active site, candidate poses are then created using random rigid-body rotations followed by simulated annealingCitation23. Libdock high-throughput algorithm where the ligand will be aligned in the active site based on polar and apolar interaction sites termed as “Hotspots”. For more accurate docking, a CHARMm minimization step was activatedCitation24. Additionally, LigandFit docks ligands into an active site using a shape filter and Monte-Carlo ligand conformation. The docked poses will be minimized with CHARMm and evaluated with a set of scoring functions such as PLP1, PLP2, Jain, PMF and PMF04Citation25,Citation26. GOLD parameters were set to give maximum flexibility to the active site and the ligands in addition to using four scoring functions namely, Goldscore, Chemscore, ASP and CHEMPLP to reach optimal accuracy for candidate compound selection. GOLD recognizes zinc atom by allowing the coordination geometry number to be 4,5,6 which correlate to tetrahedral, trigonal bipyramidal and octahedral geometries respectivelyCitation27. The consensus scoring step is finally performed by summing up all the values of the twelve scoring functions used in this study (four for GOLD, six for LigandFit, one for Libdock and one for CDOCKER).
Results and discussion
HPLC method of analysis
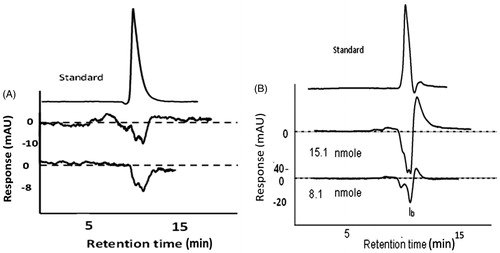
Recently, we have reported vanillic acid as a novel potent inhibitor for CAIIICitation17. It was found more potent than the reported phenolic inhibitorsCitation14–16. Owing to the susceptibility of the reported colorimetric assays of CA to the analytes’ acidity and alkalinity and also the low activity of CAIII in carbon dioxide hydration, a Hummel-dryer chromatographic method was developed and used by our research group previously in evaluating vanillic acid affinity to CAIIICitation17. The method was further optimized in this work to evaluate the affinity of benzoic acid analogues against CAIII since the chromatography provides a relatively enough space for the protein-analyte interaction and consequently low possibility of protein self-aggregation. Additionally the overwhelming effect of mobile phase pH and its ionic strength dominate any possibility of misinterpretation due to the intrinsic properties of analytes. Moreover, chromatographic analysis relied on vacancy peak formation occurred due to the subtraction of the CAIII-bound portion of analyte from the mobile phase. This will be independent on the enzyme catalytic activity and consequently provides a sensitive mean for inhibition activity in comparison with the currently available colorimetric methods. HPLC analysis of CAIII binding with candidate inhibitors generates chromatograms such as those appeared in . When weak inhibitors were injected in the chromatographic system, they created weak vacancy (negative) peaks independent of the CAIII concentration (). In contrary, binding of potent inhibitor with CAIII leads to intense negative peak at the expected retention time of the analyte standard (). The intensity of the peak is proportional with relatively low concentrations of CAIII solutions. Due to the mechanism of size exclusion of the column free and complex forms of CAIII co-elute prior to the ligand peak. CAIII forms retained low absorptivity at lambda maxima of the chromophoric ligands used in training and testing sets here.
Figure 1. Examples of chromatograms generated from the vacancy chromatography for phenol as a weak inhibitor (A) and ferulic acid as a strong one (B). Strong inhibitors were found as CAIII concentration dependent.
pH of the mobile phase was chosen neutral to mimic the physiological value with better chance of in vivo correlation. Additionally, the lowest percentage of organic modifier (10% acetonitrile) was used to elute the analytes from the hydrophobic column. It was also used to avoid adhesiveness of the macromolecules with the column. Temperature was kept constant at ambient temperature because the temperature fluctuation affects the degree of binding.
Affinity bindings of benzoic acid analogues with CAIII
Injection of a group of CAIII solutions with different concentrations in HPLC containing constant concentration of a certain analyte generated vacancy peaks. In case of potent inhibitors, intensities of vacancy peaks were directly proportion to low amounts of CAIII and then steady state was occurred at higher CAIII amounts. The binding ratios with CAIII were found 1:1 for all tested analytes. The binding ratios were deduced from scatchard plot, is an example. Where stands for the average molar ratio of the inhibitor bound to CAIII and [E] represents the concentration of injected enzyme. The inflection points were found at around
is one for the tested analytes.
Figure 2. Scatchard plot indicates the inflection value at equimolar ratio of inhibitor to CAIII. Where stands for the average values of bind ratio and [E] stands for concentration of injected CAIII into the HPLC system.
![Figure 2. Scatchard plot indicates the inflection value at equimolar ratio of inhibitor to CAIII. Where stands for the average values of bind ratio and [E] stands for concentration of injected CAIII into the HPLC system.](/cms/asset/1a09c312-6e3f-4848-b34d-f5a4db7c853a/ienz_a_940939_f0002_b.jpg)
Thus, affinity constant (kf) of the inhibitors were calculated at equimolar ratios. A modified form of an equation introduced by Flood et al was adopted to calculate affinity constants of tested compoundsCitation28.
(1)
Where IB represents the bound amount of inhibitor, E is the amount of enzyme injected whereas [I] is the concentration of inhibitor in mobile phase.
QSAR model
Group of structural descriptors containing thirty-five properties were selected according to their eligibility in binding with metalloenzyme active site. They were in silico calculated for twenty compounds (training set) as shown in . The values, displayed in , were correlated with affinity constants of tested molecules extracted from the chromatographic analysis (actual Kf values, ). The correlation process was carried out by implementing partial least square regression (PLSR) through SIMCA-P software to avoid any possible bias might occur by missed values in data matrices. PLSR is suitable to deal with noisy character of chemical data represented by sinusoidal behavior of results (very-high values appeared simultaneously with very-low values). The PLSR correlation was able to express the majority of variation among the descriptors. This was proved by showing accumulative values of fit goodness (R2) above 0.75 for the first two principal components (eigen vectors) and also the cross validation coefficients (Q2) were above the third quartileCitation29,Citation30. Correlation coefficients were shown in a histogram of . The data, which have absolute mean values of correlation above 0.05 as a threshold, were gathered and introduced into Minitab software to apply multiple linear regression (MLR) and analysis of variance (ANOVA) for the correlation of each independent variable with affinity constants' set. It was found that “formal charge” and “molecular polar surface area” overwhelm the other correlations with affinity constants as appeared in and according to the following QSAR equation
(2)
where “M” stands for “molecular polar surface area” and “F” stands for “formal charge”.
Figure 3. Histogram displayed the correlation coefficient for each structural descriptor with actual values of affinity constants extracted from chromatographic analysis.
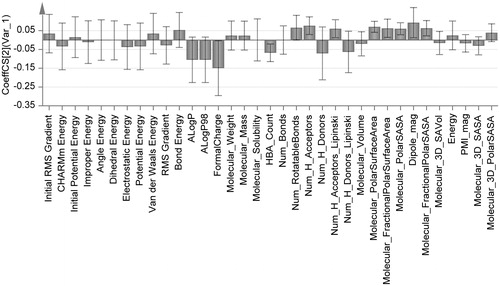
Figure 4. Histogram of correlation coefficients with affinity constants of the most two important descriptors obtained from the finally refined QSAR model. It depicts the importance of formula charge in molecular binding with CAIII enzyme.
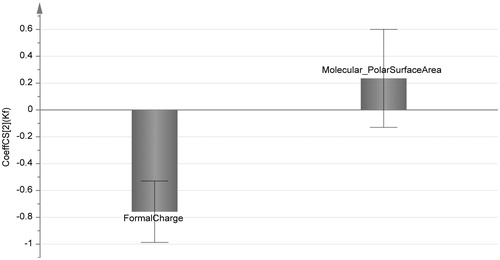
Table 1. Structural descriptors of training set compounds calculated in silico by Discovery Studio 3.5 software. (Abbreviations of molecules’ names are listed in .)
Table 2. Affinity and inhibition constants of tested compounds against CAIII obtained from chromatographic analysis (actual Kf and Ki values). And those which were resulted from the refined form of QSAR model (calculated Kf and Ki values). The values of the most important two descriptors of QSAR model were presented (F and M).
The both descriptors were related to the polarity of molecules and to the distribution of charges on them. It can be deduced from the above how the negative charge of carboxylate group is important in the binding. This drove the attention to the carboxylate ligand formation with zinc atom at CAIII active site. Substitution of carboxylic group with aldehydic, phenolic and acetamido groups lessen the activity (). Moreover, the presence of other substitution on the benzoic acid and its analogues enhances the activity, particularly with hydroxyl groups such as gallic acid and 4-hydroxybenzoic acid.
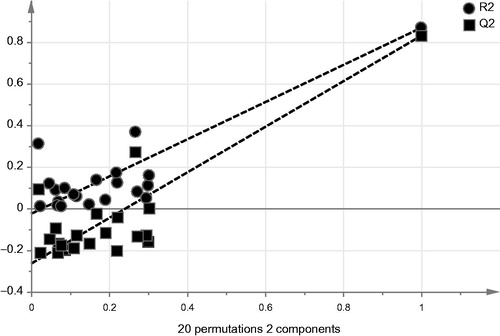
ANOVA of regression, exhibited p values below 0.05, indicated the capability of the model in expressing the variation from the descriptorsCitation31. The validity of the model was tested by internal and external validation strategies. Internal validation was fulfilled by recalculating the values of affinity constants according to the obtained QSAR equation against the actual values by implementing Jack-knifing method which generates accumulative results by leaving-one of descriptor out in each permutationCitation32. Plotting the actual affinity values against the calculated ones produced two distinctive clusters without any overlaps as shown in . The absence of overlapping is a proof of the model validity obtained from the training set valuesCitation33. Additionally, permutation plot, which is calculated by changing the order of coefficient values randomly against constant matrix of descriptors, was used to test the model predictability. Goodness of fit values (R2 and Q2) for the permuted y-values at the left side of were below the reference values at the rightCitation34,Citation35. This indicates the model reliability and also the y-intercept of regression line of Q2 should intersect y-axis at or below zero point for good predictabilityCitation34,Citation35. As shown in , the intercept was found equal to −0.26.
Figure 5. Internal validation chart resulted from plotting actual affinity values against the calculated ones by leaving-one-out strategy. The absence of overlapping between the clusters is a requirement for validity.
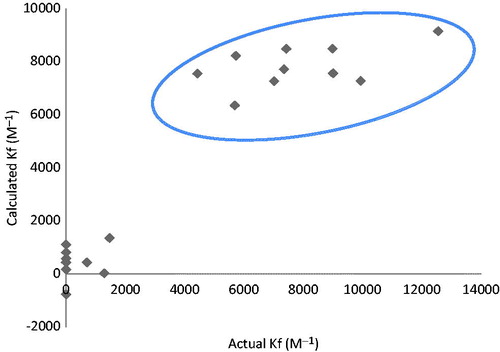
Figure 6. Permutation plot obtained by calculation of random order of affinity coefficients against the original set of descriptors. The model is not valid unless the goodness of fit values (R2 and Q2) at left are below the two reference points on the right and also the regression line of fir (Q2) should intersect y-axis at or below zero point.
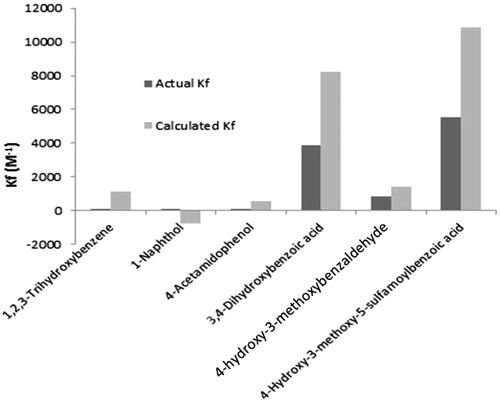
External validation of the model was tested by analyzing six molecules through the chromatographic method and compared with the corresponding predicted values from the equation of QSAR model (EquationEquation 1(1) ). Those which acquire strong actual affinity values were also predicted as strong inhibitors () and also the weak inhibitors were satisfactorily predicted.
Figure 7. Comparison for the calculated and actual values of affinity constant of molecules of testing set used to accomplish external validation for the QSAR model.
Docking analysis
Twenty-six compounds were used in the training and the testing sets. All these compounds have been docked using molecular modeling software and their results were in correlation to the experimental results performed in the enzyme. For example; ferulic acid has the highest consensus docking score of 633 (), while its assay results were considered of the top molecules of an actual Kf value of 7351 and calculated Kf value of 7712 (). In addition, it is noticeable that the top ranked molecules of both molecular docking results and the chromatographic assay were these compounds that possess carboxylic acid groups indicating their essentiality. Moreover, addition of an extra phenolic group to the carboxylic acid containing molecules will potentiate the activities of these molecules. The carboxylic group is thought to perform coordinate interactions between its negatively charged oxygens of the vacant orbitals of the zinc atom in the active site (). This finding is correlated to a publication performed by Nagata in 2012 where he discovered that the most common functional group that coordinated zinc atom inside the active site was COOHCitation36. Additionally, the docking study revealed that hydroxyl group of ferulic acid is able to bind with the guanido group of Arg67.
Figure 8. Ferulic acid docked inside the active site of CA-III showing the COO– group in optimum orientation with zinc atom with Oxygens-Zn distances of 2.398 and 2.246 respectively. [B is a closer look to zinc atom for clarification purposes].
![Figure 8. Ferulic acid docked inside the active site of CA-III showing the COO– group in optimum orientation with zinc atom with Oxygens-Zn distances of 2.398 and 2.246 respectively. [B is a closer look to zinc atom for clarification purposes].](/cms/asset/80949269-dfc9-490c-b71e-4f71b740b20b/ienz_a_940939_f0008_c.jpg)
Table 3. Results of docking studies using different programs and the consensus scores for training set and relevant compounds. Ferulic acid, caffeic acid and interestingly aspirin depicted the best score values.
Presence of only phenolic or aniline moiety on the tested compound will be weakly correlated to the activity which is proved by the consensus scoring results and the experimental data ().
Conclusion
It can be concluded that the vacancy chromatography is suitable for enzymatic inhibition studies against CAIII. The method was working independently of the enzyme catalytic activity. Screening of small molecules accessible to the narrow active site of CAIII enzyme displayed the necessity of carboxylate ion for reaching strong binding with the zinc atom in the enzyme. This work reveals novel inhibitors of CAIII enzyme. The carboxylic acid group of benzoic acid analogues potentiated with phenolic group at p-position represented the maximum activity. The role of the negative charge of the candidate inhibitors is emphasized by a significant correlation coefficient of molecular charge with affinity constants resulted from the valid QSAR model. Docking study also exhibited the importance of the negatively charged carboxylates. Co-crystallization of the enzyme with the tested compounds will be further studied in the future by single crystal X-ray to gather more information of binding enough to design potential synthetic drugs possessing stronger activity against CAIII.
Declaration of interest
We wish to thank The University of Jordan represented by the Deanship of Academic Research for supporting and funding the project of (55/2009/2010).
References
- Supuran CT, Scozzafava A, Casini A. Carbonic anhydrase inhibitors. Med Res Rev 2003;23:146–89
- Migliardini F, De Luca V, Carginale V, et al. Biomimetic CO2 capture using a highly thermostable bacterial α-carbonic anhydrase immobilized on a polyurethane foam. J Enzyme Inhib Med Chem 2014;29:146–50
- Supuran CT. Carbonic anhydrases: novel therapeutic applications for inhibitors and activators. Nat Rev Drug Discov 2008;7:168–81
- Neri D, Supuran CT. Interfering with pH regulation in tumours as a therapeutic strategy. Nat Rev Drug Discov 2011;10:767–77
- Supuran CT, Scozzafava A. Carbonic anhydrases as targets for medicinal chemistry. Bioorg Med Chem 2007;15:4336–50
- Gilmour KM. Perspectives on carbonic anhydrase. Comp Biochem Physiol A Mol Integr Physiol 2010;157:193–7
- Imtaiyaz Hassan M, Shajee B, Waheed A, et al. Structure, function and applications of carbonic anhydrase isozymes. Bioorg Med Chem 2012;21:1570–82
- Thiry A, Rolin S, Vullo D, et al. Indanesulfonamides as carbonic anhydrase inhibitors and anticonvulsant agents: structure-activity relationship and pharmacological evaluation. Eur J Med Chem 2008;43:2853–60
- Supuran CT, Scozzafava A, Menabuoni L, et al. Carbonic anhydrase inhibitors. Part 71: Synthesis and ocular pharmacology of a new class of water-soluble, topically effective intraocular pressure lowering sulfonamides incorporating picolinoyl moieties. Eur J Pharm Sci 1999;8:317–28
- Vuotikka P, Uusimaa P, Niemelä M, et al. Serum myoglobin/carbonic anhydrase III ratio as a marker of reperfusion after myocardial infarction. Int J Cardiol 2003;91:137–44
- Nishita T, Igarashi S-I, Asari M. Determination of carbonic anhydrase-III by enzyme-immunoassay in liver, muscle and serum of male rats with streptozotocin-induced diabetes mellitus. Int J Biochem Cell Biol 1995;27:359–64
- Mitterberger MC, Kim G, Rostek U, et al. Carbonic anhydrase III regulates peroxisome proliferator-activated receptor-γ2. Exp Cell Res 2012;318:877–86
- Innocenti A, Vullo D, Scozzafava A, Supuran CT. Carbonic anhydrase inhibitors: interactions of phenols with the 12 catalytically active mammalian isoforms (CA I-XIV). Bioorg Med Chem Lett 2008;18:1583–7
- Innocenti A, Vullo D, Scozzafava A, Supuran CT. Carbonic anhydrase inhibitors: inhibition of mammalian isoforms I-XIV with a series of substituted phenols including paracetamol and salicylic acid. Bioorg Med Chem Lett 2008;16:7424–8
- Carta F, Vullo D, Maresca A, Scozzafava A, Supuran CT. Mono-/dihydroxybenzoic acid esters and phenol pyridinium derivatives as inhibitors of the mammalian carbonic anhydrase isoforms I, II, VII, IX, XII and XIV. Bioorg Med Chem 2012;21:1564–9
- Davis RA, Innocenti A, Poulsen S-A, Supuran CT. Carbonic anhydrase inhibitors. Identification of selective inhibitors of the human mitochondrial isozymes VA and VB over the cytosolic isozymes I and II from a natural product-based phenolic library. Bioorg Med Chem 2010;18:14–18
- Alzweiri M, Al-Hiari Y. Evaluation of vanillic acid as inhibitor of carbonic anhydrase isozyme III by using a modified Hummel-Dreyer method: approach for drug discovery. Biomed Chromatogr 2013;27:1157–61
- Rengel Z. Carbonic anhydrase activity in leaves of wheat genotypes differing in Zn efficiency. J Plant Physiol 1995;147:251–6
- Conroy CW, Buck RH, Maren TH. The microchemical detection of carbonic anhydrase in corneal epithelia. Exp Eye Res 1992;55:637–40
- Elder I, Fisher Z, Laipis PJ, et al. Structural and kinetic analysis of proton shuttle residues in the active site of human carbonic anhydrase III. Proteins: Struct Funct Bioinform 2007;68:337–43
- Al-Balas Q, Hassan M, Al-Oudat B, et al. Generation of the first structure-based pharmacophore model containing a selective “zinc binding group” feature to identify potential glyoxalase-1 inhibitors. Molecules 2012;17:13740–58
- Clark RD, Strizhev A, Leonard JM, et al. Consensus scoring for ligand/protein interactions. J Mol Graph Model 2002;20:281–95
- Wu G, Robertson DH, Brooks CL, Vieth M. Detailed analysis of grid-based molecular docking: a case study of CDOCKER-A CHARMm-based MD docking algorithm. J Comput Chem 2003;24:1549–62
- Rao SN, Head MS, Kulkarni A, LaLonde JM. Validation studies of the site-directed docking program LibDock. J Chem Inf Model 2007;47:2159–71
- Muegge I. PMF scoring revisited. J Med Chem 2006;49:5895–902
- Böhm H-J. Prediction of binding constants of protein ligands: a fast method for the prioritization of hits obtained from de novo design or 3D database search programs. J Comput Aided Mol Des 1998;12:309
- Verdonk ML, Cole JC, Hartshorn MJ, et al. Improved protein-ligand docking using GOLD. Proteins: Struct Funct Bioinform 2003;52:609–23
- Flood KG, Reynolds ER, Snow NH. Determination of apparent association constants of steroid-cyclodextrin inclusion complexes using a modification of the Hummel-Dreyer method. J Chromatogr A 2001;913:261–8
- Alzweiri M, Watson DG, Parkinson JA. Metabonomics as a clinical tool of analysis: LC-MS approaches. J Liquid Chromatogr Relat Technol 2012;36:94–115
- Alzweiri M, Sills GJ, Leach JP, et al. Response to drug treatment in newly diagnosed epilepsy: A pilot study of 1H NMR-and MS-based metabonomic analysis. Epilepsy Res 2010;88:189–95
- Hothorn T, Bretz F, Westfall P. Simultaneous inference in general parametric models. Biometrical J 2008;50:346–63
- Martens H, Høy M, Westad F, et al. Analysis of designed experiments by stabilised PLS regression and jack-knifing. Chemometr Intell Lab 2001;58:151–70
- Shiyab S, Shatnawi M, Shibli R, et al. Influence of developmental stage on yield and composition of Origanum syriacum L. oil by multivariate analysis. J Med Plants Res 2012;6:2985–94
- Li X, Lu X, Tian J, et al. Application of fuzzy c-means clustering in data analysis of metabolomics. Anal Chem 2009;81:4468–75
- Gilbody S, Bower P, Whitty P. Costs and consequences of enhanced primary care for depression: systematic review of randomised economic evaluations. Br J Psychiatry 2006;189:297–308
- Kawai K, Nagata N. Metal-ligand interactions: an analysis of zinc binding groups using the Protein Data Bank. Eur J Med Chem 2012;51:271–6