
Abstract
Context: Bromoenol lactone (BEL) is an inhibitor of group VI phospholipases (iPLA2s), but has been shown to have severe side effects. Objective: iPLA2 characterization in osteoblasts and effect of BEL on prostaglandin (PG) E2 formation. Methods: iPLA2 expression: RT-PCR, Western Blotting. PGE2 formation: GC–MS after stimulation, treatment with inhibitors or gene silencing. Arachidonate (AA) reacylation into phospholipids, inhibitor reaction products, PGHS-1 modification proteomic analysis: HR-LC–MS/MS. AA accumulation: 14C-AA. Results: iPLA2ß and iPLA2γ were expressed and functionally active. BEL inhibition up to 20 μM caused AA accumulation and enhanced PGE2 formation, followed by a decrease at higher concentrations. BEL reacted with intracellular cysteine and GSH leading to GSH depletion and oxidative stress.
Discussion: Initial PGE2 enhancement after BEL inhibition is due to iPLA2-independent accumulation of AA. GSH depletion caused by high BEL concentrations is responsible for the decrease in PGE2 production. Conclusion: BEL must be used with caution in a cellular environment due to conditions of extreme oxidative stress.
Introduction
Phospholipases (PLA2s) catalyze hydrolysis of PL substrates at the sn-2 position to the free fatty acid and a 2-lysophospholipid. These products are or produce mediators of high activity. AA released from phospholipids is the precursor of eicosanoids that can exert a wide range of physiological effectsCitation1. The lysophospholipid may be converted to lysophosphatidic acid or acetylated to yield platelet activating factor, another bioactive moleculeCitation2,Citation3. The PLA2 superfamily currently consists of 15 groups that can be divided into five principal types according to their catalytic mechanism as well as structural and functional featuresCitation4,Citation5.
Group VI iPLA2s are calcium-independent enzymes based on serine catalysis which show no fatty acid specificity at the sn-2 position. iPLA2ß is located in the cytosol, contains eight ankyrin repeats at the N-terminal and a caspase cleaving siteCitation6. Several biological functions have been assigned to iPLA2ß (group VIA), including phospholipid (PL) remodellingCitation7, arachidonate (AA) release with subsequent prostaglandin (PG) formationCitation8,Citation9, protein expressionCitation10, secretionCitation11, apoptosisCitation9 and calcium signallingCitation12. iPLA2γ (group VIB) is localized to the mitochondrial, peroxisomal and endoplasmic membranesCitation13–15. Its utilization of distinct translation initiation sites results in different sizes of enzymes with distinct subcellular localizationCitation14. A functional coupling of iPLA2γ to prostaglandin endoperoxide H synthase (PGHS)-1 with resulting prostaglandin formation has been demonstratedCitation16, yet the true cellular function of this enzyme remains largely obscure. Decreased iPLA2γ expression induces lipid peroxidation and cell death and sensitizes cells to oxidant-induced apoptosisCitation17. A differential role for iPLA2γ and iPLA2ß has been proposed in cellular growth and maintenance of phospholipidsCitation18. Group VI iPLA2s are relatively specifically inhibited by 6E-(bromomethylene)tetrahydro-3-(1-naphthalenyl)-2H-pyran-2-one (BEL), where iPLA2γ and iPLA2ß show different sensitivities towards the enantiomers of the optically active blockerCitation19. More recently, the family of iPLA2s has been expanded by several lipases with iPLA2 activity: iPLA2δ (neuropathy target esterase), with robust lysophospholipase activityCitation20, as well as iPLA2ɛ (adiponutrin), iPLA2ζ (desnutrin) and iPLA2η (GS2), which exhibit triacylglycerol lipase and transacylase activitiesCitation21.
BEL is an inhibitor for iPLA2sCitation22 and other serine hydrolases like chymotrypsinCitation23,Citation24 and magnesium-dependent phosphatidate phosphohydrolase (PAP-1)Citation25, and also glutathione (GSH)-S-transferaseCitation26. The mechanism-based irreversible inhibition requires enzymatic hydrolysis to a reactive alkylating species, 6-bromo-2-(1-naphtyl)-5-oxohexanoic acid (BMK). Recent studies have raised doubt on the specificity of the blocker, as BMK can alkylate reactive cysteine residues in various proteins non-specificallyCitation27.
Osteoblastic PGE2 formation is a key metabolic response to many physiological modulators of bone cell activity. The rate limiting step for prostaglandin formation is the liberation of the precursor fatty acid AA from glycerophospholipids for subsequent oxidation by constitutively expressed PGHS-1 or inducible PGHS-2. It is well established that cPLA2 and group II sPLA2s are responsible for this step in many cell typesCitation28–30. However, there is accumulating evidence that iPLA2s can participate in AA release and eicosanoid production in a manner depending on cell type and stimulus usedCitation31–33. Only little is known about the occurrence and function of iPLA2s in bone: recently, it has been demonstrated that iPLA2ß knockout mice develop an age-related low bone mass phenotypeCitation34. There are, to our knowledge, no other investigations on these enzymes in bone cells.
It was thus the aim of our study to explore the occurrence of iPLA2γ and iPLA2ß in murine osteoblast-like MC3T3-E1 cells and to address the effect of BEL on osteoblastic prostaglandin synthesis.
Materials and methods
Materials
Alpha-minimum essential medium (α-MEM) and fetal calf serum (FCS) were obtained from Sera-lab (Vienna, Austria). Trypsin/ethylene diamine tetraacetic acid (EDTA) was purchased from Böhringer (Mannheim, FRG). Nitrocellulose membranes (0.45 mm pore size) were obtained from Gibco Invitrogen (Lofer, Austria). Collagenase was from BioWhittaker Europe (Verviers, Belgium). l-Glutamine was from Serva (Vienna, Austria). [14C]-AA was purchased from Amersham (Vienna, Austria). 1-Palmitoyl-2-[14C]arachidononyl-sn-glycero-3-phosphocholine was from PerkinElmer (Waltham, MA). PGHS-1 and R-BEL, S-BEL, ±BEL and [2H8]-AA were from Cayman Chemical (via Biomol, FRG). Endothelin-1 (ET-1), 1-palmitoyl-2-arachidononyl-sn-glycero-3-phosphocholine, d,l-buthionine-[S,R]-sulfoximine (BSO), N-ethylmaleimide (NEM) and 4-(2-hydroxyethyl)piperazine-1-ethanesulfonic acid (HEPES) were purchased from Sigma-Aldrich (Vienna, Austria). Goat polyclonal antibody iPLA2 T14 was obtained through Santa Cruz via Szabo (Vienna, Austria). Antibody stripping buffer was from Gene Bio Application Ltd. (Kfar-Hanagid, Israel). Complete Mini protease inhibitor cocktail tablets were from Roche Diagnostics (Mannheim, Germany). NuPAGE 10% Bis–Tris Gels, NuPAGE MES SDS running buffer, NuPAGE LDS sample buffer, NuPAGE sample reducing agent, SeeBlue Plus prestained standard, DNaseI and OligofectamineTM were purchased from Invitrogen (Vienna, Austria). BCA Protein Assay and SuperSignal West Pico Chemiluminescent Substrate were from Pierce Biotechnology, and Hyperfilm MP was obtained from Amersham Biosciences (Buckinghampshire, UK). QIAGEN OneStep reverse transcription polymerase chain reaction (RT-PCR) kit as well as negative control small interfering RNA (siRNA) and Flexitube siRNAs for iPLA2ß and iPLA2γ (set of four siRNAs) were from QIAGEN (Hilden, Germany). Primer pairs were purchased from TIB MOLBIOL (Berlin, Germany). Pentafluorobenzyl bromide (PFBBr), bis-(N,O-trimethylsilyl) trifluoroacetamide (MSTFA), silylation grade pyridine, acetonitrile, and O-methoxyamine hydrochloride (MOX) were from Pierce Chemical Co. (Rockford, IL). Culture dishes were from Falcon via Szabo (Vienna, Austria). MC3T3-E1 cells (an osteoblastic immortalized cell line) were kindly donated by Dr. Klaushofer (Vienna, Austria)). Deuterated PGE2 was obtained through MSD Isotopes via IC Chemikalien GmbH. All other chemicals, solvents and reagents were from Merck (Darmstadt, FRG).
Cell culture
MC3T3-E1 cells (passage 10–30) were cultured in α-MEM containing 5% FCS, 50 μg mL−1 ascorbate and l-glutamine (0.584 g L−1) in a humidified atmosphere of 5% CO2 in 80 cm2 flasks (initial plating density 2 × 10⁴ cells cm−2) and transferred to 4 cm2 12- or 6-well culture dishes, or 100 mm round dishes before experiments. Experiments were carried out at confluency (100%). For prostaglandin measurements cells were cultured under starving conditions (0.2% FCS in α-MEM) for 24 h prior to stimulation to avoid serum induction of PGHS-2Citation35. Incubations with various agonists were carried out in the abovementioned medium or incubation buffer (d-glucose, 5.5 mM; KCl, 5.3 mM; NaCl, 136.8 mM; HEPES, 20.0 mM; ascorbate, 0.28 mM) as indicated at certain experiments.
RT-PCR analysis of iPLA2ß and iPLA2γ
MC3T3-E1 cells were lysed by addition of 600 μL RLT Buffer (QIAGEN) and harvested with a rubber policeman. RNA was extracted according to the manufacturer instructions using RNeasy Mini Kit (QIAGEN). To amplify mouse iPLA2 mRNAs, the following set of primers was used: 5′-CAGTTTCAAAGGCTATTTTTGG-3′ (iPLA2γ, forward), 5′-TTTTTCCCTTGCTTTTGAAATAG-3′(iPLA2γ, reverse), 5′-GTCATTATCCAGCTTCTCATC-3′ (iPLA2ß, forward) and 5′-GAGAGTTTCTTCACCTTGTTG-3′ (iPLA2ß, reverse)Citation10. RT-PCR was carried out using OneStep RT-PCR kit, according to the manufacturer instructions. The conditions of PCR-amplification were: 35 cycles; denaturation 30 s at 94 °C, 30 s at annealing temperature (60 °C), extension step 120 s (72 °C); final 7 min elongation (72 °C). The amplified product was loaded at two concentrations, 10 ng and 50 ng resolved on RNeasyAgarose gels supplemented with 0.1% (v/v) ethidium bromide and visualised using a UV transilluminator (Herolab). To ensure equal RNA loading, RT-PCR for glyceraldehyde 3-phosphate dehydrogenase (GAPDH) was performed for each experiment.
Subcellular fractionation
Cells were washed twice with 10 mL phosphate-buffered saline (PBS) and then 200 μL of lysis buffer (10 mM HEPES, 1 mM EDTA, 0.34 M sucrose, Mini Complete protease inhibitor cocktail; pH 7.5) were added. Cells were harvested, lysates generated by sonication (2 × 10 s) and centrifuged immediately at 1000×g (4 °C) for 10 min. Cytosolic and membrane-containing fractions were prepared by ultracentrifugation (g×100 000) for one hour at 4 °C.
iPLA2 activity assay
This was basically performed as previously described in the presence of Triton X-100 and ATP to prevent activity lossCitation36,Citation37. 1-Palmitoyl-2-arachidononyl-sn-glycero-3-phosphocholine and 1-palmitoyl-2-[14C]arachidononyl-sn-glycero-3-phosphocholine were dried and suspended in 1 mL of assay buffer (100 mM HEPES; 400 μM Triton X-100; 5 mM EDTA; 2 mM dithiothreitol (DTT); 1 mM ATP; pH 7.5) by sonication (5 min) and diluted 1:10 with assay buffer (final substrate concentration 100 μM (100 000 cpm per assay)). Fifty microliters of enzyme sample was added to 450 μL of substrate to start the reaction at 40 °C for 60 min. The reaction was stopped by addition of 2.5 mL of Dole reagent (2-propanol/heptane/0.5 M H2SO4, 400:100:20, v/v/v). The product mixture was subsequently processed according to the modified Dole assayCitation38. Briefly, 200 mg of Merck Kieselgel 60 was added to the mixture, fatty acids extracted with 1.5 mL of heptane and 1.5 mL of H2O, and the upper layer was loaded onto a silicic acid column. The eluent and a subsequent diethyl ether wash were collected in a scintillation vial, mixed with 10 mL of scintillation fluid and subjected to liquid scintillation counting.
Western blotting of iPLA2ß
Cells were washed with chilled PBS and lysed on ice for 15 min in 100 μL of lysis buffer (HEPES, 50 mM; NaCl, 150 mM; EDTA, 1 mM; Na4P2O7, 10 mM; Na3VO4, 2 mM; NaF, 10 mM; Triton X-100, 1%, v/v; glycerol, 10%, v/v; protease inhibitor cocktail tablets; pH 7.4). Cell lysates were scraped off and cell debris was removed by centrifugation at 11 000 g at 4 °C for 10 min. Protein lysates (130 μg) were diluted in NuPAGE LDS sample buffer and NuPAGE sample reducing agent to a final volume of 45 μL. The samples were heated for 10 min at 70 °C and then subjected to electrophoresis on 4–12% NuPAGE Bis–Tris Gels, 1.5 mm in NuPAGE MES SDS running buffer (80 min at 130 V). Proteins were transferred to nitrocellulose membranes (2 h, 0.3 A) and blocked with non-fat milk powder. Blots were incubated with goat polyclonal antibody iPLA2 T14 (dilution 1:200 in 3% bovine serum albumin (BSA)) for two hours at room temperature. Membranes were washed and then incubated with horseradish peroxidase-conjugated donkey anti-goat IgG (dilution 1:200 000) for two hours at room temperature. After washing, immunoreactive signals were detected with SuperSignal® West Pico chemiluminescent substrate and exposure to Hyperfilm MP. For loading controls, membranes were stripped and reprobed with a primary antibody recognizing ß-actin and horseradish peroxidase-conjugated goat anti-mouse IgG was used as a secondary antibody.
Arachidonate incorporation into cellular phospholipids
Confluent cells were washed with PBS (37 °C). Two milliliters of incubation buffer was added along with the indicated amounts of vehicle and/or BEL. After 30 min, 1 μCi 14C-AA (final concentration 8.93 μM) or [2H8]-AA (final concentration 10 μM) was added to the buffer and incubated for another 30 min. Cells were washed twice with ice-cold PBS containing 0.5% BSA. 0.4 mL PBS was added along with 1 mL methanol. Cells were scraped off and lipids extracted according to Bligh and DyerCitation35. The extract was dried under nitrogen, the residue reconstituted in 100 μL chloroform and analysed by liquid chromatography–high resolution mass spectrometry LC–HRMS (2H8-AA) or further processed (14C-AA): The chloroform solutions were added to columns of Merck Kieselgel G60 (110 mg), washed twice with 1 mL chloroform and phospholipids were eluted with 2 × 1 mL of methanol/chloroform (4:1, v/v). The eluate was dried under nitrogen and redissolved in 100 μL methanol. An aliquot was subjected to liquid scintillation counting.
Reactivity of BEL and BMK towards incubation buffer and cellular components
Experiments with BEL or BMK were conducted using buffers with different supplements and stimulated with AA (6 μM) where appropriate. Buffers were then analysed for PGE2, BEL or BMK content by gas chromatography negative ion chemical ionization mass spectrometry (GC-NICI-MS) or HR-LC–MS/MS and to identify possible reaction products.
PGHS enzyme assays
Enzyme inhibitor potencies were elucidated in Tris/HCl buffer (30 mM, pH 8.0), containing epinephrine (1 mM), hematine (1 μM) and PGHS (1 u). Pre-incubation with BEL or BMK was carried out for 30 min at room temperature. Incubation with AA (final concentration 1 μM) was performed for 30 min at 37 °C and the reaction stopped with ice-cold formic acid (0.2%). Assay for PGE2 was then performed.
PGE2 analysis
After incubations with test compounds the incubation medium was removed and PGE2 measured by GC-NICI-MSCitation39. Briefly, PGE2 was converted to its PFB ester-trimethylsilyl ether-O-methyloxime derivative. Quantitation was carried out by use of tetradeuterated PGE2. An ISQ GC-MS system (Thermo) was used. GC was performed on a 15 m TG-SQC fused silica capillary column (Thermo). Injector temperature was 290 °C, initial column temperature was 160 °C (1 min), followed by an increase of 40°/min to 310 °C. NICI was carried out by SIM with methane as a moderating gas.
High-resolution mass spectrometry
LC–HRMS was performed on an Accela 1250 HPLC System connected to the heated electrospray source of a Q-Exactive Orbitrap mass spectrometer (Thermo Scientific). Data-dependent MS2: full MS resolution 140 000; MSCitation2 resolution 17 500; isolation with 4.0 amu; data dependent loop count: top 30 with apex triggering (8–15 s) and dynamic exclusion (10 s) with stepped normalised collision energy (25–30–35%). LC conditions for phospholipid profiling were: Hypersil Gold (C18; 1.0 mm × 100 mm; 1.9 μm; Thermo Scientific) with gradient from solvent A (0.1% formic acid, containing 385 mg L−1 ammonium acetate) to solvent B (acetonitrile/2-propanol (5:2, v/v); 0.1% formic acid, containing 385 mg-L ammonium acetate) at a flow rate of 250 μL min−1: 35% B to 70% A (4 min); to 100% B (16 min); hold for 10 min. Data were analysed by SIEVE and XCALIBUR software (Thermo).
For protein mass spectrometry the electrophoresis gel was stained with comassie blue (SimplyBlue safe stain) and corresponding bands excised. After destaining, alkylation with iodoaceamide and digestion with trypsin, chymotrypsin, elastase, or combinations of them, peptides were dissolved in 5% methanol/water, containing 0.1% formic acid. 20 μL were injected on an Acclaim PepMap 100 column (C18; 1.0 mm × 15 cm; 3 μm; 100 Å; Thermo Scientific) with a gradient from solvent A (0.1% formic acid) to solvent B (methanol; 0.1% formic acid) at a flow rate of 50 μL min−1: 5% B to 40% B (30 min); to 100% B (45 min); hold for 15 min and return to starting conditions. Data were analysed with Proteome Discoverer 1.4 software (Thermo Scientific) performing Sequest search in the Swissprot protein database.
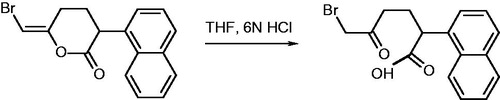
Synthesis of BMK
BMK was obtained from BEL as previously describedCitation22. Briefly, 10 mg of BEL were dissolved in 0.5 mL of tetrahydrofurane and 100 μL of 6N HCl added. After two hours at room temperature 4 mL of water were added and the mixture extracted with 4 mL of ethyl acetate. The organic phase was dried over sodium sulphate and purified by flash chromatography. The procedure is outlined in Scheme 1:
Scheme 1. Synthesis of BMK from BEL.
siRNA transfection
MC3T3-E1 cells were cultured in six-well plates. At 30–50% confluency cells were transfected with four different siRNAs (100 nM) specific for iPLA2ß or iPLA2γ using the lipid transfection reagent oligofectamineTM according to the manusfacturer’s instructions. A scrambled siRNA was used as a negative control. cPLA2 silencing was monitored by Western Blotting. At confluency, cells were stimulated with ET-1 as indicated and PGE2 formation measured.
All data shown are representative of at least three independent experiments.
Results
Identification and activity of iPLA2ß and iPLA2γ in osteoblastic cells
RT-PCR analysis demonstrates that iPLA2ß and iPLA2γ mRNA is expressed in MC3T3-E1 cells (). Western blot analysis of iPLA2ß confirmed its presence at the protein level, and moreover, in other cells of the osteoblastic phenotype, like MG63, SAOS-2 (human osteosarcoma), UMR-106 and ROS17/2.8 (rat osteosarcoma) (). In contrast to the other cell lines investigated, MC3T3-E1 showed additional immunoreactivity with varying intensity at ∼90–100 kDa. As shown in iPLA2ß activity is only present in the cytosol. Total activity of iPLA2s as measured in MC3T3-E1 and MG63 cells is shown in . After subcellular fractionation iPLA2 activity was found in both, the cytosol and membrane-containing fraction (). The higher activity measured in fractionated samples is due to higher protein concentrations used in the activity assay.
Figure 1. RT-PCR of iPLA2γ and iPLA2ß in murine MC3T3-E1 osteoblast-like cells. Cells were cultured in α-MEM, RNA was isolated and iPLA2γ and iPLA2ß fragments were amplified by RT-PCR using specific forward and reverse oligonucleotide primer pairs. The PCR products were separated on 1.5% agarose gels. Expected amplicone sizes were 589 bp for iPLA2ß und 332 bp for iPLA2γ. One representative experiment out of three is shown.
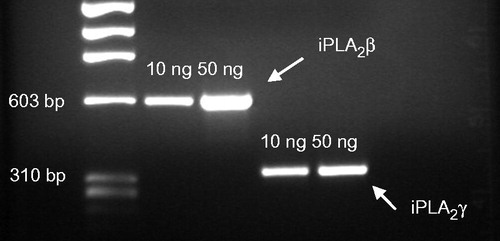
Figure 2. (A) Western blot of iPLA2ß in osteoblastic cells. Cells were lysed and aliquots of protein lysates were subjected to SDS-PAGE and transferred to nitrocellulose. MC = MC3T3-E1; MG = MG63; SA = SAOS-2; UM = UMR-106; RO = ROS 17/2.8. (B) Western blot of iPLA2ß in murine MC3T3-E1 cells after subcellular fractionation (100 000×g). P = pellet, containing membrane fractions; S = supernatant (100 000×g) corresponding to cytosolic fraction.
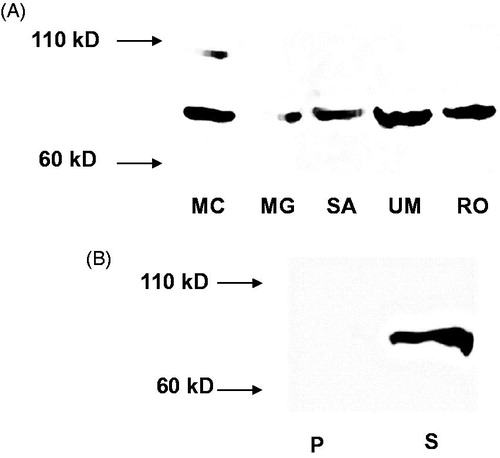
Figure 3. iPLA2 activity in MC3T3-E1 and MG63 osteoblastic cells. (A) Total iPLA2 activity in cell lysates. (B) iPLA2 activity in cytosolic (black bars) and membrane-containing (open bars) fractions after subcellular fractionation. iPLA2 activity in lysates and fractions were measured using 1-palmitoyl-2-[14C]arachidononyl-sn-glycero-3-phosphocholine as a substrate in assay buffer (100 mM HEPES; 400 μM Triton X-100; 5 mM EDTA; 2 mM DTT, 1 mM ATP; pH 7.5) at 40 °C for 60 min.
![Figure 3. iPLA2 activity in MC3T3-E1 and MG63 osteoblastic cells. (A) Total iPLA2 activity in cell lysates. (B) iPLA2 activity in cytosolic (black bars) and membrane-containing (open bars) fractions after subcellular fractionation. iPLA2 activity in lysates and fractions were measured using 1-palmitoyl-2-[14C]arachidononyl-sn-glycero-3-phosphocholine as a substrate in assay buffer (100 mM HEPES; 400 μM Triton X-100; 5 mM EDTA; 2 mM DTT, 1 mM ATP; pH 7.5) at 40 °C for 60 min.](/cms/asset/ba47473e-8d0a-41ad-8b5d-ca18347a8960/ienz_a_1114929_f0003_b.jpg)
Function of iPLA2ß and iPLA2γ in PGE2 synthesis of MC3T3-E1 cells
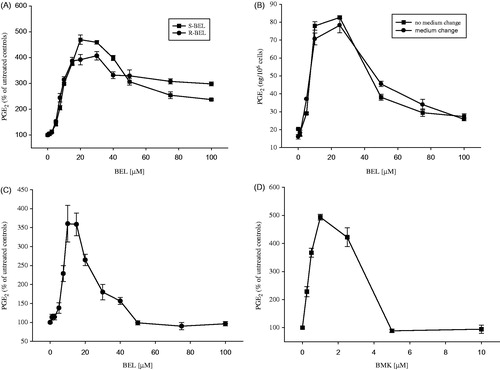
The effects of ± BEL, S-BEL and R-BEL on osteoblastic PGE2 production after stimulation with exogenous AA are given in . Racemic and enantiopure inhibitors show nearly identical dose–response curves. Upon inhibition of iPLA2s, PGE2 levels increase dose-dependently reaching a maximum at BEL concentrations of 10–20 μM with 4–5 fold higher PGE2 production compared to untreated controls. Identical behaviour is also observed when endogenous AA is released after stimulation with ET-1, as shown in . The presence of extracellular calcium (1.8 mM) did not alter the response to BEL. Increasing the concentration of the inhibitors results in attenuation of the prostaglandin response. A similar response was achieved with BMK after stimulation with AA with maximal PGE2 synthesis at 1 μM and complete abolishment above 5 μM, as shown in .
Figure 4. Effect of ± BEL, S-BEL, R-BEL and BMK on short-term synthesis of PGE2 by MC3T3-E1 cells. Pre-incubation with blockers at the indicated concentrations was performed for 30 min. After that, agonists were added to the buffer and incubation was allowed to proceed for another 30 min. PGE2 release was measured as described under 2.8. (A) Stimulation with AA (6 μM), no Ca2+ex; (B) preincubation with ± BEL with and without medium change before AA stimulation; (C) stimulation with ET-1 (50 nM), •=R-BEL; Ca2+ex=1.8 mM; and (D) preincubation with BMK and stimulation with AA (6 μM).
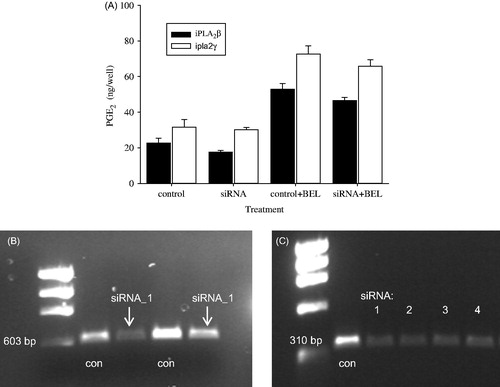
The results of PGE2 synthesis after silencing of iPLA2ß and iPLA2γ are shown in , with a set of two different siRNAs (iPLA2ß) or four different siRNAs (iPLA2γ). Effective silencing was confirmed by RT-PCR (results shown in , respectively). The most effective siRNA was used for experiments. Upon silencing, PGE2 formation is reduced by 22.9% (iPLA2ß) and 5.5% (iPLA2γ) in comparison to non-silenced controls (control siRNA). In the presence of 10 μM ± BEL, however, PGE2 levels were increased by 133% and 121%, respectively.
Figure 5. (A) ET-1-induced formation of PGE2 in MC3T3-E1 cells after silencing of iPLA2γ and iPLA2ß using iPLA2-specific siRNAs. Pre-incubation with ± BEL (10 μM) was performed for 30 min. After that, agonists were added to the buffer and incubation was allowed to proceed for another 30 min. RT-PCR showing silencing of iPLA2ß (B) and iPLA2γ (C).
Function of iPLA2ß and iPLA2γ in membrane phospholipid remodeling
As shown in , the incorporation of [14C]-AA into cellular phospholipids is roughly equally reduced by ∼60% by S-BEL and R-BEL. BEL is an activity-based inhibitor of iPLA2s with about 10 fold preference of its pure enantiomers towards iPLA2γ (R-BEL) and iPLA2ß (S-BEL), respectivelyCitation19. Significant inhibition is only observed above 20 μM BEL.
Figure 6. Inhibition of [14C]-AA and [2H8]-AA incorporation into cellular phospholipids of MC3T3-E1 cells by BEL. Pre-incubation with BEL at the indicated concentrations was performed for 30 min. After that, 1 μCi 14C-AA (final concentration 8.93 μM) or [2H8]-AA (final concentration 10 μM) was added to the buffer and incubation was allowed to proceed for another 30 min. Lipids were extracted according to Bligh and Dyer. Radiolabelled lipids were subjected to liquid scintillation counting, [2H8]-AA-containing PLs were analysed by HR-LC-MS/MS.
![Figure 6. Inhibition of [14C]-AA and [2H8]-AA incorporation into cellular phospholipids of MC3T3-E1 cells by BEL. Pre-incubation with BEL at the indicated concentrations was performed for 30 min. After that, 1 μCi 14C-AA (final concentration 8.93 μM) or [2H8]-AA (final concentration 10 μM) was added to the buffer and incubation was allowed to proceed for another 30 min. Lipids were extracted according to Bligh and Dyer. Radiolabelled lipids were subjected to liquid scintillation counting, [2H8]-AA-containing PLs were analysed by HR-LC-MS/MS.](/cms/asset/7330dd9c-7f56-4fe2-96e7-5586a9791ca2/ienz_a_1114929_f0006_b.jpg)
A more detailed view is gained by using [2H8]-AA instead of [14C]-AA. Major [2H8]-AA-containing PLs were identified to quantify the effect of BEL. Data are expressed as percentage ratio of [2H8]-AA and AA (sum of both = 100%) for each PL species. The results for selected PLs are shown in . Throughout the selected PL species, [2H8]-AA uptake was significantly inhibited only at high BEL concentrations of 20 μM. The labelling occurred predominantly into phosphatidyl cholines, reaching more than 40% [2H8]-AA-containing lipid, thereby increasing the total amount of the particular PL by 50–60%. After treatment with 20 μM BEL this increase is reduced to 20–25%.
Reactivity of BEL and BMK towards incubation medium and cellular components
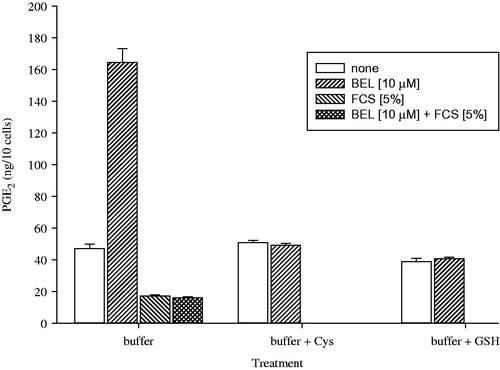
The effect of BEL-enhanced PGE2 production was completely blunted, when FCS (5%), cysteine (100 mg mg L−1) and glutathione (100 mg L−1) were supplemented to the incubation buffer, as shown in .
Figure 7. Reaction of BEL with incubation buffer additives. Buffer was supplemented with BEL, FCS (5%), cysteine (100 mg L−1) and GSH (100 mg L−1) as indicated and BEL and reaction products were measured by HR-LC–MS/MS.
Analysis of the buffer mixtures revealed three isomeric condensation products of cysteine and BEL as C19H17NO3S (M=339.0929) as main components and traces of the BEL-cysteine adduct at M=358.1108.
GSH reacted with BEL to form the BEL-GSH adduct (C26H29N3O8S; M=543.1675) in minor amounts and two isomers corresponding to the BMK-adduct (C26H31N3O9S; M=561.1781) as main products. Besides that, aminoethanol and DTT also reacted with BEL, whereas N-acetyl-cysteine, glycine, valine, leucine, aspartate, tyrosine, serine and threonine showed no reaction. Similar results were obtained with BMK.
Consumption of BEL under different experimental conditions is shown in . Concentration of BEL in neat incubation buffer was set to 100%. After addition to MC3T3-E1 cells, the amount of BEL was reduced by 40%. Cysteine and GSH at 100 mg L−1 completely removed BEL from the incubation buffer, regardless if cells were present or not.
Table 1. Decrease of BEL by thiol compounds.
The presence of CoA lowered BEL to roughly half of its initial amount in incubation buffer, but with cells it further decreased to 16.8%. No reaction products were observed in the absence of supplementary thiols in incubation buffer, providing a blank zero value. Such products for cysteine and GSH were well detected after supplementation of the thiol compounds and, furthermore, also in experiments where cells were treated with BEL alone. No alkylation product of CoA was detectable.
Effect of GSH-depleting agents on PGE2 formation
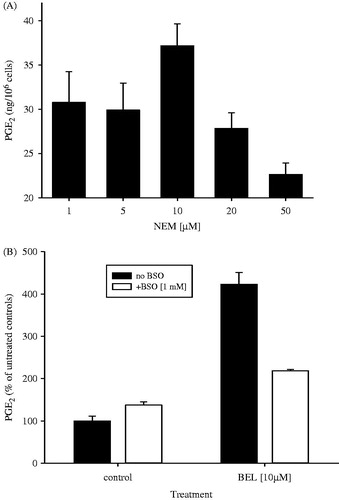
When cells were treated with NEM and subsequently stimulated with AA (6 μM), a concentration-dependent effect similar to BEL was observed (). PGE2 levels raised by 33.6% (10 μM NEM) and declined to sub-basal levels at higher concentrations. Pre-treatment of cells with BSO also attenuated the effect of BEL on AA-stimulated PGE2 formation (). In untreated controls, BEL (10 μM) enhanced PGE2 levels 4.2 fold, whereas after BSO treatment the effect was only 1.6 fold. Basal levels without BEL treatment were also enhanced by 37% after BSO pre-treatment.
Figure 8. (A) Effect of NEM on AA-induced formation of PGE2 in MC3T3-E1 cells. Pre-incubation with NEM at the indicated concentrations was performed for 20 min, followed by AA stimulation (6 μM) for 30 min. (B) Effect of BSO pre-treatment and BEL (10 μM) on AA-induced (6 μM) formation of PGE2 in MC3T3-E1 cells. Cells were cultured in the absence or presence of BSO (1 mM) for 24 h prior to experiments. Preincubation with BEL was for 20 min, followed by AA-stimulation for 30 min.
Effect of BEL and BMK on PGE2 formation by purified PGHS-1
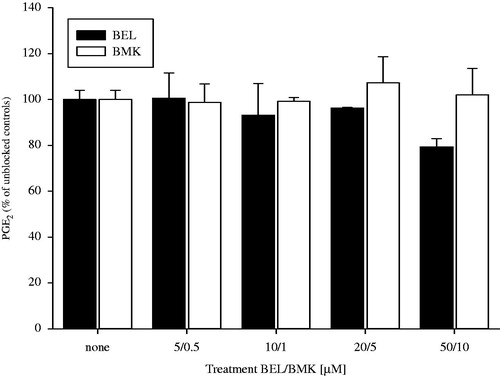
BEL and BMK did not show any inhibitory effect on purified PGHS-1 within the concentration range tested, as evidenced in . Indomethacin (50 μM) was used as a positive blocking control (results not shown).
Figure 9. Effect of ± BEL and BMK on the activity of PGHS-1 (1 u). Pre-incubation with blockers at the indicated concentrations was performed for 30 min. followed by adding AA for another 30 min. PGE2 formation was measured afterwards.
Proteomic analysis of PGHS-1
LC–HR-MS/MS analysis of the peptides showed 100% sequence coverage for PGHS-1 with 66.83% high-confidence identification. Twelve out of 13 cysteine residues present were alkylated by iodoacetamide (high confidence). No BEL or BMK adduct was found at high or medium confidence level.
Discussion and conclusions
Identification and activity of iPLA2ß and iPLA2γ in osteoblastic cells
Although, iPLA2s have been identified in many cells and tissues in the past decade, no data are available on their occurrence and role in bone cells. Since iPLA2-knockout mice develop an age-dependent low bone mass phenotypeCitation34, a crucial role of these enzymes in bone cell biology must be considered. The appearance of a second immunoreactive band in MC3T3-E cells could be due to different splice variants of iPLA2ßCitation40,Citation41, in particular the active forms GVIA-1 and GVIA-2, or a mouse-specific artefact produced by the antibody used. It is well described that iPLA2γ is localized to the mitochondrial, peroxisomal and endoplasmic membranesCitation13,Citation14 whereas iPLA2ß splice variants are cytosolic (GVIA-1)Citation41–43 or membrane-bound (GVIA-2)Citation36,41–43. Thus, the activity measured in the membrane-containing fraction could be related to iPLA2γ and/or iPLA2ß GVIA-2. However, as the results from RT-PCR prove the expression of iPLA2γ in these cells, it is feasible to assume both, iPLA2γ and iPLA2ß activity in osteoblastic cells. Furthermore, no reactive band was observed in the membrane-containing fraction thus rendering the activity measured therein most likely being to iPLA2γ-related.
Function of iPLA2ß and iPLA2γ in PGE2 synthesis of MC3T3-E1 cells
AA liberation can be regarded as the rate-limiting step in prostaglandin synthesis. Thus, the increase in PGE2 production could be due to increased AA release, impaired sequestration of released AA, or enhancement of downstream enzymes activity. Increased AA release can be ruled out since the effect is quantitatively identical after ET-1- and AA-stimulation and independent of calcium. There is an ongoing deacylation/acylation cycle of membrane phospholipids in cells (Lands’ cycleCitation44) whereby initial deacylation produces a lysophospholipid which may in turn be reacylated to yield a remodelled phospholipidCitation45. This process is calcium-independent and regarded as the major route for incorporation of free AA into phospholipidsCitation8. Since inhibition of iPLA2s should prevent this ubiquitous deacylation reaction, free AA levels should remain high and produce PGE2 by PGHS enzymes in larger amounts. The striking increase of prostaglandin levels is thus in accordance with the high efficiency of the Lands’ cycle, as micromolar concentrations of free AA can be effectively removed by reacylation when substrate-delivering iPLA2s are not blocked. However, concentrations needed for iPLA2 inhibition are far lower (IC50 = 60 nM)Citation22, than the ones necessary to obtain a maximal stimulating effect. Recent studies on the inhibitory mechanism of BEL show that it acts as a suicide substrate that irreversibly inactivates iPLA2γ and iPLA2ß, whereby precedent hydrolysis of the inhibitor lactone requires intact enzyme activityCitation27. The product, a bromomethyl keto acid, may freely diffuse and alkylate cysteine thiols or display other intracellular effects. This was confirmed in our experiments as BMK is even more potent in producing the observed effect. BEL does not inhibit enzymes of the reacylation cycleCitation7 but inhibits PAP-1 and triacylglycerol biosynthesis with an IC50 of 8 μM in intact cellsCitation25. This could either elevate PGE2 formation by causing AA accumulation, but also reduce it by preventing AA liberation via diacylglycerol lipases.
If inhibition of iPLA2ß and iPLA2γ by BEL would be the cause of enhanced PGE2 synthesis, silencing of these enzymes with specific siRNAs should produce similar results. Our results, however, show a reduction of AA-induced PGE2 formation after gene silencing, thus clearly ruling out a contribution of these enzymes to the observed effect. Additionally, performing the experiments in the presence of BEL, the striking increase can be found also after silencing. Prostaglandin formation can be regarded as the net effect between AA supply and its sequestration, and iPLA2-derived lysophospholipids represent only one route to the substrate for reesterification of AA. In our case, this contribution is minor compared to obviously existing other effects.
Function of iPLA2ß and iPLA2γ in membrane phospholipid remodeling
As for PGE2 production, blockage of AA reacylation into phospholipids is only evident at BEL concentrations far beyond the requirements for iPLA2 inhibition. This is confirmed by two independent approaches using different methodology. It is noteworthy, that the effective inhibitor concentration is even lower when enantiospecific BEL is used compared to the racemic form.
The results discussed so far thus indicate that BEL-related increase of PGE2 formation is largely due to accumulation of free AA by non-iPLA2 related mechanisms. Therefore we have conducted experiments on the reactivity of BEL and BMK with certain crucial cellular and incubation medium components to shed some further light into these BEL-mediated process.
Reactivity of BEL and BMK towards incubation medium and cellular components
FCS, cysteine and GSH completely abolished BEL-induced PGE2 synthesis. For FCS, this could be due to reduction of the actual blocker concentration by albumin binding, or reaction of BEL with cysteine and GSH, as they may still be present excess to BEL (∼50 μM in 5% FCSCitation46). It has been shown that BMK may alkylate thiols or other functional groups, but BEL has so far not been considered to show such reactivity. Our results clearly show, that BEL reacts with GSH and cysteine leading to lowering or complete removal of the blocker and hence blunting its effects. Alkylation of cysteine seems to require free thiol and amino groups, as N-acetyl-cysteine did not react with BEL. Lack of other amino acids investigated to react with BEL suggests a preference for thiol alkylation.
BEL consumption by supplemented cysteine and GSH is virtually quantitative and hence supports the abovementioned assumptions. Alkylation products of cysteine and GSH were detected in cells treated with BEL without supplementing the thiols. This provides clear evidence, that BEL depletes the cells from cysteine and GSH (and possibly other reactive thiols). Reduction of thiol content has been considered as a feature of the BMK product previouslyCitation27 but we here demonstrate BEL itself to be the active alkylating agent.
GSH depletion puts the cells on high oxidative stress, which also influences AA dynamics and prostaglandin synthesis. Thus, loss of GSH results in increased cPLA2-dependent release of AACitation47, and enhancement or attenuation of prostaglandin synthesisCitation48,Citation49. PGHS enzymes, in particulary PGHS-1, require hydroperoxide-dependent activation to become functional oxygenases, and the subsequent conversion of PGH2 to PGE2 is catalyzed by PGES in a GSH dependent mannerCitation50. Thus, besides inhibition of AA reacylation by BEL, GSH reduction by BEL might initially enhance PGE2 formation through oxidative stress, and later on, when GSH depletion becomes more pronounced, inhibit its formation by PGES.
Although, we could not detect a reaction product from CoA with BEL or BMK, its effect of lowering the inhibitor concentration in the incubation buffer is evident. Thus, alkylation of CoA might at least in part be responsible for the accumulation of free AA upon BEL addition. Additionally, NEM, a reagent that alkylates thiol compounds and causes GSH depletion, mimicks the effect of BEL on PGE2 formation. Quantitative differences between NEM and BEL are conceivable, as NEM readily reacts with all thiol compounds, including cysteine residues in proteins, explaining the inhibitory effect at higher concentrations to sub-basal levels. A more GSH-directed approach is attenuation of GSH biosynthesis by BSO, an inhibitor of GCLCitation51. Expectedly, AA-stimulated PGE2 production is enhanced by low GSH content due to hydroperoxide activation, quantitatively similar to NEM. The effect of BEL is drastically reduced after BSO pre-treatment, suggesting further removal of residual GSH by the agent.
Effect of BEL and BMK on PGHS-1 activity
Lack of PGHS-1 inhibition by BEL or BMK rules out a direct effect of these agents on the enzyme. Additionally, no irreversible modification of the enzyme could be detected. This supports the concept of GSH depletion to be the major cause of attenuated PGE2 formation with BMK or BEL at higher concentrations.
Conclusion
The data presented herein provide evidence for the expression and activity of both, iPLA2γ and iPLA2ß, in cells of the osteoblastic phenotype. Their inhibition with BEL results in an initial increase in PGE2 formation, followed by a decrease at higher BEL concentrations, an effect totally independent of iPLA2 inhibition. The initial increase is due to accumulation of AA and possibly hydroperoxide-activation of PGHS-1, a result of GSH depletion caused by BEL. The latter is also responsible for the decrease in PGE2 production at higher inhibitor concentrations, as PGES requires GSH for its activity. Thus, the widely used iPLA2 inhibitor BEL must be used with caution in a cellular environment, since all data obtained resemble conditions of extreme oxidative stress. Additionally, incubation media must be chosen carefully to assure correct blocker concentrations (no FCS, GSH, cysteine). Even at low concentrations BEL competes with intracellular GSH and specific iPLA2 binding sites, but due to the mechanism-based irreversible inhibition it can be still effective whereby GSH concentrations are not altered substantially.
Declaration of interest
The authors report no conflict of interests.
References
- Funk CD. Prostaglandins and leukotrienes: advances in eicosanoid biology. Science 2001;294:1871–5
- Moolenaar WH, van Meeteren LA, Giepmans BN. The ins and outs of lysophosphatidic acid signaling. Bioessays 2004;26:870–81
- Prescott SM, Zimmerman GA, Stafforini DM, McIntyre TM. Platelet-activating factor and related lipid mediators. Annu Rev Biochem 2000;69:419–45
- Schaloske RH, Dennis EA. The phospholipase A2 superfamily and its group numbering system. Biochim Biophys Acta 2006;1761:1246–59
- Six DA, Dennis EA. The expanding superfamily of phospholipase A(2) enzymes: classification and characterization. Biochim Biophys Acta 2000;1488:1–19
- Turk J, Ramanadham S. The expression and function of a group via calcium-independent phospholipase A2 (ipla2beta) in beta-cells. Can J Physiol Pharmacol 2004;82:824–32
- Balsinde J, Bianco ID, Ackermann EJ, et al. Inhibition of calcium-independent phospholipase A2 prevents arachidonic acid incorporation and phospholipid remodeling in p388d1 macrophages. Proc Natl Acad Sci USA 1995;92:8527–31
- Perez R, Melero R, Balboa MA, Balsinde J. Role of group via calcium-independent phospholipase A2 in arachidonic acid release, phospholipid fatty acid incorporation, and apoptosis in u937 cells responding to hydrogen peroxide. J Biol Chem 2004;279:40385–91
- Yellaturu CR, Rao GN. A requirement for calcium-independent phospholipase A2 in thrombin-induced arachidonic acid release and growth in vascular smooth muscle cells. J Biol Chem 2003;278:43831–7
- Moran JM, Buller RM, McHowat J, et al. Genetic and pharmacologic evidence that calcium-independent phospholipase a2beta regulates virus-induced inducible nitric-oxide synthase expression by macrophages. J Biol Chem 2005;280:28162–8
- Song K, Zhang X, Zhao C, et al. Inhibition of Ca2+-independent phospholipase A2 results in insufficient insulin secretion and impaired glucose tolerance. Mol Endocrinol 2005;19:504–15
- Smani T, Zakharov SI, Leno E, et al. Ca2+-independent phospholipase A2 is a novel determinant of store-operated Ca2+ entry. J Biol Chem 2003;278:11909–15
- Mancuso DJ, Jenkins CM, Gross RW. The genomic organization, complete mRNA sequence, cloning, and expression of a novel human intracellular membrane-associated calcium-independent phospholipase A(2). J Biol Chem 2000;275:9937–45
- Cummings BS, McHowat J, Schnellmann RG. Role of an endoplasmic reticulum Ca(2+)-independent phospholipase A(2) in oxidant-induced renal cell death. Am J Physiol Renal Physiol 2002;283:F492–8
- Tanaka H, Takeya R, Sumimoto H. A novel intracellular membrane-bound calcium-independent phospholipase A(2). Biochem Biophys Res Commun 2000;272:320–6
- Murakami M, Masuda S, Ueda-Semmyo K, et al. Group VIB Ca2+-independent phospholipase A2gamma promotes cellular membrane hydrolysis and prostaglandin production in a manner distinct from other intracellular phospholipases A2. J Biol Chem 2005;280:14028–41
- Kinsey GR, Blum JL, Covington MD, et al. Decreased iPLA2gamma expression induces lipid peroxidation and cell death and sensitizes cells to oxidant-induced apoptosis. J Lipid Res 2008;49:1477–87
- Saavedra G, Zhang W, Peterson B, Cummings BS. Differential roles for cytosolic and microsomal Ca2+-independent phospholipase A2 in cell growth and maintenance of phospholipids. J Pharmacol Exp Ther 2006;318:1211–19
- Jenkins CM, Han X, Mancuso DJ, Gross RW. Identification of calcium-independent phospholipase A2 (iPLA2) beta, and not iPLA2gamma, as the mediator of arginine vasopressin-induced arachidonic acid release in A-10 smooth muscle cells. Enantioselective mechanism-based discrimination of mammalian iPLA2s. J Biol Chem 2002;277:32807–14
- van Tienhoven M, Atkins J, Li Y, Glynn P. Human neuropathy target esterase catalyzes hydrolysis of membrane lipids. J Biol Chem 2002;277:20942–8
- Jenkins CM, Mancuso DJ, Yan W, et al. Identification, cloning, expression, and purification of three novel human calcium-independent phospholipase A2 family members possessing triacylglycerol lipase and acylglycerol transacylase activities. J Biol Chem 2004;279:48968–75
- Ackermann EJ, Conde-Frieboes K, Dennis EA. Inhibition of macrophage Ca(2+)-independent phospholipase A2 by bromoenol lactone and trifluoromethyl ketones. J Biol Chem 1995;270:445–50
- Daniels SB, Katzenellenbogen JA. Halo enol lactones: Studies on the mechanism of inactivation of alpha-chymotrypsin. Biochemistry 1986;25:1436–44
- Daniels SB, Cooney E, Sofia MJ, et al. Haloenol lactones. Potent enzyme-activated irreversible inhibitors for alpha-chymotrypsin. J Biol Chem 1983;258:15046–53
- Balsinde J, Dennis EA. Bromoenol lactone inhibits magnesium-dependent phosphatidate phosphohydrolase and blocks triacylglycerol biosynthesis in mouse p388d1 macrophages. J Biol Chem 1996;271:31937–41
- Zheng J, Mitchell AE, Jones AD, Hammock BD. Haloenol lactone is a new isozyme-selective and active site-directed inactivator of glutathione s-transferase. J Biol Chem 1996;271:20421–5
- Song H, Ramanadham S, Bao S, et al. A bromoenol lactone suicide substrate inactivates group via phospholipase A2 by generating a diffusible bromomethyl keto acid that alkylates cysteine thiols. Biochemistry 2006;45:1061–73
- Akiba S, Sato T. Cellular function of calcium-independent phospholipase A2. Biol Pharm Bull 2004;27:1174–8
- Kudo I, Murakami M. Phospholipase A2 enzymes. Prostaglandins Other Lipid Mediat 2002;6869:3–58
- Smith WL, DeWitt DL, Garavito RM. Cyclooxygenases: structural, cellular, and molecular biology. Annu Rev Biochem 2000;69:145–82
- Akiba S, Hayama M, Sato T. Inhibition of Ca2+-independent phospholipase A2 by bromoenol lactone attenuates prostaglandin generation induced by interleukin-1 beta and dibutyryl camp in rat mesangial cells. FEBS Lett 1998;437:225–8
- Murakami M, Kambe T, Shimbara S, Kudo I. Functional coupling between various phospholipase A2s and cyclooxygenases in immediate and delayed prostanoid biosynthetic pathways. J Biol Chem 1999;274:3103–15
- Wilkins WP III, Barbour SE. Group VI phospholipases A2: homeostatic phospholipases with significant potential as targets for novel therapeutics. Curr Drug Targets 2008;9:683–97
- Ramanadham S, Yarasheski KE, Silva MJ, et al. Age-related changes in bone morphology are accelerated in group VIA phospholipase A2 (iPLA2beta)-null mice. Am J Pathol 2008;172:868–81
- Bligh EG, Dyer WJ. A rapid method of total lipid extraction and purification. Can J Biochem Physiol 1959;37:911–17
- Ackermann EJ, Kempner ES, Dennis EA. Ca(2+)-independent cytosolic phospholipase A2 from macrophage-like P388D1 cells. Isolation and characterization. J Biol Chem 1994;269:9227–33
- Lio YC, Dennis EA. Interfacial activation, lysophospholipase and transacylase activity of group VI Ca2+-independent phospholipase A2. Biochim Biophys Acta 1998;1392:320–32
- CondeFrieboes K, Reynolds LJ, Lio YC, et al. Activated ketones as inhibitors of intracellular Ca2+-dependent and Ca2+-independent phospholipase A(2). J Am Chem Soc 1996;118:5519–25
- Leis HJ, Hohenester E, Gleispach H, et al. Measurement of prostaglandins, thromboxanes and hydroxy fatty acids by stable isotope dilution gas chromatography/mass spectrometry. Biomed Environ Mass Spectrom 1987;14:617–21
- Balsinde J, Balboa MA. Cellular regulation and proposed biological functions of group VIA calcium-independent phospholipase A2 in activated cells. Cell Signal 2005;17:1052–62
- Larsson Forsell PK, Kennedy BP, Claesson HE. The human calcium-independent phospholipase A2 gene multiple enzymes with distinct properties from a single gene. Eur J Biochem 1999;262:575–85
- Hsu YH, Burke JE, Li S, et al. Localizing the membrane binding region of group VIA Ca2+-independent phospholipase A2 using peptide amide hydrogen/deuterium exchange mass spectrometry. J Biol Chem 2009;284:23652–61
- Ma Z, Wang X, Nowatzke W, et al. Human pancreatic islets express mrna species encoding two distinct catalytically active isoforms of group vi phospholipase A2 (iPLA2) that arise from an exon-skipping mechanism of alternative splicing of the transcript from the iPLA2 gene on chromosome 22q13.1. J Biol Chem 1999;274:9607–16
- Lands WE. Metabolism of glycerolipides: a comparison of lecithin and triglyceride synthesis. J Biol Chem 1958;231:883–8
- Perez-Chacon G, Astudillo AM, Balgoma D, et al. Control of free arachidonic acid levels by phospholipases A2 and lysophospholipid acyltransferases. Biochim Biophys Acta 2009;1791:1103–13
- Pastore A, Massoud R, Motti C, et al. Fully automated assay for total homocysteine, cysteine, cysteinylglycine, glutathione, cysteamine, and 2-mercaptopropionylglycine in plasma and urine. Clin Chem 1998;44:825–32
- Kramer BC, Yabut JA, Cheong J, et al. Toxicity of glutathione depletion in mesencephalic cultures: a role for arachidonic acid and its lipoxygenase metabolites. Eur J Neurosci 2004;19:280–6
- Buckley BJ, Kent RS, Whorton AR. Regulation of endothelial cell prostaglandin synthesis by glutathione. J Biol Chem 1991;266:16659–66
- Rouzer CA, Scott WA, Griffith OW, et al. Arachidonic acid metabolism in glutathione-deficient macrophages. Proc Natl Acad Sci USA 1982;79:1621–5
- Smith WL, Urade Y, Jakobsson PJ. Enzymes of the cyclooxygenase pathways of prostanoid biosynthesis. Chem Rev 2011;111:5821–65
- Griffith OW, Meister A. Potent and specific inhibition of glutathione synthesis by buthionine sulfoximine (s-n-butyl homocysteine sulfoximine). J Biol Chem 1979;254:7558–60