
Abstract
Drug target interactions (DTIs) are crucial in pharmacology and drug discovery. Presently, experimental determination of compound–protein interactions remains challenging because of funding investment and difficulties of purifying proteins. In this study, we proposed two in silico models based on support vector machine (SVM) and random forest (RF), using 1589 molecular descriptors and 1080 protein descriptors in 9948 ligand–protein pairs to predict DTIs that were quantified by Ki values. The cross-validation coefficient of determination of 0.6079 for SVM and 0.6267 for RF were obtained, respectively. In addition, the two-dimensional (2D) autocorrelation, topological charge indices and three-dimensional (3D)-MoRSE descriptors of compounds, the autocorrelation descriptors and the amphiphilic pseudo-amino acid composition of protein are found most important for Ki predictions. These models provide a new opportunity for the prediction of ligand–receptor interactions that will facilitate the target discovery and toxicity evaluation in drug development.
Introduction
The interactions of proteins and targets can regulate several functions of pharmaceutically useful protein targets which include enzymes, ion channels, G protein-coupled receptors (GPCRs) and nuclear receptorsCitation1,Citation2. These drug target interactions (DTIs) are meaningful to explain biological activities of these proteins. Indeed, some small chemical binders target to multiple proteins and sometimes unfortunately bind to unwanted off-targetsCitation3. Such unwanted DTIs could be severe and cause harmful side effects. Therefore, identifying suitable targets is a leading urgency in recent drug discoveryCitation4. Although several methods, such as fluorescence assays, are implementable, the experimental determination of compound–protein interactions remains challenging because of funding investment and difficulties in purifying proteins even nowadays. Thus, the prediction of DTIs based on the structure of drugs and/or their potential targets is crucial for medicinal chemistryCitation5.
Computational approaches are reliable and preferable for identifying the drug–target interactionCitation4 and have provided more than 50% food and drug administration (FDA)-approved drugs targeting to membranous proteins (GPCRs), nuclear receptors and transporters proteinsCitation6. Presently, computational methodologies for DTI prediction are divided into two categories, ligand-based and receptor-based approachesCitation7. Among ligand-based methods, we can cite quantitative structure–activity relationships (QSAR) and a similarity search-based approach are most reported and used widelyCitation1. On the other hand, receptor-based methods, such as reverse docking, have also been applied in drug–target-binding affinity prediction, DTI prediction and drug repositioningCitation3,Citation7. In docking method, the structures are evaluated on the basis of a force field or a scoring functionCitation8. It predicts the preferred conformations and binding strength of a ligand molecule, typically a small organic molecule, as bound to a protein pocketCitation9. Docking provides a reasonable accuracy in predicting DTI when 3D structure of protein and large quantities of data are presentCitation10. Although there are some limitations, it is not accurate when those proteins whose 3D structures are unknown, especially for membranous proteins whose 3D structure is difficult to be crystallizedCitation11,Citation12. Although homologous modeling provides predicted 3D structures, but it is limited by availability of homologous templatesCitation13.
A drug's ability to affect a given protein target is related to the drug-target affinity which is basically determined by the chemical and protein structureCitation14. Ki value, representing protein–ligand binding affinity, is the inhibition constant for a drug to bind a targeted protein under a certain experimental conditionCitation15. For instance, drug binding to a receptor with high Ki level implies low-binding affinity, and vice versa for low Ki. Proteochemometric modeling, based on chemical descriptors (features of the ligand) in combination with particular protein descriptors (features of the target), has been successfully applied for studying bioactivity of moleculesCitation16. Inspired by these successes, we proposed fast predicting models by integrating molecular descriptors, protein descriptors with two powerful statistical methods support vector machine (SVM) and random forest (RF). The models consisted of internal cross-validation and external tests, which provides a reliable performance with high accuracy. Consequently, the new computational methods for binding-affinity prediction of protein-ligand interaction will provide a compelling opportunity to drug target discovery.
Methods
Dataset
The ligand and target dataset information with known binding affinity was collected from Psychoactive Drug Screening Program (PDSP)Citation17 Ki database (http://pdsp.med.unc.edu/kidb.php, as of 1 October 2014), which is a unique resource in the public domain and provides information on the abilities of drugs to interact with an expanding number of molecular targets. In the process of building dataset, some drugs and targets were removed due to their chemical descriptors could not be evaluated. Besides, after analyzing the original Ki values, we found that there are hundreds of same Ki values in the database, such as 1000 nM and 10 000 nM, which are potential censored data. These repeat Ki values may strongly affect the accuracy of the following modeling. So we excluded the ligand-target-Ki entries with the repeats number of Ki more than 70. This threshold was selected according to the following two criteria: (1) maintain entries as many as possible; (2) exclude the censored data as many as possible. Consequently, a dataset which is consisted of 9948 ligand-target-Ki pairs was constructed. There are 2003 ligands and 209 targets without redundancy in this dataset, which were used as a benchmark dataset.
Computation of molecular and protein descriptors
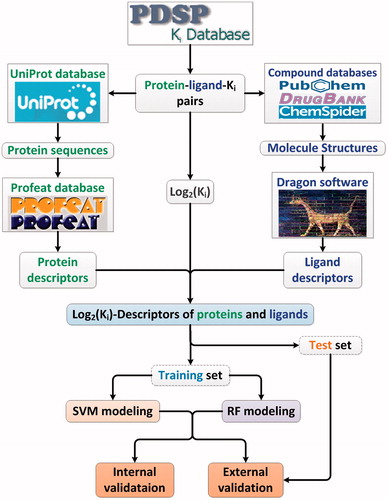
The ligand structures were collected from PubChemCitation18, DrugBankCitation19 and ChemSpider databasesCitation20. The protein sequences were collected from Uniprot databaseCitation21. To describe the structural and physiochemical features of a molecule, the molecular descriptors were calculated by DRAGON program 5.4 () (http://www.talete.mi.it/index.htm)Citation22. The Dragon software implements about more than 20 molecular descriptors categories (topological descriptors, constitutional descriptors, 2D autocorrelations, topological charge indices, eigenvalue-based indices, molecular properties, etc.), while 75 descriptors, such as nArCSOH, nRCSSH, nN = N and nSOOH, were eliminated, as these descriptors are constant values for all drugs. Eventually, 1589 descriptors were used for subsequent analysis (Supplementary Table S1). Similarly, to describe the amino acid sequence features of a protein, the protein sequence descriptors like peptide composition, dipeptide composition, autocorrelation descriptors, etc., were calculated using PROFEAT web serverCitation23. In total, for each protein, we obtained 1080 protein descriptors for following analysis (Supplementary Table S2).
Figure 1. The flowchart of the proposed method for predicting binding affinity.
Construction of training set and test set
To provide a more rigorous evaluation of a model's predictive capability, the dataset was split into training (used to build the model) and test (used to validate the model's accuracy) sets. Furthermore, the aforementioned dataset was randomly and equally split into five subsets, and one subset was selected as the test set, while others were selected as the training set. Besides, in this study, all descriptors data were prescaled to the range from −1 to 1, while the Ki data were transformed to log2(Ki) for modeling.
Support vector machine
Support vector machine (SVM) is one of the state-of-the-art algorithms and has been extensively used for regression (SVR) and classification (SVC). When using SVM in regression tasks, the support vector regressor uses a cost function to measure the empirical risk in order to minimize the regression errorCitation24. In this work, this method has been applied to estimate the nonlinear relationships between the Ki values of ligand–protein pairs and their related descriptors. Briefly, given training samples where xi denotes the ith input vector; yi indicates the ith output value and n is the total number of samples. The modeling aim is to provide a regression function y = f(x) that predict outputs yj as less error as much by using a new set of input vector xj. Mathematically, an SVM regressor is produced as following:
(1)
where αi and
are Lagrange multipliers, which have been obtained by minimizing the regularized cost function, while, the kernel function K(x, xi) was the radial basis function (RBF) which has the highest performance:
(2)
or
(3)
There are two parameters associated with RBF kernels: regularization parameter C and the kernel parameter γ. Improper selection of these two parameters can cause overfitting or under fitting problems. Therefore, parameter C and γ play a crucial role in the performance of SVMCitation25. Here, the selection of C and γ were based on the overall accuracy of the internal fivefold cross-validation using the grid search methodCitation26. In this study, we used a portion of the codes from the LIBSVM suite of programs, which employs a modified version of the sequential minimal optimization (SMO) algorithmCitation27.
Random forest
Random forest (RF) is considered to be one of the most successful ensemble methods which is fast, robust to noise, does not overfit but provides possibilities for explanation and visualization of its outputCitation28. In this study, RF was applied as a regression method by constructing a multitude of decision trees at training time and outputting the mean prediction of the individual trees. The procedure can be briefly summarized as follows: suppose the number of training cases were N, and the total number of descriptors in the regressor were M. (I) Make n bootstrap sample sets from the original sample set. (II) Set up an unpruned tree
with each sample set Bp. At each node of the tree, randomly choose mtry descriptors on which to make the decision at that node, and then calculate the best splits based on these mtry descriptors. (III) Output the mean prediction of the individual trees. During the training process, importantly, RF applies a built-in cross validation to estimate test set error via the use of out-of-bag (OOB) samples that are the data not in the bootstrap sample.
In this work, we built RF models using Random Forest soft package which is developed by Leo Breiman et al (available at http://www.stat.berkeley.edu/users/breiman/). As the out-of-bag (OOB) error is used to get the estimates of feature importance, the feature selection is not quite necessary in building the RF modelsCitation27,Citation28. Here, the number of trees and number of randomly selected descriptors, two tuning parameters in RF, were set to 500 and M/3, respectively.
Model validation
In order to wholly evaluate the performance of these in silico models, the internal and external validation were performed. Briefly, (1) the dataset was randomly and equally split into five subsets as mentioned previously, and four subsets were selected as training set for modeling, while remaining subset serves as test set for validating models. This process was repeated five times until every subset served as test set. (2) Five external independent validations were carried out for all models using different test sets. (3) The performance of RF model was compared with of SVM model using F test.
(4)
Here, n1 and n2 are the number of samples in the test sets of two compared models, MSE1 is the higher mean square error while MSE2 is lower mean square error. The MSEs were defined as follows:
(5)
where yi is the ith experimental log2 (Ki) value,
denotes ith predicted log2 (Ki) value, n is the total number of samples in the test sets.
Results
Support vector machines
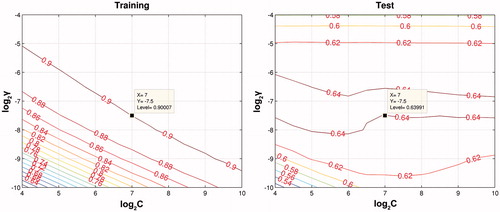
We adopted Gaussian radial basis function as kernel function for SVM to perform prediction. To provide the highest predicting performance, we optimized two parameters, that is, the penalty parameter C and the Gaussian function parameter γ using the grid search method. As shown in , the optimal pair of (C, γ) is found at the crimson zone which have C = 27 and γ = 2 − 7.5, respectively. Using these parameters, we run the SVM models and make prediction to training set and test set ().
Figure 2. Grid search ranging from C = 24 to 210 and γ = 2−10 to 2−4. The optimal prediction was obtained at the point of log2C = 7 and log2γ = −7.5.
For training and test sets, the cross-validation coefficient of determination (R2) was 0.8596 ± 0.0043 and 0.6079 ± 0.0117, respectively. The mean squared error (MSE) for the training and test sets were 2.4591 ± 0.0729 and 7.0487 ± 0.2619, respectively (). No obvious overfitting can be observed from these models. The predicted values fall close to the experimental log2 (Ki) values (). This good agreement between experimental and predicted log2 (Ki) values for the test set compounds in the SVM model suggests that this model is reliable and can be applied for binding affinity prediction of certain protein and ligand.
Figure 3. Experimental versus RF predicted log2 (Ki) values for training set (blue) and test set (red), the blue line is the fitted curve for training set. (For interpretation of the references to color in this figure, the reader is referred to the web version of this article.).
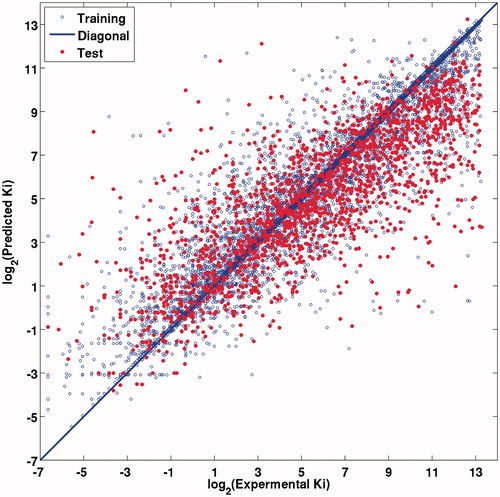
Table 1. Fivefold cross validation of SVM and RF for log2 (Ki) prediction of ligand target.
Random forest
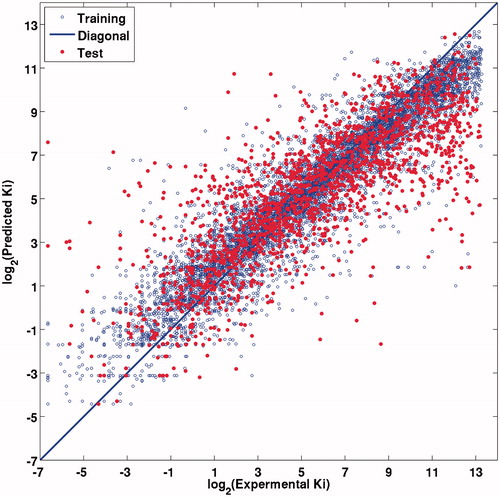
In this investigation, attempts have been made to predict the Ki values by RF algorithm. In order to build reliable models, all protein descriptors and ligand descriptors were used as features to build the model and both the training and test sets, which were also constructed. Two adjustable parameters in RF, the number of trees and the number of randomly selected features, were set to 500 and M/3, respectively, according to the defaults. The results obtained by the RF were shown R2 of 0.8802 ± 0.0025, MSE of 2.2855 ± 0.0465 for the internal validation and R2 of 0.6267 ± 0.0238, MSE 6.5828 ± 0.4075 for the external validation, respectively (). The MSE of the external validation is the same order of magnitude as the MSE of the external validation, which indicates that there is no obvious overfitting problem existing in this model. It can be clearly concluded that the present RF model exhibits satisfactory predictability from both the internal and external points of view with respect to the prediction of the test sets ().
Figure 4. Experimental versus RF predicted log2 (Ki) values for training set (blue) and test set (red), the blue line is the fitted curve for training set. (For interpretation of the references to color in this figure, the reader is referred to the web version of this article.).
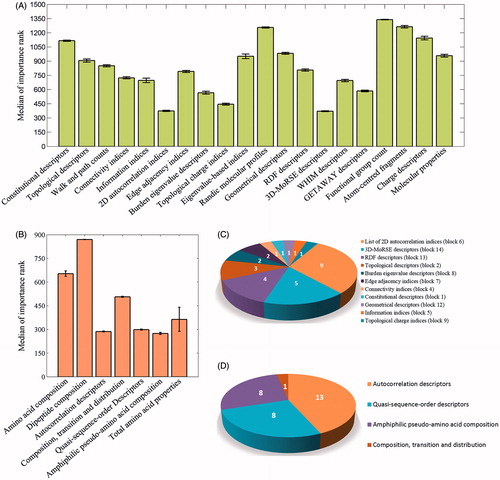
Additionally, one of the most significant functions of RF is providing possibilities for the explanation of its output for the accessible variable importance. An analysis of the underlying information of the most important descriptors extracted by the RF algorithm allows further conclusions to be drawn. By mapping the descriptors to the block (for compound) or group (for protein) where they belong to, we found a significant difference among the blocks and groups of descriptor ranks (one-way ANOVA, p < 0.001). Such as the blocks of 2D autocorrelation, topological charge indices and 3D-MoRSE descriptors for compound and the group of autocorrelation descriptors and the amphiphilic pseudoamino acid composition for protein are most important to Ki prediction (). On the basis of the variable importance outputs of RF model, the top 30 chemical descriptors and 30 protein descriptors were picked out for examples. The top 30 chemical descriptors mainly come from four blocks, including the 2D autocorrelation indices, 3D-MoRSE descriptors, RDF descriptors and topological descriptors (, Supplementary Table S3), and the top 30 protein descriptors were mainly from three groups, that is, autocorrelation descriptors, quasi-sequence-order descriptors and amphiphilic pseudoamino acid composition (, Supplementary Table S4), which are corresponding to the overall importance ().
Figure 5. The relative importance of descriptors: (A) the median of importance order of chemical descriptor blocks base on five-fold cross validation, (B) the median of importance order of protein descriptor groups base on fivefold cross validation, (C) the blocks of top 30 chemical descriptors in a RF model, (D) the blocks of top 30 protein descriptors in a RF model.
The chemical and protein descriptors employed in these statistical models may give some insights into the affinity of a ligand binding to a specific protein target. For example, about compound descriptor blocks, the 3D-MoRSE descriptors, such as Mor03p, Mor03v, Mor31p, Mor31v and Mor14m, are the descriptors characterizing the molecular size and 3D information, which are clearly important for the affinity of a ligand binding with the targetCitation29. The 2D autocorrelation, such as GATS1v, GATS1m, GATS1p, MATS7e, MATS6p, etc., describes how a considered property is distributed along a topological molecular structure, which have been reported a robust model for inhibitory activity toward p34cdc2/cyclin b kinase enzyme of cytokinin-derived compoundCitation30,Citation31. As for the protein descriptor groups, amphiphilic pseudoamino acid composition were depicted by hydrophobicity and hydrophilicity of the constituent amino acids, which plays a pivotal role in protein foldingCitation32. And autocorrelation descriptors are defined based on the distribution of amino acid properties along the protein sequence, which can be used to test whether the value of a property at one residue is independent of the values of the property at neighboring residuesCitation31.
Discussion
The molecular information encoding into molecular descriptors is the first step into in silico chemoinformatics methods in drug design. There are a range of publications with prediction models for specific drug biological activity, drug toxicity, protein target interactionCitation33. Some studies developed models based on Shannon entropy measures and encompassing a multitarget network to predict multitarget drugs. For example, Riera–Fernandez et al. reported a new method based on the Markov–Shannon entropy to evaluate connectivity quality in complex networks, which show overall accuracy of 76.3% and can be applied for molecular and biomedical science and compound–protein bindingCitation34,Citation35. Many different computational chemistry, cheminformatics, bioinformatics and systems biology methods were applied to predict drug activities. LuanCitation36, AlonsoCitation37, Prado-PradoCitation38,Citation39 and coauthors developed multitarget/multiplexing quantitative structure–property relationships models for multiplexing assays of neurotoxicity/neuroprotective effects of drugs. These models are based on based on two different well-known software MARCH-INSIDE and DRAGON and show accuracy, specificity as well as sensitivity above 80–90%. Also, entropy methods are universal parameters useful to codify biologically relevant information in many systems. Tenorio-Borroto et al. trained and validated for the first time a quantitative structure–toxicity relationships model that correctly classified 91.1% multiplexing assay endpoints of 7903 drugsCitation40. All of these works focused on classification problems. If using classifier to predict the DTIs, the accuracy can be influenced by the criteria of classification. Besides, for different proteins, the definition of successful binding may vary. Fortunately, regression models, predicting the discrete rather than binary outcomes according to experimental data, are able to address these problems.
The quality of a QSAR model depends heavily on many factors, including particularly the representation of the object features, features selection and the application of the statistical approaches.Citation41 By mapping input variables into a high-dimensional feature space, SVM transforms complex problems into simpler problems to solve, which has been successfully applied in drug targeting, QSAR, artificial intelligence, financial domain, etcCitation2,42–46. Combining bagging strategy and decision tree theory, RF sometimes performs very well compared to many other methods, including support vector machines and neural networks and is robust against overfittingCitation25,Citation47. In this work, the object features were represented by compound and protein descriptors, and all descriptors were selected to build models except several descriptors which cannot be calculated. For statistical approach, Ki values were predicted by employing two state-of-art regression models including SVM and RF. Accordingly, as the difference among the performance could be found (), we applied the F-test to quantify the difference between these two modelsCitation44. Although the R2 of RF seems to be higher than that of SVM for test sets, the F value (1.071) shows that it is not significant (p > 0.05), which suggests that the RF model and SVM model have a similar performance to predict Ki, at least for this dataset.
In this work, all the programs were implemented on a Huawei computer (Debian GNU/Linux 8.1 (jessie), two Intel® Xeon® processors X5650 (2.67 GHz) and 24 GB RAM). The total execution time of the fivefold cross-validation experiment of SVM (22 h, including 20 h for parameters optimization) is longer than that of the RF approach (15 h, without parameters optimization because of default setting). Therefore, RF is much more efficient than SVM for this study if including the optimization procedure. In addition to the robust and efficient features, an ideal regression model would be also interpretable. An important point is that SVM generates black box models that do not have the ability to explain, in an understandable form, the process of how the output was generatedCitation48. While RF provided the relative importance of variables, it should be useful for guiding the computer-aided drug design and assessing drug potential prior to synthesis.
Conclusions
In this study, we applied SVM and RF for binding affinity prediction problem based on a large scale data set, which generated two models with an attractive prediction power. The statistical results depicted as R2 = 0.6079 and MSE = 7.0487 using SVM, R2 = 0.6267 and MSE = 6.5828 using RF for the test set, which indicates that both models provide a potent Ki predictability without overfitting. To test which model is more reliable, we applied F test to compare the performance of RF and SVM. And it was found that they had similar prediction performance. Further, by deep analyzing on the importance of descriptors provided by RF model, we discovered that 2D autocorrelation, topological charge indices and 3D-MoRSE descriptors for compound, and amphiphilic pseudoamino acid composition, autocorrelation descriptors and quasi-sequence-order descriptors for protein are most important to Ki prediction. This adopted models and included above information will be helpful for screening and prediction of novel potent target inhibitors, and for further researches on the subject matter.
Supplementary material available online
IENZ_1144594_Supplementray_Information.zip
Download Zip (52.1 KB)Declaration of interest
The authors declared that they have no competing interests. The research is supported by the Fund of Northwest A & F University and is financially supported by the National Natural Science Foundation of China (Grant No. 31170796 and 81373892).
Related Research Data
References
- Yamanishi Y, Kotera M, Kanehisa M, et al Drug-target interaction prediction from chemical, genomic and pharmacological data in an integrated framework. Bioinformatics 2010;26:i246–54
- Li S, Xi L, Wang C, et al A novel method for protein-ligand binding affinity prediction and the related descriptors exploration. J Comput Chem 2009;30:900–9
- Wang K, Sun J, Zhou S, et al Prediction of drug-target interactions for drug repositioning only based on genomic expression similarity. PLoS Comput Biol 2013;9:e1003315
- Gilson MK, Zhou HX. Calculation of protein-ligand binding affinities. Annu Rev Biophys Biomol Struct 2007;36:21–42
- Gonzalez-Diaz H. Computational prediction of drug-target interactions in medicinal chemistry. Curr Top Med Chem 2013;13:1619–21
- Shim J, Mackerell AD. Jr. Computational ligand-based rational design: role of conformational sampling and force fields in model development. Med Chem Comm 2011;2:356–70
- Alaimo S, Pulvirenti A, Giugno R, et al Drug-target interaction prediction through domain-tuned network-based inference. Bioinformatics 2013;29:2004–8
- Imai T, Hiraoka R, Seto T, et al Three-dimensional distribution function theory for the prediction of protein-ligand binding sites and affinities: application to the binding of noble gases to hen egg-white lysozyme in aqueous solution. J Phys Chem B 2007;111:11585–91
- Li H, Leung KS, Wong MH, et al Improving AutoDock Vina using random forest: the growing accuracy of binding affinity prediction by the effective exploitation of larger data sets. Mol Inf 2015;34:115–26
- Nagamine N, Sakakibara Y. Statistical prediction of protein chemical interactions based on chemical structure and mass spectrometry data. Bioinformatics 2007;23:2004–12
- Yamanishi Y, Araki M, Gutteridge A, et al Prediction of drug-target interaction networks from the integration of chemical and genomic spaces. Bioinformatics 2008;24:i232–40
- Koehler Leman J, Ulmschneider MB, Gray JJ. Computational modeling of membrane proteins. Proteins 2015;83:1–24
- Bordoli L, Kiefer F, Arnold K, et al Protein structure homology modeling using SWISS-MODEL workspace. Nat Protoc 2009;4:1–13
- Galdeano C, Gadd MS, Soares P, et al Structure-guided design and optimization of small molecules targeting the protein-protein interaction between the von Hippel-Lindau (VHL) E3 ubiquitin ligase and the hypoxia inducible factor (HIF) alpha subunit with in vitro nanomolar affinities. J Med Chem 2014;57:8657–63
- Cao DS, Liang YZ, Deng Z, et al Genome-scale screening of drug-target associations relevant to Ki using a chemogenomics approach. PLoS One 2013;8:e57680
- Van Westen GJ, Swier RF, Cortes-Ciriano I, et al Benchmarking of protein descriptor sets in proteochemometric modeling (part 2): modeling performance of 13 amino acid descriptor sets. J Cheminform 2013;5:42
- Roth BL, Lopez E, Patel S, et al The multiplicity of serotonin receptors: uselessly diverse molecules or an embarrassment of riches? Neuroscientist 2000;6:252–62
- Wang Y, Xiao J, Suzek TO, et al PubChem: a public information system for analyzing bioactivities of small molecules. Nucleic Acids Res 2009;37:W623–33
- Law V, Knox C, Djoumbou Y, et al DrugBank 4.0: shedding new light on drug metabolism. Nucleic Acids Res 2014;42:D1091–7
- Pence HE, Williams A. ChemSpider: an online chemical information resource. J Chem Edu 2010;87:1123–4
- Consortium U. Update on activities at the universal protein resource (UniProt) in 2013. Nucleic Acids Res 2013;41:D43–D7
- Talete SRL. DRAGON For Windows (Software for Molecular Descriptor Calculations). version. 5.4, Milano, Italy; 2006. Available from: http://www.talete.mi.it
- Li ZR, Lin HH, Han LY, et al PROFEAT: a web server for computing structural and physicochemical features of proteins and peptides from amino acid sequence. Nucleic Acids Res 2006;34:W32–7
- Basak D, Pal S, Patranabis DC. Support vector regression. Neu InfPro - Lett Rev 2007;11:203–24
- Meyer D, Leisch F, Hornik K. The support vector machine under test. Neurocomputing 2003;55:169–86
- Lin SW, Ying KC, Chen SC, et al Particle swarm optimization for parameter determination and feature selection of support vector machines. Expert Syst Appl 2008;35:1817–24
- Platt J. Sequential minimal optimization: a fast algorithm for training support vector machines. Technical Report MSR-TR-98-14. Microsoft Res; 1998
- Robnik-Šikonja M. Improving random forests, Machine Learning: ECML 2004, Heidelberg, Berlin: Springer; 2004: 359–70
- Quillin ML, Breyer WA, Griswold IJ, et al Size versus polarizability in protein-ligand interactions: binding of noble gases within engineered cavities in phage T4 lysozyme. J Mol Biol 2000;302:955–77
- Gonzalez MP, Caballero J, Helguera AM, et al 2D autocorrelation modelling of the inhibitory activity of cytokinin-derived cyclin-dependent kinase inhibitors. Bull Math Biol 2006;68:735–51
- Caballero J, Fernandez L, Abreu JI, et al Amino acid sequence autocorrelation vectors and ensembles of Bayesian-regularized genetic neural networks for prediction of conformational stability of human lysozyme mutants. J Chem Inf Model 2006;46:1255–68
- Chou KC. Using amphiphilic pseudo amino acid composition to predict enzyme subfamily classes. Bioinformatics 2005;21:10–19
- Munteanu CR, Gonzalez-Diaz H, Garcia R, et al Bio-AIMS collection of chemoinformatics web tools based on molecular graph information and artificial intelligence models. Comb Chem High Throughput Screen 2015;18:735–50
- Romero Duran FJ, Alonso N, Caamano O, et al Prediction of multi-target networks of neuroprotective compounds with entropy indices and synthesis, assay, and theoretical study of new asymmetric 1,2-rasagiline carbamates. Int J Mol 2014;15:17035–64
- Riera-Fernandez P, Munteanu CR, Escobar M, et al New Markov-Shannon entropy models to assess connectivity quality in complex networks: from molecular to cellular pathway, parasite-host, neural, industry, and legal-social networks. J Theor Biol 2012;293:174–88
- Luan F, Cordeiro MN, Alonso N, et al TOPS-MODE model of multiplexing neuroprotective effects of drugs and experimental-theoretic study of new 1,3-rasagiline derivatives potentially useful in neurodegenerative diseases. Bioorg Med Chem 2013;21:1870–9
- Alonso N, Caamano O, Romero-Duran FJ, et al Model for high-throughput screening of multitarget drugs in chemical neurosciences: synthesis, assay, and theoretic study of rasagiline carbamates. ACS Chem Neurosci 2013;4:1393–403
- Prado-Prado F, García-Mera X, Escobar M, et al 2D MI-DRAGON: a new predictor for protein–ligands interactions and theoretic-experimental studies of US FDA drug-target network, oxoisoaporphine inhibitors for MAO-A and human parasite proteins. Eur J Med Chem 2011;46:5838–51
- Prado-Prado F, García-Mera X, Alonso N, et al MI-DRA 3D: new model for reconstruction of US FDA drug-target network and theoretic-experimental studies of rasagiline derivatives inhibitors of AChE. ECSOC-16th International Electronic Conference on Synthetic Organic Chemistry. Spain: University of Santiago de Compostela; 2012
- Tenorio-Borroto E, Garcia-Mera X, Penuelas-Rivas CG, et al Entropy model for multiplex drug-target interaction endpoints of drug immunotoxicity. Curr Top Med Chem 2013;13:1636–49
- Wang Y, Li Y, Ding J, et al Prediction of binding affinity for estrogen receptor alpha modulators using statistical learning approaches. Mol Divers 2008;12:93–102
- Zhou W, Huang C, Li Y, et al A systematic identification of multiple toxin-target interactions based on chemical, genomic and toxicological data. Toxicology 2013;304:173–84
- Yu H, Chen J, Xu X, et al A systematic prediction of multiple drug-target interactions from chemical, genomic, and pharmacological data. PLoS One 2012;7:e37608
- Xu X, Zhang W, Huang C, et al A novel chemometric method for the prediction of human oral bioavailability. Int J Mol Sci 2012;13:6964–82
- Wang W-C, Chau K-W, Cheng C-T, et al A comparison of performance of several artificial intelligence methods for forecasting monthly discharge time series. J Hydrol 2009;374:294–306
- Min JH, Lee Y-C. Bankruptcy prediction using support vector machine with optimal choice of kernel function parameters. Expert Syst Appl 2005;28:603–14
- Li Y, Wang Y, Ding J, et al In silico prediction of androgenic and nonandrogenic compounds using random forest. QSAR Comb Sci 2009;28:396–405
- Han L, Luo S, Yu J, et al Rule extraction from support vector machines using ensemble learning approach: an application for diagnosis of diabetes. IEEE J Biomed Health Inform 2015;19:728–34