
Abstract
Isothermal titration calorimetry (ITC) has an increasing significance in enzyme kinetic studies owing to its general applicability and sensitivity. In the present work, we aimed at developing a simple ITC-based screening procedure for the measurement of human salivary α-amylase (HSA) activity. Reaction of two substrates was studied with three independent methods (ITC, HPLC and spectrophotometry). ITC experiments were made using free and chromophore-containing maltooligomers of different length as substrates. Detailed studies revealed that maltoheptaose or longer oligomers could model properly starch and the presence of aromatic chromophore group did not affect the KM values considerably. It is the first time, when ITC was used to investigate of HSA-catalysed hydrolysis of different substrates (2-chloro-4-nitrophenyl-4-O-α-D-galactopyranosyl-maltoside, maltoheptaose and starch) in the presence of acarbose inhibitor. All measured IC50 values are in micromolar range (0.9, 18.6 and 29.0 μM, respectively) and increased in parallel with the degree of polymerisation of substrates.
Introduction
Isothermal titration calorimetry (ITC) is a routinely used technique in research to study molecular interactions. Under optimal conditions, most of the thermodynamic reaction parameters can be determined by ITC, namely the binding constant (Ka), the enthalpy change (ΔH), the stoichiometry of the reaction (n) and further computable parameters, like the entropy change (ΔS) and Gibbs-free energy (ΔG)Citation1.
Methods for determination of binding constants or inhibition constants by ITC have already been published for many different enzymesCitation2–4, but in some cases, the low energy change arising from enzyme–inhibitor interaction can limit these measurements. The other application area where ITC is gaining ground is the determination of kinetic constants of enzyme–substrate reactions through measuring the heat change, which is directly proportional to the reaction rate. For this purpose two types of methods are available in the literature, the single- and the multiple injection methodsCitation5–7. In the single injection method, a higher proportion of the reactant is injected into the sample cell where the total transformation of substrate occurs. In contrast, in multiple injection method, which is more popular for determination of kinetic parameters of enzymes, a diluted enzyme solution is titrated sequentially with small aliquots of concentrated substrate solution. Therefore, the measured heat change is characteristic to the actual substrate concentration in cell, while only a small part of the substrate is convertedCitation8. In these measurements, the steady-state phase of the thermogram is where y data become constant (see in Results and discussion). EquationEquation (1)(1) shows the generally used formula in reaction rate (v) calculation,
(1)
where ΔP is the product concentration, V is the sample cell volume, ΔH is the total molar enthalpy and ΔQ/Δt is the power of the reaction generated at different substrate concentrationsCitation8. Since (V × ΔH)−1 is a constant, thus conducting the reaction with the same system (instrument, enzyme, substrate, concentrations) this part of the formula has no effect on the obtained KM value.
Though numerous papers have already been published on enzyme kinetic measurements using microcalorimetry, only a few very recent articles have dealt with inhibition studiesCitation9,Citation10. In some cases, product or substrate inhibitions have been studiedCitation5,Citation11,Citation12, but ITC has scarcely been applied to determine half maximal inhibitory concentration (IC50).
Family of alpha-amylases (EC.3.2.1.1) acting on the α(1,4) glycosidic bond between glucose units of starch, is one of the most investigated group of glycoside hydrolases due to its broad medical and industrial importanceCitation13. The central motif of the enzyme is an (α/β)8 TIM-barrel and the catalytic amino acids (Asp, Glu) are situated on the C-terminal side. The binding of the natural starch substrate occurs in the trench-like substrate binding site with the positioning role of the carbohydrate binding module. Hydrolysis occurs via overall retention of the anomeric configuration with participation of amino-acid residues acting as a nucleophile and as a proton donorCitation14.
Human α-amylases, both salivary (HSA) and pancreatic (HPA), have been thoroughly studied for clinical purposes because they are targets of drug design in attempts to treat diabetes, obesity, hyperlipidaemia and dental caries. A number of amylase inhibitors have been described and some of them have been introduced into obesity and diabetes therapyCitation15. However, the comparison of IC50 values is problematic due to the different substrates and methods used for measurements. The methods to determine amylase activity are often inconvenient and do not model properly the operation of the enzyme in vivo due to the poorly defined substrates or reaction conditions usedCitation16. StarchCitation17, modified starchCitation18, shorter or longer maltooligomersCitation19 and maltooligomer derivatives with fluorophoreCitation20 or with chromophore, i.e. 2-chloro-4-nitrophenyl-4-O-α-D-galactopyranosyl-maltoside (GalG2-CNP)Citation21, 2-chloro-4-nitrophenyl-β-D-maltotrioside (CNP-G3)Citation22, 2-chloro-4-nitrophenyl-β-D-maltoheptaoside (CNP-G7)Citation14, are used as substrates in amylase assays. Methods for amylase activity measurements using starch as substrate generally utilise different reducing sugar assays, e.g. 3,5-dinitrosalicylic acid (DNS) assayCitation23, which similarly to other starch-based methods like starch azureCitation24 and Lugol methodCitation25, provide coloured products to the spectrophotometric detection. Amylase kits for diagnostic purposes use chromophore-containing substrates (occasionally with protecting groupCitation26) in coupled assays, when the liberation of chromophore is measured also with spectrophotometerCitation27. The question is whether these modified substrates model properly the natural substrate (starch) or the aromatic group influences the binding, hydrolysis or inhibition mechanisms.
The present study illustrates how the best substrate(s) can be chosen for determination of enzyme activity using a fast and simple ITC-based screening technique. For this purpose, human salivary α-amylase enzyme and maltooligomer substrates were selected as a model system. The study investigates which maltooligomer substrate shows kinetics similar to starch and how the chromophore group alters substrate binding. In addition, ITC was applied for determination of the IC50 values using natural and synthetic substrates and acarbose as a well-known amylase inhibitor.
Materials and methods
Reagents
α-Amylase (EC 3.2.1.1) from human saliva (Type IXa), free maltooligomers (), starch, and all buffer components were purchased from Sigma-Aldrich (St. Louis, MO). The lyophilised amylase powder contained significant amount of salt, therefore it was extensively dialysed with Amicon 30K filter device (Millipore, MA) to avoid the dilution heat effect during measurements. The concentration of the enzyme stock solution was defined with the Bradford methodCitation28. GalG2CNP was purchased from SORACHIM SA (Lausanne, Switzerland). CNP-β-maltooligomer glycosides () were synthesised from cyclodextrins according to a method published earlierCitation29. Acarbose was extracted with water from Glucobay® tablet (Bayer, Leverkusen, Germany) and used after freeze-drying.
Figure 1. Structure of substrates (n ≥ 1). R represents H in free maltooligomers or 2-chloro-4-nitrophenyl group in chromophore-containing substrates. The orientation of the hydroxyl group on the fourth carbon of the first pyranose ring is equatorial in GalG2CNP and axial in the maltooligomers.
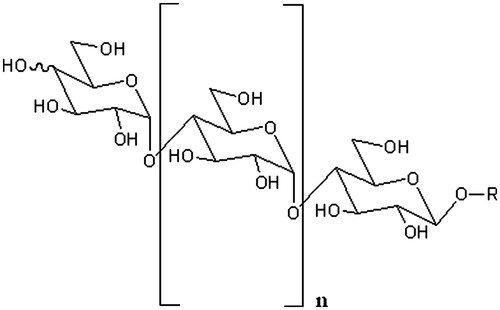
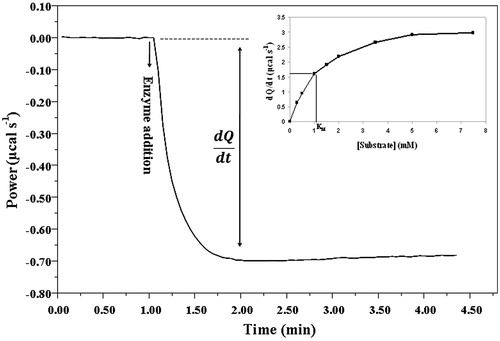
Figure 2. Thermogram of the HSA-catalysed (5 nM) maltoheptaose (6 mM) hydrolysis. The amplitude of the curve after injection of the enzyme was considered as the reaction rate. The insert shows the Michaelis–Menten plot with rate values obtained at different substrate concentrations.
Enzyme assays
Enzyme reactions were carried out at 37 °C. Each reactant (HSA, substrates, inhibitor) was dissolved in 50 mM MES buffer (pH 6.0), containing 5 mM Ca(OAc)2, 51.5 mM NaCl and 152 mM sodium azide, as suggested for activity measurement with GalG2CNP substrateCitation30.
Isothermal titration calorimetry
ITC experiments were carried out with ITC200 microcalorimeter (MicroCal, Northampton, MA) at 37 °C. Stirring speed of 800 rpm and reference power of 5 μcal/s were used. In each measurement HSA (1 μl of 1.13 μM) was titrated into the sample cell containing the solution of the substrate (0.1–10 mM) or in the case of inhibition assays the inhibitor (3.8–155 μM), as well. Samples were preincubated at 37 °C in a water bath to avoid bubble formation in the sample cell. The reference cell was filled with buffer. Heat-flow was measured until the ΔQ/Δt value reached the maximum at each different substrate concentration in a separate experiment (). A single injection gave a single pair of data for KM determination. Raw ITC data were evaluated using the Origin software (Northampton, MA).
Spectrophotometric measurements
Measurements were carried out with a Jasco V550 spectrophotometer. GalG2CNP was dissolved in the same buffer as used in calorimetric assay to the final volume of 500 μl. Inhibition measurements were carried out in the presence of acarbose. The reaction was initiated with the addition of HSA (2 nM). The increase of absorbance caused by the liberation of CNP was measured at 400 nm. The initial velocity was determined from the linear part of the kinetic curve using the Time Course Measurement option of Spectra Manager software (Jasco Co.). Every measurement was repeated at least three times.
HPLC measurements
For HPLC analysis an Agilent Infinity HPLC system was used, equipped with degasser, diode array detector and manual sampler, using a Genesis C-18 (15 cm × 4.6 mm × 4 μm) reverse phase column and MeCN – H2O 15:85 as eluent (0.8 ml/min, detection at 302 nm). 400 μl of 1–6 mM CNP-G7 solution was mixed with 8 μl of 84 nM HSA and the sample was incubated at 37 °C. The injections occurred after 5, 25, 45, 65 min of incubation. The acquired chromatograms were evaluated with the ChemStation software (Agilent, Santa Clara, CA). The evaluation of chromatograms was based on the area data of the main product (CNP-G3) at fewer than 10% of conversion. To get the initial velocity (v0), linear regression was made.
Data evaluation
Thermal power and reaction rate data originated from ITC, HPLC or spectrophotometric measurements were evaluated in the same way, using the standard relationships of enzyme kinetics, i.e. the Michaelis–Menten (MM) equation and the dose–response curve.
All plotting and fitting procedure were carried out using GraFit software (Erithacus Software Ltd, Horley, UK) applying the adequate equations. In order to determine the KM value, power or v0 data were plotted as a function of substrate concentration and a curve was fitted using non-linear regression based on MM equation (EquationEquation (2)(2) ).
(2)
where v is reaction rate, vmax is the maximal reaction rate at saturating substrate concentration, [S] is the substrate concentration and KM is the Michaelis constant.
For IC50 determination, the residual enzyme activity in the presence of inhibitor was plotted as a function of the logarithm of inhibitor concentration, and curve was fitted using standard four-parameter logistic non-linear regression based on EquationEquation (3)(3) .
(3)
where a is the maximum y range, x is the concentration of inhibitor, s is the slope factor and b is the background.
Results and discussion
shows a typical thermogram of HSA-catalysed substrate hydrolysis. To determine the Michaelis constant, a modified single injection methodCitation5 was used, which combines the advantages both of single and multiple injection methods. The one injection allows for rapid measurement of reaction rate, the total hydrolysis of substrate is not necessary and it does not require long pilot studies to optimise the parameters. The classical single injection method is applicable for such systems where vmax/KM ratio is small and conditions saturating the enzyme are easily achievable. Correct data analysis is possible only if the enzyme is saturated, otherwise only the ratio vmax/KM can be determinedCitation31.
In multiple injection methods, where the substrate is generally in the injector, very high concentration is needed in the syringe to achieve the saturating substrate concentration in sample cell, which is often difficult or impossible to achieve, especially in case of poorly soluble substrates. Using the method presented, in first step the cell has to be filled with a saturated or concentrated substrate solution then a small volume (1–2 μl) of the enzyme solution was added. The amplitude of the thermogram is proportional to the reaction rate belonging to the corresponding substrate concentration. Second, similar measurements should be performed with a series of substrate dilutions in separate experiments and all points of the MM curve are definable. This strategy enables the fast optimisation procedure because only the appropriate enzyme concentration needs to be determined.
Another problem with the classical multiple injection method is the large dilution effect, which occurs when concentrated solutions are injected into a diluted one. Since our method uses the arrangement described, these problems could be eliminated. Small volume of enzyme solution added to the cell generates a well-detectable heat change, up to the range of hundred-micromolar substrate concentration. The heat of dilution and substrate binding was negligible relative to the reaction heat. When the enzyme was added to the substrate solution the problem of injector leakageCitation31 was not observed. KM values 2.9 ± 0.4 mM and 0.6 ± 0.3 mM were determined using GalG2-CNP and CNP-G7 substrates, respectively.
To verify the validity of KM data obtained with the ITC method, measurements on chromophore-containing substrates were performed by means of spectrophotometry or HPLC for GalG2CNP and CNPG7, respectively. A new HPLC method was developed to follow the conversion of the CNP-G7 substrate quantitatively and these data were used to determine the reaction rate. As a result of the hydrolysis, three products were formed and the main compound (CNP-G3) was measured based on its peak area. The initial rate of the enzyme reaction was determined from the kinetic curves of CNP-G3 at different substrate concentrations and KM = 0.95 ± 0.3 mM was obtained using non-linear regression. This method is a new application of HPLC in enzyme kinetic experiments, which is a possible way to determine KM values of chromophore-containing substrates.
GalG2CNP substrate with an alpha-linked chromophore aglycon provides opportunity for a spectrophotometric amylase assay (KM = 2.2 ± 0.3 mM). The values obtained with direct reaction rate measurement using ITC were in good agreement with others where calculation of the reaction rate was based on determination of product concentration.
Experiments on different substrates
A series of free and chromophore-containing maltooligomers was investigated to determine the KM values (), which provided information about substrate binding to HSA. The obtained data showed that there is no remarkable difference between the two groups of tested substrates. The observed KM values were slightly smaller measured with the chromophore-containing substrates, which can be explained with the aromatic residues close to the active site of the enzymeCitation32. We can conclude that the aromatic aglycon did not alter the catalytic mechanism of amylase in contrast to the trypsin-catalysed reaction, where the rate limiting step was different for free and chemically modified substratesCitation33. The results showed that in the case of oligomers longer than maltoheptaose, notable decrease in KM values was not observed taking into account both series of data. Kinetic parameters for the hydrolysis of poly- and maltooligosaccharides by Pseudoalteromonas haloplanktis α-amylase (AHA) and porcine pancreatic α-amylase (PPA) were determined earlier using ITC but relationship between the number of glucose units and KM was not observedCitation5.
Table 1. Summary of KM values of HSA-catalysed hydrolysis reactions on free and chromophore-containing maltooligomer substrates measured by ITC (numbers indicate the number of glucose units) (SD < 15% on values).
Inhibition studies
Acarbose is an effective, well-described transition-state analogue alpha-glucosidase inhibitor and an efficient inhibitor of mammalian α-amylases, as well. Published IC50 values for starch hydrolysis by HSA are in the micromolar range, though the related data in literature are inconsistent (e.g. 40.7 μMCitation34 and 0.9 μMCitation35).
In the inhibition experiments, the residual activity of HSA on a short (GalG2CNP), on an oligomer (G7) and the natural (starch) substrate was determined at different inhibitor concentrations. An example of the raw data curves of inhibition assays and the fitted IC50 curve can be seen in , measured on starch hydrolysis. Using starch as substrate, inhibition measurements were carried out using three different starch concentrations (2.5; 3.75; 5 mg/ml) and inhibition constant (Ki = 8.0 μM) was determined with the Dixon plot (). The inhibition measurements using GalG2CNP were also performed with the spectrophotometric method to verify the ITC results ().
Figure 3. (A) Inhibition of starch hydrolysis with acarbose (•: 0 μM; ×: 7.75 μM; +: 25.8 μM; △: 52 μM; ▪: 155 μM) at 37 °C. The sample cell contained 200 μl of 5 mg/ml starch in 50 mM MES buffer at pH 6.0, the hydrolysis was initiated after 60 s delay with 1 μl of HSA. Data were recorded up to 110 s after the injection. (B) IC50 determination of acarbose on HSA-catalysed hydrolysis of starch.
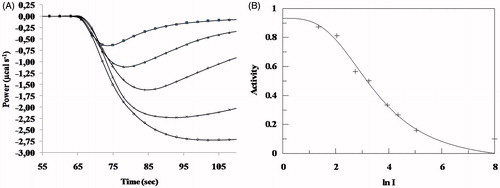
Figure 4. Dixon plot for determination of inhibition constant of acarbose (0–155 μM) on HSA-catalysed hydrolysis of starch (+: 5 mg/ml; △: 3.75 mg/ml; ×: 2.5 mg/ml).
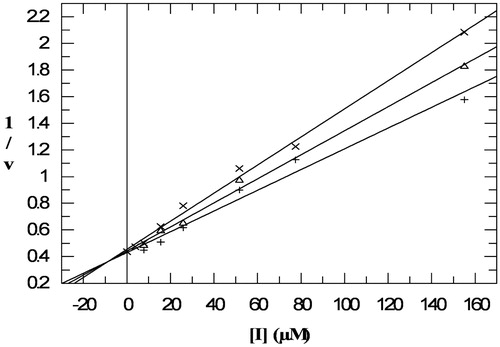
Table 2. IC50 and pIC50values of acarbose on inhibiting of HSA activity on different substrates.
IC50 values of acarbose are in the micromolar range, the exact value depends on the substrate. Acarbose can bind to the active centre, thus higher IC50 values were measured on the favoured substrate. Dose-dependent inhibition of an enzyme is a logarithmic relationship, so for comparison of the results, pIC50 shows better the relative potency of the inhibitor. The pIC50 values (negative log of IC50 expressed in M) obtained with ITC (6.15) and spectrophotometer (6.04) showed good agreement. The pIC50 for maltoheptaose and starch are very close, which also supports the conclusion, that maltoheptaose behaves similar to starch in a HSA-catalysed reaction.
Conclusion
Three independent methods, microcalorimetry, spectrophotometry and HPLC, were used to determine Michaelis constants and IC50 values in our model system, but among these three methods, only the ITC was suitable for direct measurement of the reaction rate. The KM and IC50 values obtained with ITC are in good agreement with data obtained using spectrophotometer and HPLC. The measured KM values show that over seven glucose units the incorporation of further glucose units does not affect the binding significantly, thus maltoheptaose or longer oligomers can model the behaviour of natural (starch) substrate of HSA properly. Although the effect of the aromatic chromophore group of substrates is observable, it does not alter the KM values considerably.
The described ITC method is appropriate for fast determination of Michaelis constants and IC50 for any enzyme–substrate or enzyme–inhibitor pairs. These data are the most important values for the comparison of different substrates and inhibitors. Drugs often activate or inhibit enzymes which may result in a therapeutic benefit to patients. Using rational drug design, we need a test method how the selected molecules influence the function or behaviour of the target enzyme. To select the appropriate substrate and the suitable experimental conditions for testing inhibitors requires the application of a general method and ITC may be the method of choice. ITC is suitable to compare natural and synthetic substrates based on KM values, to select the proper substrate concentration (close to KM) to the inhibition studies and to perform the IC50 determination using the same reaction conditions.
Declaration of interest
The authors are grateful for the financial support of TÁMOP-4.2.1.B-09/1/KONV, OTKA CK 77515 and OTKA ANN 110 821.
Related Research Data
References
- Freyer MW, Lewis EA. Isothermal titration calorimetry: experimental design, data analysis, and probing macromolecule/ligand binding and kinetic interactions. Methods Cell Biol 2008;84:79–113
- Saboury AA, Divsalar A, Ataie G, et al Inhibition study of adenosine deaminase by caffeine using spectroscopy and isothermal titration calorimetry. Acta Biochim Pol 2003;50:849–55
- Perspicace S, Rufer AC, Thoma R, et al Isothermal titration calorimetry with micelles: thermodynamics of inhibitor binding to carnitine palmitoyltransferase 2 membrane protein. FEBS Open Bio 2013;3:204–11
- Dahot MU, Saboury AA, Moosavi-Movahedi AA. Inhibition of β-amylase activity by calcium, magnesium and zinc ions determined by spectrophotometry and isothermal titration calorimetry. Inhib Med Chem 2004;19:157–60
- D’Amico S, Sohier JS, Feller G. Kinetics and energetics of ligand binding determined by microcalorimetry: insights into active site mobility in a psychrophilic α-amylase. J Mol Biol 2006;385:1296–304
- Karim N, Okada H, Kidokoro S. Calorimetric evaluation of the activity and the mechanism of cellulases for the hydrolysis of cello-oligosaccharides accompanied by the mutarotation reaction of the hydrolyzed products. Thermochim Acta 2004;412:91–6
- Baumann MJ, Murphy L, Lei N, et al Advantages of isothermal titration calorimetry for xylanase kinetics in comparison to chemical-reducing-end assays. Anal Biochem 2011;410:19–26
- Todd MJ, Gomez J. Enzyme kinetics determined using calorimetry: a general assay for enzyme activity? Anal Biochem 2001;296:179–87
- Draczkowski P, Tomaszuk A, Halczuk P, et al Determination of affinity and efficacy of acetylcholinesterase inhibitors using isothermal titration calorimetry. BBA Gen Subjects 2015;1860:967–74
- Maximova K, Trylska J. Kinetics of trypsin catalyzed hydrolysis determined by isothermal titration calorimetry. Anal Biochem 2015;486:24–34
- Saboury AA, Divsalar A, Jafari GA, et al A product inhibition study on adenosine deaminase by spectroscopy and calorimetry. J Biochem Mol Biol 2003;35:302–5
- Jeoh T, Baker JO, Ali MK, et al β-d-Glucosidase reaction kinetics from isothermal titration microcalorimetry. Anal Biochem 2005;347:244–53
- Kandra L. α-Amylases of medical and industrial importance. J Mol Struct 2003;666–667:487–98
- Ramasubbu N, Ragunath C, Sundar K, et al Structure-function relationships in human salivary α-amylase: role of aromatic residues. Biologia 2005;16:47–56
- Pickup JC, William G. Textbook of diabetes. 3rd ed. Vol. 2. Oxford: Blackwell Science Ltd.; 2003:73.1–.21
- Kaufman RA, Tietz NW. Recent advances in measurement of amylase activity-a comparative study. Clin Chem 1980;26:846–53
- Zhizhuang X, Storms R, Tsang A. A quantitative starch–iodine method for measuring alpha-amylase and glucoamylase activities. Anal Biochem 2006;351:146–8
- Manitchotpisi P, Skory CD, Leathers TD, et al α-Amylase activity during pullulan production and α-amylase gene analyses of Aureobasidium pullulans. J Ind Microbiol Biotechnol 2011;38:1211–18
- Tran PL, Lee JS, Park KH. Experimental evidence for a 9-binding subsite of Bacillus licheniformis thermostable α-amylase. FEBS Lett 2014;588:620–4
- Mótyán JA, Fazekas E, Mori H, et al Transglycosylation by barley α-amylase. J Mol Catal B Enzym 2011;72:229–37
- Xu Y, Zhang Z, Li L, et al Catechins play key role in green tea extract-induced postprandial hypoglycemic potential in vitro. Eur Food Res Technol 2013;237:89–99
- Lorentz K, Gütschow B, Renner F. Evaluation of a direct α-amylase assay using 2-chloro-4-nitrophenyl-α-D-maltotrioside. Clin Chem Lab Med 2005;37:1053–62
- Manaharan T, Appleton D, Cheng HM, Palanisamy UD. Flavonoids isolated from Syzygium aqueum leaf extract as potential antihyperglycaemic agents. Food Chem 2012;132:1802–7
- Kumar PS, Sudha S. Evaluation of alpha-amylase and alpha-glucosidase inhibitory properties of selected seaweeds from Gulf of Mannar. Int Res J Pharm 2012;3:128–30
- Kellogg J, Grace MH, Lila MA. Phlorotannins from Alaskan seaweed inhibit carbolytic enzyme activity. Marine Drugs 2014;12:5277–94
- Lorentz K. Routine alpha-amylase assay using protected 4-nitrophenyl-1, 4-alpha-D-maltoheptaoside and a novel alpha-glucosidase. Clin Chem 2000;46:644–9
- Morishita Y, Iinuma Y, Nakashima N, et al Total and pancreatic amylase measured with 2-chloro-4-nitrophenyl-4-O-beta-D-galactopyranosylmaltoside. Clin Chem 2000;46:928–33
- Bradford MM. A rapid and sensitive method for the quantitation of microgram quantities of protein utilizing the principle of protein-dye binding. Anal Biochem 1976;72:248–54
- Farkas E, Jánossy L, Harangi J, et al Synthesis of chromogenic substrates of alpha-amylases on a cyclodextrin basis. Carbohydr Res 1997;303:407–15
- Winn-Deen ES, David H, Sigler G, Chavez R. Development of a direct assay for alpha-amylase. Clin Chem 1988;34:2005–8
- Transtrum MK, Hansen LD, Quinn C. Enzyme kinetics determined by single-injection isothermal titration calorimetry. Methods 2015;76:194–200
- Ragunath C, Manuel SGA, Venkataraman V, et al Probing the role of aromatic residues at the secondary saccharide binding sites of human salivary α-amylase in substrate hydrolysis and bacterial binding. J Mol Biol 2008;384:1232–48
- Aguirre C, Condado-Morales I, Olguin LF, Costas M. Isothermal titration calorimetry determination of individual rate constants of trypsin catalytic activity. Anal Biochem 2015;479:18–27
- Kawamura-Konishi Y, Watanabe N, Saito M, et al Isolation of a new phlorotannin, a potent inhibitor of carbohydrate hydrolyzing enzymes, from the brown alga Sargassum patens. J Agric Food Chem 2012;60:5565–70
- Lo Piparo E, Scheib H, Frei N, et al Flavonoids for controlling starch digestion: structural requirements for inhibiting human α-amylase. J Med Chem 2008;51:3555–61