Abstract
Introduction: Classification of COPD is currently based on the presence and severity of airways obstruction. However, this may not fully reflect the phenotypic heterogeneity of COPD in the (ex-) smoking community. We hypothesized that factor analysis followed by cluster analysis of functional, clinical, radiological and exhaled breath metabolomic features identifies subphenotypes of COPD in a community-based population of heavy (ex-) smokers. Methods: Adults between 50–75 years with a smoking history of at least 15 pack-years derived from a random population-based survey as part of the NELSON study underwent detailed assessment of pulmonary function, chest CT scanning, questionnaires and exhaled breath molecular profiling using an electronic nose. Factor and cluster analyses were performed on the subgroup of subjects fulfilling the GOLD criteria for COPD (post-BD FEV1/FVC < 0.70). Results: Three hundred subjects were recruited, of which 157 fulfilled the criteria for COPD and were included in the factor and cluster analysis. Four clusters were identified: cluster 1 (n = 35; 22%): mild COPD, limited symptoms and good quality of life. Cluster 2 (n = 48; 31%): low lung function, combined emphysema and chronic bronchitis and a distinct breath molecular profile. Cluster 3 (n = 60; 38%): emphysema predominant COPD with preserved lung function. Cluster 4 (n = 14; 9%): highly symptomatic COPD with mildly impaired lung function. In a leave-one-out validation analysis an accuracy of 97.4% was reached. Conclusions: This unbiased taxonomy for mild to moderate COPD reinforces clusters found in previous studies and thereby allows better phenotyping of COPD in the general (ex-) smoking population.
Introduction
Chronic obstructive pulmonary disease (COPD) is a major cause of mortality and disability, and is defined by the Global Initiative for Chronic Obstructive Lung Disease (GOLD) as the presence of not fully reversible airflow obstruction, confirmed by postbronchodilator spirometry (ratio of forced expiratory volume in 1 second to forced vital capacity: FEV1/FVC <0.70) (Citation1). However, it is increasingly recognized that COPD is a complex and heterogeneous disease that cannot be described adequately by the severity of airflow limitation alone (Citation2). Patients vary widely in clinical presentation, response to therapy, decline in lung function, CT imaging and exacerbation frequency. By identification and prospective evaluation of subphenotypes of COPD, the response to therapies and prognosis may be better predicted. Besides this, differential pathophysiological mechanisms may thus be identified thereby allowing better targeted COPD studies (Citation2).
It has been proposed that a new taxonomy for defining COPD is required to recognize such subphenotypes (Citation3–7). Using unbiased statistical methods such as unsupervised cluster analysis, individuals are grouped based on their similarities and differences in multi-scale data (Citation5,Citation8). This is a way to describe patterns of the disease based on clinical, functional, and pathogenetic features.
Several studies have adopted this approach in order to identify meaningful subphenotypes of obstructive lung diseases (Citation3,Citation6,Citation7,Citation9–13). However, validation and generalisability of these clusters has been limited by the lack of postbronchodilator spirometry and limited availability of CT scans to assess the presence of emphysema. A comprehensive phenotypic characterization of patients with COPD should be based on patient-related outcomes such as health-related quality of life as well as functional, clinical, radiological and inflammatory features.
In a recent study we showed that metabolomic profiles of volatile organic compounds (VOCs) in exhaled air reflect different patterns of inflammatory metabolism and oxidative stress, being associated with eosinophilic and neutrophilic airway inflammation in subjects with mild and moderate COPD (Citation14). Combining exhaled air metabolomics with functional, clinical and radiological measurements may therefore identify relevant subphenotypes of COPD.
The identification and clinical usefulness of clusters is highly dependent on the population under investigation (Citation8). In the community or primary care centers, many individuals with COPD are underdiagnosed (Citation15) and severe cases are scarce, in contrast to the homogeneous patient populations in referral centers. A population-based survey may overcome the selection of a certain subset of patients and may well reflect the primary care population of patients with COPD (Citation8).
In this study we hypothesized that unsupervised cluster analysis in a community-based population of patients with COPD reveals subphenotypes of COPD using lung function parameters, CT scanning, symptoms and other clinical parameters, combined with exhaled breath metabolomics. To that end a survey on a population of heavy (ex-) smokers was undertaken. Cluster analysis was performed on parameters from those subjects in this survey fulfilling the current diagnostic criteria for COPD (Citation1). The validity of the clusters was then tested in a cross-validation analysis.
Methods
Subjects
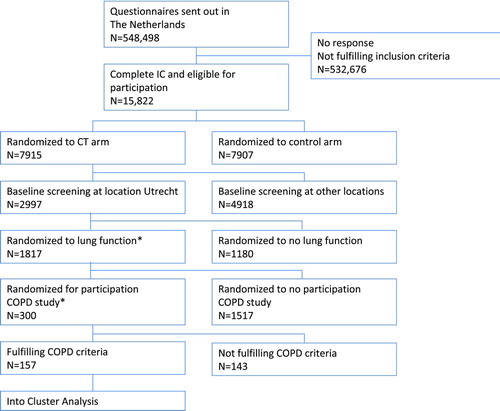
Subjects in this study were a random selection at a single location (Utrecht, The Netherlands) of the NELSON project. The NELSON project is a population-based Dutch-Belgian multicenter lung cancer screening trial of heavy smokers and ex-smokers (Citation16). Participants of the NELSON study were recruited by sending a questionnaire about smoking history and health-related items to all citizens between the ages of 50 and 75 years living in the area of the participating centers. Of the respondents, subjects meeting the inclusion criterion of a smoking history of at least 15 pack-years were invited for participation in the study (). COPD was defined according to the GOLD criteria (postbronchodilator FEV1/FVC ratio < 0.70) (Citation1). Chronic bronchitis was defined as cough and sputum production on most days for at least 3 months per year in at least 2 consecutive years (Citation17).
Figure 1 Flowchart of subjects in the study. Flowchart of the study. *Due to logistic reasons. COPD criteria are based on the GOLD guidelines: COPD is defined as the presence of postbronchodilator FEV1/FVC ratio < 0.70.
The trial was approved by the Dutch Ministry of Health and by the local investigational review boards of participating centers. All subjects gave their written informed consent. This COPD substudy of the NELSON study was registered at the Netherlands Trial Register, under NTR 1285.
Design
The study had a cross-sectional design and participants paid a single visit to the hospital. Chest CT scanning, exhaled breath sampling, pre- and postbronchodilator spirometry and diffusion capacity were performed and questionnaires were taken.
Measurements
Questionnaires
Subjects completed a validated questionnaire of the European Community Respiratory Health Survey (ECRHS) concerning sociodemographic data, respiratory symptoms, co-morbidity, treatments and previous diagnoses, use of medications and smoking history (Citation18). Subjects also completed the clinical COPD questionnaire (CCQ) which measures the disease-related health status (Citation19).
Lung function testing
Spirometry was performed before and 10 minutes after inhalation of 400 μg of salbutamol via a spacer according to the latest ERS recommendations using daily calibrated equipment (Citation20). Diffusion capacity for carbon monoxide corrected for alveolar volume (DL,CO/VA) was measured according to the recommendations using the single breath method and an inhalation mixture of 0.3% CO and 10% He with air (Citation21).
Chest CT scanning
CT scanning was performed using a multidetector-row CT scanner (Mx8000 IDT or Brilliance 16P, Philips Medical Systems, Cleveland, OH, USA). Scans were performed in end-inspiration without contrast. Scanning time was within 12 s, in spiral mode with 16 · 0.75 mm collimation, 1.0 mm reconstruction thickness, 0.7 mm increment, voltage of 120 kVp for subjects ≤ 80 kg or 140 kVp for subjects > 80 kg (30 mAs). Scans were analyzed using ImageXplorer (iX) (Image Sciences Institute, Utrecht, NL) (Citation22). The extent of emphysema was estimated by quantifying the percentage of the total lung voxels below 950 and 910 Hounsfield units (HU) (Citation22). In addition, the 15th percentile point (perc15) was measured (Citation23). The perc15 is defined as the threshold value in Hounsfield units (HU) for which 15% of all lung voxels has a lower value.
Exhaled breath collection
Collection of exhaled breath was done as previously described (Citation14,Citation24,Citation25). In short, patients breathed normally for 5 minutes with the nose clipped through an inspiratory VOC-filter (A2, North Safety, NL), connected to a three-way non re-breathing valve and exhaled through a silica reservoir. Then, patients took a single deep maximal inspiration and exhaled one vital capacity volume into a 10 L Tedlar bag (SKC Inc., Eighty Four, PA, USA) connected to the expiratory port and the silica reservoir. In parallel, a Tedlar bag was filled with VOC-filtered room air for comparison.
Breath analysis by electronic nose
Within 5 minutes after breath was collected the Cyranose 320 electronic nose (Smiths Detection, Pasadena, Ca, USA) was connected to the Tedlar bag, followed by 1 minute (100 ml) sampling of the exhaled air. This was done in parallel with sampling a Tedlar bag filled with VOC-filtered room air for comparison. Raw eNose data consists of changes in electrical resistance of each of the 32 polymer sensors (Citation26,27) and was used for further analysis with offline pattern-recognition software.
Statistical analysis
SPSS (version 18.0) and R were used for data analysis. The total number of 100 variables was reduced to 32 variables representing measures of airflow limitation, response to bronchodilation, gas transfer, metabolomics breath profile, health-related quality of life, sputum production, smoking habits and radiological features of emphysema. Redundant variables covering the same domain were excluded from analysis (e.g., postbronchodilator FEV1%pred was chosen for the lung function domain). eNose raw data (change in resistance of sensors) were restructured by principal component analysis from the original 32 sensors to 4 principal components (PC) capturing 95.2% of the variance within the data set.
Missing values made up a small proportion (3.9%) and were considered to be at random (Citation28,29). Multiple imputation by the method of Rubin (Citation30) was used for the generation of missing data replacements based on values drawn from the distribution posited by the prediction model, taking into account the relationships between the incomplete variables and all other variables (Citation28,29).
Factor analysis
Data was further reduced by factor analysis with orthogonal varimax rotation (Citation31). Based on the loading pattern 12 factors were identified with an eigenvalue >1 representing the different domains of COPD.
One variable representative for each factor was selected, based on the highest loading: pbFEV1, reversibility in FEV1, the presence of chronic bronchitis, diabetes, coronary vascular disease, BMI, dyspnea at rest, pack-years, use of long-acting bronchodilators, 2 electronic nose principal components and chest CT-scan emphysema score (perc15).
Cluster analysis
Cluster analysis is an unbiased way to assign subjects to groups with similar features without a priori assumptions for classification. Clusters are constructed in such a way that individuals within in a cluster are highly associated and weakly to individuals in other clusters (Citation8).
Subjects were selected for inclusion in the cluster analysis in case they met the spirometric criteria for COPD: post-bronchodilator FEV1/FVC ratio < 0.70 (Citation1).
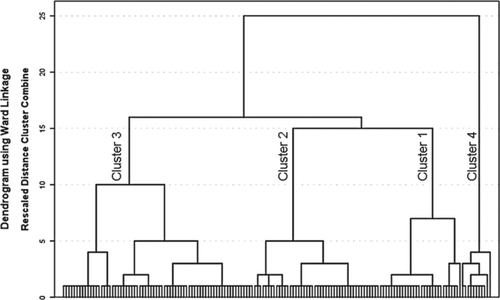
Cluster analysis was performed following a multi-step approach. Hierarchical cluster analysis by Ward's method resulted in a dendrogram for estimation of the number of clusters (). The number of clusters was determined by the stage associated with the largest distance coefficient delta in the agglomeration schedule by Ward's method and by the Dunn index (cluster.stats, library fpc in R) and gap statistic (clusGAP in R) (Citation32). The Dunn index identifies clusters that are compact and well separated. The number of clusters where the Dunn index was maximal was taken as the optimal number of clusters (Citation33).
Figure 2 Dendrogram. Hierarchical cluster analysis by Ward's method resulted in a dendogram identifying 4 clusters.
The cluster quality was then checked by two-step cluster analysis, which was ‘good’ for 4 clusters. Finally, a non-hierarchical k-means cluster analysis was performed with the number of clusters set to 4 (Citation34). The internal validity of this model was tested by repeating the k-means cluster analysis 157 times in a leave-one-out validation model (every subject was left out once during cluster formation and used for validation, while the remaining patients served as the training set). The accuracy number was obtained by assessing the percentage of correctly classified cases in each of the 157 runs as compared to the original k-means cluster analysis that included all subjects.
Additionally, the silhouette width was used as a measure of internal validity. The silhouette width is an indicator on the membership of a person in a certain cluster. Closer to 1 means that a person is well clustered, closer to -1 means that the person is misclassified (Citation33). Differences of variables between the clusters were assessed by means of Chi-squared, ANOVA or Kruskal-Wallis tests, as appropriate. A p-value < 0.05 was considered to be significant.
Results
Baseline characteristics
Three hundred subjects completed the tests, of which 157 (52%) fulfilled the criteria for COPD and entered the factor and cluster analysis. For the flow chart of the NELSON study in The Netherlands and the COPD substudy, see . The characteristics of the subjects that participated in the cluster analysis are shown in .
Table 1. Demographics and clinical characteristics of the total cohort and COPD clusters identified by factor and cluster analysis
Cluster analysis
Variables that were included in the factor analysis and their values per cluster are listed in Tables to . The cluster analysis identified 4 distinct clusters based on the 12 variables included in the model after factor analysis (). Clusters showed contrasts with respect to airflow limitation, exhaled molecular profile, health-related quality of life, sputum production, dyspnea, smoking history, co-morbidity, radiologic lung density and gender. Other demographic variables, response to bronchodilation and current smoking status showed no differences between clusters. One out of 4 electronic nose principal components (PC4) showed differences between clusters, whereas the other 3 PC did not (). The gap statistic was 0.63 (SE 0.02) and the Dunn index 0.074 for 4 clusters (range 0.049–0.074 for 2 to 6 clusters).
Table 2. Description of the total cohort and COPD clusters identified by factor and cluster analysis
Table 3. Loadings of variables per factor
Cluster 1 grouped 35 subjects (22% of total) with relatively mild disease. Subjects exhibited mild airflow obstruction, good quality of life and limited symptoms of cough or chronic sputum production. Subjects reported symptoms of dyspnea mainly during exercise and not in rest. Electronic nose PC4 showed low values representing a characteristic molecular profile. Patients showed a relatively high lung density with a mean perc15 of -918 (SD 19) HU indicating little emphysema. This cluster contained the highest percentage females (31%).
Cluster 2 grouped 48 subjects (31% of total) with characteristics of both chronic bronchitis and emphysema. Airflow limitation was moderately severe as this cluster contained all patients with GOLD stage 3 disease that were present in the study. This group showed a distinct breath profile with high PC4 values. Diffusion capacity was impaired and chest CT showed emphysema.
Cluster 3 was the largest cluster, consisting of 60 subjects (38% of total). GOLD stage I subjects made up 95% of all subjects in this cluster and as such, mean pbFEV1 was best in this cluster as compared to other clusters (mean 106%pred, SD 10). Patients had little symptoms, but chest CT did show a lower lung density (mean -950 HU, SD 15) indicating the presence of (asymptomatic) emphysema with preserved lung function. Hypercholesterolaemia was common in this cluster, although cardiovascular co-morbidity was not increased. eNose PC4 was in the same range as in cluster 1, suggesting a similar exhaled molecular profile in these clusters.
Cluster 4 grouped 14 subjects (9% of total) that were highly symptomatic with respect to dyspnea, both at exercise and at rest. Patients had a reduced quality of life, but lung function was relatively preserved and inhalation medication use was absent. This cluster showed the highest amount of pack-years (mean 96, SD 27). Radiologic emphysema score and breath profile (electronic nose PC4) were in the intermediate range (Tables –).
Internal validation of clusters
In order to validate the clusters that were identified, the k-means cluster analysis in a leave-one-out validation model was performed 157 times, resulting in an accuracy of 97.4%. The average silhouette width for all 4 clusters was 0.22 (cluster 1 0.24; cluster 2 0.27; cluster 3 0.25; cluster 4 0.17).
Discussion
The present cluster analysis derived from a community-based population of heavy (ex-) smokers identified 4 distinct clusters of patients with COPD. It appeared that symptoms, spirometry, CT lung density and exhaled molecular profiling all contributed significantly (p < 0.05) to distinguish these COPD subphenotypes. Cluster 1 consisted mainly of mild COPD. Patients in cluster 2 showed the largest impairment in lung function and signs of emphysema and many subjects reported symptoms of dyspnea and chronic bronchitis. Cluster 3 was characterized by emphysema with preserved lung function. Cluster 4 consisted of highly symptomatic subjects with preserved lung function. This study validates and extends phenotypes of COPD of other studies, and could therefore provide a new taxonomy for COPD (Citation5).
Multidimensional assessment of COPD is increasingly recognized as an effective approach to discover clinically relevant phenotypes that may differ in natural course of disease and response to therapies (Citation4,Citation35). A previous factor analysis provided good evidence of heterogeneity of COPD when using clinical, physiological and cellular biomarkers (Citation36). Cluster analysis comprises a next step aimed to identify COPD phenotypes by classification of subjects into homogeneous groups based on a heterogeneous set of variables (Citation8). This method is considered to be hypothesis-generating rather than potentially biased by a priori assumptions.
Previously, several groups adopted similar approaches to identify subphenotypes in patients with COPD (Citation6,7,Citation9–13). Subphenotypes that were identified were severe COPD (Citation9–11,Citation13), mild COPD (Citation10,11,Citation13), chronic bronchitis (Citation9–12), emphysematous COPD (Citation12,13) and a phenotype with features of both chronic bronchitis and emphysema (Citation9). These studies were mainly focused on clinical COPD subphenotypes, and often did not include biomarkers or CT parameters.
In contrast, subjects in the present study were randomly recruited from a community-based survey among heavy (ex-) smokers. This makes our results better generalisable in the primary care population. In addition to the regular diagnostic workup for COPD, we also included spiral CT scanning of the chest in order to assess the presence and extent of emphysema, and exhaled breath metabolomics using an electronic nose. The latter is a non-invasive integrative analysis that appears to be associated with the inflammatory profile in both asthma and COPD (Citation14,Citation37).
The clusters show distinct breath molecular profiles as assessed by electronic nose. Cluster 1 has high PC4 values, indicating a distinct profile as compared to the other clusters. This cluster also shows chronic bronchitis and emphysema. Although sputum measurements were not performed in this study, it is likely that the high PC4 value in this cluster reflects the presence of airway inflammation associated with chronic bronchitis.
The clusters identified in this study confirm and extend the COPD phenotypes found by others using cluster analysis, including the mild COPD group (cluster Citation1) (Citation9,10), the combined chronic bronchitis and emphysema group (cluster 2) (Citation9–11) and the asymptomatic emphysematous group (cluster 3) (Citation9,Citation11,Citation13). This not only serves as an promosing result warranting further external validation (Citation38), but also indicates that clinical subphenotypes of COPD can also be found in a general population of heavy smokers. Most importantly, this study confirms the COPD-clusters found in the community-based study by Weatherall et al. (Citation9), thereby serving as validation. Interestingly, the smallest cluster in this study, the highly symptomatic COPD group with no use of inhalation medication with preserved lung function (cluster Citation4) was not reported previously. This group might represent patients that are not optimally treated (inhalation medication use is 0%) despite their relatively normal lung function.
The newest GOLD guidelines recommend the inclusion of exacerbation risk (high risk defined as ≥2 exacerbations/year) as an extra domain in characterizing COPD (Citation1). In this population-based study, only 5 exacerbations were reported in the past year. This was not unexpected as most patients (97%) were classified as GOLD A or B based on their spirometry results. However, 3 out of 5 exacerbations were reported in Cluster 2, the combined emphysema-chronic bronchitis cluster.
We made large efforts to ensure the validity of our findings by careful methodological choices. First, COPD was established based on the GOLD criteria (Citation1), being the current gold-standard. This makes the results easily comparable to other studies. Second, the recruitment of subjects from the general population, rather than selected clinical groups of patients, ensured that the data can be generalized to COPD in the community, predominantly featuring mild to moderate airways obstruction. Third, the variables in the cluster analysis were chosen to reflect different aspects of COPD, including functional, clinical, inflammatory, radiological and patient-centered outcomes. Fourth, most studies using cluster analysis excluded subjects with missing data. This markedly decreases the available sample size, as it often occurs that a variable is missing due to logistic reasons or technical issues. Rather than excluding subjects, we used multiple imputation to generate replacements of the small proportion of randomly missing data (Citation28–30). This procedure has been validated and is considered a reliable method for unbiased analysis of missing data when taking into account all observed data (Citation29).
The choice for a community-derived sample of subjects may also be considered as a limitation in this study. The range of FEV1 in the study population is narrow with a mean FEV1 of 88%pred, and only 3 patients are GOLD stage III. We recognize that the different clusters that were found are directly influenced by the population in which the study was carried out. However, the fact that all COPD clusters in this study are consistent with those in other studies as well strengthens the validity of our findings. Notably, these phenotypes appear to be already apparent at mild or early stages of the disease (Citation4).
A second potential limitation is that the use of disease-modifying treatments such as inhaled corticosteroids and the presence of co-morbidities may have affected the results. Co-morbidities were assessed by questionnaires and by medication usage rather than by systematic diagnostic check-up. Therefore, we cannot completely exclude missing a proportion of yet undiagnosed co-morbidities. On the other hand, medication use and co-morbidity were not used as selection criteria, thereby reflecting a real life community-derived COPD population and daily practice in primary care.
Each of the clusters showed a distinct profile: a combination of features covering the different disease domains of COPD. This cannot be translated directly into (partly) distinct, driving pathogenetic mechanisms. However, one may speculate that inflammatory subtype and -activity plays an important role. This study is likely to have implications for future COPD studies. First, a better understanding of the COPD phenotypes that are associated with differential treatment responses or prognosis may facilitate the development of more specific diagnostic procedures and targeted therapies. COPD subphenotyping will benefit the design of randomized controlled trials, especially in mild or early stages of the disease in the primary care population (Citation5,Citation15).
It has been estimated that only 1 in 20 patients identified as having COPD in a community survey would meet the current criteria for inclusion in an RCT for COPD (Citation39). Representative samples of the most prevalent phenotypes of COPD will strengthen the implications of clinical trials. Second, exhaled metabolomic profiling contributed to the subphenotyping of COPD. This indicates not only that inflammatory status (Citation14) and thereby the potential response to anti-inflammatory and other therapies differs between clusters, but also that such molecular subphenotyping can be obtained by adding a rapid, non-invasive breath test to the diagnostic work-up of COPD. Finally, in order to examine the stability and clinical course of the COPD subphenotypes, longitudinal follow-up studies and treatment response studies should be carried out (Citation4).
Conclusions
In a community-derived population of patients with predominantly mild to moderate COPD, 4 distinct subphenotypes could be identified using factor and cluster analysis of clinical, functional, CT lung density and metabolomics data: mild COPD, combined emphysema and chronic bronchitis, asymptomatic emphysema and symptomatic COPD with preserved lung function. Using such new taxonomy could result in better phenotyping of COPD and thereby to potentially better management in daily practice and more focussed clinical trials.
Declaration of Interest Statement
The authors declare that there are no financial, consulting, and personal interests that could influence the authors’ work. The study was funded by an unrestricted grant from the Netherlands Asthma Foundation, grant no 3.2.06.17.
Acknowledgments
The authors would like to thank Marc P.C. van der Schee and Eva Roos for their help with exhaled breath measurements. The study was funded by an unrestricted grant from the Netherlands Asthma Foundation, grant no 3.2.06.17. The Netherlands Asthma Foundation did not have a role in the design, collection, analysis and interpretation of data, writing of the manuscript and in the decision to submit the manuscript for publication.
NF conceived of the study, carried out the breath measurements, performed the statistical analysis and wrote the manuscript. AvR carried out the breath measurements, constructed the database and performed the statistical analysis. PZ facilitated the lung function measurements and participated in the design and coordination of the study. BvG carried out the CT-scans and participated in the design and coordination of the study. RvK participated in the design and coordination of the study. AZ performed the statistical analysis and helped to draft the manuscript. PS conceived of the study, participated in the design of the study and helped to draft the manuscript. All authors read and approved the final manuscript.
Referensces
- Available from: http: www.goldcopd.org/. From the Global Strategy for the Diagnosis, Management and Prevention of COPD, Global Initiative for Chronic Obstructive Lung Disease (GOLD) 2011.
- Beasley R, Weatherall M, Travers J, Shirtcliffe P. Time to define the disorders of the syndrome of COPD. Lancet 2009 Aug 29; 374(9691):670–672.
- Wardlaw AJ, Silverman M, Siva R, Pavord ID, Green R. Multi-dimensional phenotyping: towards a new taxonomy for airway disease. Clin Exp Allergy 2005 Oct; 35(10):1254–1262.
- Han MK, Agusti A, Calverley PM, Celli BR, Criner G, Curtis JL, Chronic obstructive pulmonary disease phenotypes: the future of COPD. Am J Respir Crit Care Med 2010 Sep 1; 182(5):598–604.
- Shirtcliffe P, Weatherall M, Travers J, Beasley R. The multiple dimensions of airways disease: targeting treatment to clinical phenotypes. Curr Opin Pulm Med 2011 Mar; 17(2):72–78.
- Bafadhel M, McKenna S, Terry S, Mistry V, Reid C, Haldar P, Acute exacerbations of chronic obstructive pulmonary disease: identification of biologic clusters and their biomarkers. Am J Respir Crit Care Med 2011 Sep 15; 184(6):662–671.
- Bafadhel M, Umar I, Gupta S, Raj JV, Vara DD, Entwisle JJ, The role of CT scanning in multidimensional phenotyping of COPD. Chest 2011 Sep; 140(3):634–642.
- Weatherall M, Shirtcliffe P, Travers J, Beasley R. Use of cluster analysis to define COPD phenotypes. Eur Respir J 2010 Sep; 36(3):472–474.
- Weatherall M, Travers J, Shirtcliffe PM, Marsh SE, Williams MV, Nowitz MR, Distinct clinical phenotypes of airways disease defined by cluster analysis. Eur Respir J 2009 Oct; 34(4):812–818.
- Cho MH, Washko GR, Hoffmann TJ, Criner GJ, Hoffman EA, Martinez FJ, Cluster analysis in severe emphysema subjects using phenotype and genotype data: an exploratory investigation. Respir Res 2010; 11:30.
- Burgel PR, Paillasseur JL, Caillaud D, Tillie-Leblond I, Chanez P, Escamilla R, Clinical COPD phenotypes: a novel approach using principal component and cluster analyses. Eur Respir J 2010 Sep; 36(3):531–539.
- Pistolesi M, Camiciottoli G, Paoletti M, Marmai C, Lavorini F, Meoni E, Identification of a predominant COPD phenotype in clinical practice. Respir Med 2008 Mar; 102(3):367–376.
- Garcia-Aymerich J, Gomez FP, Benet M, Farrero E, Basagana X, Gayete A, Identification and prospective validation of clinically relevant chronic obstructive pulmonary disease (COPD) subtypes. Thorax 2011 May; 66(5):430–437.
- Fens N, de Nijs SB, Peters S, Dekker T, Knobel HH, Vink TJ, Exhaled air molecular profiling in relation to inflammatory subtype and activity in COPD. Eur Respir J 2011 Dec;38(6):1301-9.
- Marsh SE, Travers J, Weatherall M, Williams MV, Aldington S, Shirtcliffe PM, Proportional classifications of COPD phenotypes. Thorax 2008 Sep; 63(9):761–767.
- van Iersel CA, de Koning HJ, Draisma G, Mali WP, Scholten ET, Nackaerts K, Risk-based selection from the general population in a screening trial: selection criteria, recruitment and power for the Dutch-Belgian randomised lung cancer multi-slice CT screening trial (NELSON). Int J Cancer 2007 Feb 15; 120(4):868–874.
- Fletcher CM, Pride NB. Definitions of emphysema, chronic bronchitis, asthma, and airflow obstruction: 25 years on from the Ciba symposium. Thorax 1984 Feb; 39(2):81–85.
- Burney PG, Luczynska C, Chinn S, Jarvis D. The European Community Respiratory Health Survey. Eur Respir J 1994 May; 7(5):954–960.
- van der Molen T, Willemse BW, Schokker S, ten Hacken NH, Postma DS, Juniper EF. Development, validity and responsiveness of the Clinical COPD Questionnaire. Health Qual Life Outcomes 2003; 1:13.
- Miller MR, Hankinson J, Brusasco V, Burgos F, Casaburi R, Coates A, Standardisation of spirometry. Eur Respir J 2005 Aug; 26(2):319–338.
- Macintyre N, Crapo RO, Viegi G, Johnson DC, van der Grinten CP, Brusasco V, Standardisation of the single-breath determination of carbon monoxide uptake in the lung. Eur Respir J 2005 Oct; 26(4):720–735.
- Gietema HA, Schilham AM, van GB, van Klaveren RJ, Lammers JW, Prokop M. Monitoring of smoking-induced emphysema with CT in a lung cancer screening setting: detection of real increase in extent of emphysema. Radiology 2007 Sep; 244(3):890–897.
- Stoel BC, Stolk J. Optimization and standardization of lung densitometry in the assessment of pulmonary emphysema. Invest Radiol 2004 Nov;39(11):681–688.
- Dragonieri S, Schot R, Mertens BJ, Le CS, Gauw SA, Spanevello A, An electronic nose in the discrimination of patients with asthma and controls. J Allergy Clin Immunol 2007 Oct; 120(4):856–862.
- Fens N, Zwinderman AH, van der Schee MP, de Nijs SB, Dijkers E, Roldaan AC, Exhaled breath profiling enables discrimination of chronic obstructive pulmonary disease and asthma. Am J Respir Crit Care Med 2009 Dec 1; 180(11):1076–1082.
- Lewis NS. Comparisons between mammalian and artificial olfaction based on arrays of carbon black-polymer composite vapor detectors. Acc Chem Res 2004 Sep;37(9):663–672.
- Röck F, Barsan N, Weimar U. Electronic nose: current status and future trends. Chem Rev 2008 Feb; 108(2):705–725.
- de Groot JA, Janssen KJ, Zwinderman AH, Bossuyt PM, Reitsma JB, Moons KG. Correcting for partial verification bias: a comparison of methods. Ann Epidemiol 2011 Feb; 21(2):139–148.
- Marti H, Chavance M. Multiple imputation analysis of case-cohort studies. Stat Med 2011 Jun 15; 30(13):1595–1607.
- Rubin DB, Schenker N. Multiple imputation in health-care databases: an overview and some applications. Stat Med 1991 Apr; 10(4):585–598.
- Bartholomew DJ, Steele F, Moustaki I, Galbraith J. Factor analysis for binary data. In: Chapman, Hall, editors. The Analysis and Interpretation of Multivariate Data for Social Scientists. 2002, Chapman and Hall/CRC, London, UK.
- Tibshirani R, Walther G, Hastie T. Estimating the number of clusters in a data set via the gap statistic. J R Statist Soc B 2001; (63):411–423.
- Bolshakova N, Azuaje F. Machaon CVE: cluster validation for gene expression data. Bioinformatics 2003 Dec 12; 19(18):2494–2495.
- Brusco MJ. Clustering binary data in the presence of masking variables. Psychol Meth 2004 Dec; 9(4):510–523.
- Agusti A, Celli B. Avoiding confusion in COPD: from risk factors to phenotypes to measures of disease characterisation. Eur Respir J 2011 Oct; 38(4):749–751.
- Lapperre TS, Snoeck-Stroband JB, Gosman MM, Stolk J, Sont JK, Jansen DF, Dissociation of lung function and airway inflammation in chronic obstructive pulmonary disease. Am J Respir Crit Care Med 2004 Sep 1; 170(5):499–504.
- Ibrahim B, Basanta M, Cadden P, Singh D, Douce D, Woodcock A, Non-invasive phenotyping using exhaled volatile organic compounds in asthma. Thorax 2011 Sep; 66(9): 804–9.
- Bossuyt PM, Reitsma JB, Bruns DE, Gatsonis CA, Glasziou PP, Irwig LM, The STARD statement for reporting studies of diagnostic accuracy: explanation and elaboration. Ann Intern Med 2003 Jan 7; 138(1):W1–12.
- Travers J, Marsh S, Williams M, Weatherall M, Caldwell B, Shirtcliffe P, External validity of randomised controlled trials in asthma: to whom do the results of the trials apply? Thorax 2007 Mar; 62(3):219–223.