
Abstract
The mouse drug allergy model (MDAM) was developed as a tool to predict the potential of systemically administered drugs to produce hypersensitivity reactions (HR). Drugs associated with HR in the clinic produce a marked increase in the cellularity of the draining lymph nodes (DLN) in the MDAM. The objective of this study was to characterize the changes in the DLN following exposure to drugs associated with HR and to investigate whether lymphocyte migration and/or proliferation play a role in the response. These endpoints were also investigated in the local lymph node assay (LLNA) to determine whether responses between the two assays occur via similar mechanisms. Results demonstrated that total numbers of T- and B-cells were proportionally increased in the DLN of mice treated with positive control drugs (i.e. abacavir, amoxicillin, ofloxacin, and sulfamethoxazole) compared to animals administered the vehicle or negative control drugs (metformin and cimetidine). In contrast, a significant increase in the B-cell population of the DLN was observed for 2,4-dinitrofluorobenzene (DNFB) following the LLNA protocol. Down-regulation of CD62L and up-regulation of CCR7 were observed for T-cells from the DLN of the positive control treated mice in the MDAM, but not with DNFB in the LLNA. A mild increase in T-cell proliferation was observed in the MDAM with positive control drugs, while DNFB in the LLNA induced proliferation within the B-cell population only. Anti-CD40L antibody administration inhibited MDAM responses to positive control drugs, but did not affect DNFB-induced increases in total cell number in the LLNA. These results suggest that the increased cellularity of the DLN in the MDAM may be the result of drug-induced alterations in lymphocyte migration and/or effects on lymphocyte proliferation. Moreover, it appears that different mechanisms may be involved in driving the MDAM and LLNA responses.
Introduction
Drug hypersensitivity reactions (DHR) are not only an important public health issue (Gomes & Demoly, Citation2005; Thong & Tan, Citation2011), but can also be a major hurdle for the pharmaceutical industry with respect to risk assessment and management if/when these reactions occur. There is an unmet need for predicting the undesired allergic events associated with low molecular weight drug candidates and a validated animal model has not yet been developed. Over the past few decades, methods such as the murine local lymph node assay (LLNA) (Kimber et al., Citation2002) have been used extensively to predict if dermal exposure to chemicals could produce contact sensitization. However, this method has not proven to be useful for predicting the sensitization potential of low molecular weight drugs administered systemically (Adkinson et al., Citation2002).
The popliteal lymph node assay (PLNA) has been utilized as an assay for predicting drug allergy by injecting the test compound into the footpad of a mouse or rat and examining the response of the draining popliteal lymph node (Bloksma et al., Citation1995). A modification of the PLNA, i.e. the lymph node proliferation assay (LNPA), was tested by multiple labs to assess the potential immunogenic effects of systemically-administered drugs (Weaver et al., Citation2005). However, in that study, only a limited number of compounds were tested and the mechanisms of drug-induced immune responses were left unclear. Recently, the mouse drug allergy model (MDAM) was developed as a modification of the LNPA and may be a promising tool for the identification of drug candidates that have the potential to cause hypersensitivity reactions (Whritenour et al., Citation2014). The assay utilizes flow cytometric analysis to measure the total viable cell counts in the draining lymph nodes (DLN) of mice for assessment of the potential of a compound to induce a HR. The MDAM was partially validated using 18 compounds associated or not with hypersensitivity reactions (HR) in humans and demonstrated a good positive correlation between total cell number in the DLN and compounds associated with HR (Whritenour et al., Citation2014). However, the underlying mechanisms for the MDAM response remain unclear.
Under normal conditions, naïve and memory lymphocytes circulate between blood, lymphatics, and lymphoid tissue (such as lymph nodes, spleen, and mucosa-associated lymphoid tissue) (von Andrian & Mempel, Citation2003). A homeostatic balance of the lymphocyte population is usually maintained with respect to number and composition of lymphocyte sub-populations prior to encountering an antigen (Masopust & Schenkel, Citation2013). Once a lymphocyte recognizes an antigen, the activation process starts. Expression of co-stimulatory molecules on antigen-presenting cells and lymphocytes plays a critical role in driving lymphocytes towards full activation and the induction of an immune response (Daoussis et al., Citation2004; Elgueta et al., Citation2009). During an immune response, lymph node (LN) cell numbers markedly increase after antigen recognition (Mackay et al., Citation1992). The increase in the cellularity of the DLN observed for the MDAM suggests the initiation of immune responses, possibly as a result of lymphocyte activation by the drug.
There are several mechanisms by which the increase in cellularity could occur. One such mechanism may be migration of cells from the circulation into the DLN (Finlay & Cantrell, Citation2011; Mackay et al., Citation1992). The chemokine receptor CC-chemokine receptor 7 (CCR7, CD197) has been shown to play a critical role in transmigration and egress of T-cells from circulation into lymph nodes (Forster et al., Citation1999). Impaired lymphocyte migration was observed in CCR7-deficient mice that failed to develop contact sensitivity and delayed-type hypersensitivity reactions (Forster et al., Citation1999). Several studies have shown that drugs could have differential effects on the expression of molecules involved in lymphocyte migration (Liu et al., Citation2007; Sordi et al., Citation2006). In addition to CCR7, the adhesion molecule CD62L (also known as L-selectin) is expressed on T-cells, and also plays a role in lymphocyte entry into the lymph nodes (Masopust & Schenkel, Citation2013). It has been shown that CD62L expression is down-regulated or lost upon T-cell receptor (TCR) engagement (Chao et al., Citation1997) and, as such, this molecule has been used as a surface marker to assess the activation status of T-cells (Cose et al., Citation1997). Other than lymphocyte migration, drug-induced proliferation of DLN cells may also play a role in the observed MDAM response. After being activated by the antigen presenting cells, T-cells stay within the lymph node and start the process of proliferation (Finlay & Cantrell, Citation2011). After activation, B-cells may also undergo proliferation with or without the involvement of CD4+ T-helper cells (Mauri & Bosma, Citation2012). It has been shown that B-cell proliferation is responsible for the increased cellularity in the spleen of mice that have been infected by Babesia microti (Inchley, Citation1987). Measurement of cell proliferation is the endpoint most widely used for the LLNA and LNPA (Kimber et al., Citation2002; Weaver et al., Citation2005).
The first objective of the current study was to investigate potential mechanisms for the observed increase in DLN cellularity in the MDAM. It is hypothesized that some drugs that are associated with hypersensitivity responses could promote proliferation and/or alter lymphocyte trafficking, and thus contribute to the increased cellularity in the DLN. Characterization of the lymphocyte sub-population within the DLN and evaluation of the changes in the expression of adhesion molecules were carried out following administration of positive (i.e. abacavir, amoxi-cillin, ofloxacin, and sulfamethoxazole) and negative (cimetidine, metformin) control drugs (Whritenour et al., Citation2014). The phenotypic characterization of DLN cells was also used to help to identify new parameters that could potentially be used to enhance the sensitivity and specificity of the MDAM. In addition, the effect of these drugs on lymphocyte proliferation in the DLN was investigated by Ki67 intracellular staining. The second objective of this study was to compare the lymphocyte subset in the DLN in the MDAM and LLNA and investigate the role of anti-CD40L treatment in both assays to determine whether or not there is a similar mechanism for the increased DLN cellularity.
Materials and methods
Mice
Female C57BL/6 mice (4–6-weeks-of-age, 18–20 g; Charles River Laboratories, Wilmington, MA) were obtained for these studies. Mice were housed (five animals/cage) in polycarbonate/polysulfone boxes with microisolator tops in specific pathogen-free facilities maintained at 22 °C with a 50% relative humidity and a 12-h light:dark cycle and acclimated for at least 7 days prior to use. Mice were 5–7-weeks-of-age at the time of the actual experiments. All animals had ad libitum access to a standard laboratory diet and filtered water. All procedures involving animals were conducted under animal use protocols approved by Pfizer’s Institutional Animal Care and Use Committee in compliance with the Guide for Care and Use of Laboratory Animals and all applicable federal regulations.
Drugs, antibodies, and reagents
Drugs were classified as “positive” or “negative” as previously described (Whritenour et al., Citation2014). Specifically, drugs classified as positive have skin rash or hypersensitivity reactions listed on their labels either as a warning (amoxicillin, ofloxacin, and sulfamethoxazole) or box warning (abacavir). Drugs classified as negative (cimetidine and metformin) do not carry a warning of skin rash, hypersensitivity, or multi-organ hypersensitivity on their labels, although hypersensitivity is listed as an adverse reaction on the cimetidine label. Abacavir, amoxicillin, ofloxacin, and sulfamethoxazole (positive control drugs) were obtained from Pfizer Inc. Cimetidine and metformin (negative control drugs) were purchased from Sigma (St. Louis, MO). All drugs were dissolved or suspended in 10% dimethyl sulfoxide (DMSO, Sigma) and prepared at a concentration of 10 mg/ml. Anti-mouse CD8a antibody conjugated with fluorescein Isothiocyanate (FITC) and peridinin chlorophyll protein complex with cyanin-5.5 (Percp-Cy5.5), anti-mouse CD44 antibody conjugated with phycoerythrin (PE), anti-mouse CD197 (CCR7) antibody conjugated with PE-cyanine 7 (PE-Cy7), anti-mouse CD19 antibody conjugated with allophycocyanin (APC), anti-mouse CD3 antibody conjugated with APC-Cyanin7 (APC-Cy7), and anti-mouse CD4 antibody conjugated with PE-Cy7 were purchased from eBiosciences (San Diego, CA). Percp-Cy5.5 anti-mouse CD62L was obtained from Biolegend (San Diego, CA). Anti-mouse CD16/32 and anti-mouse CD4 conjugated with APC-Cy7 were purchased from Becton Dickinson (BD, San Diego, CA).
In vivo exposure
Mouse drug allergy model
The MDAM assay was performed as described by a previous report (Whritenour et al., Citation2014). Briefly, groups of five mice received 200 μl of either vehicle (10% DMSO) or test agent (10 mg/ml) at a dose of 100 mg/kg/day (via subcutaneous injection in the scruff of the neck) on three consecutive days. On Day 6 (3 days after the final dosing), the animals were euthanized via CO2 asphyxiation. The bilateral draining brachial LN were excised and collected for each animal and placed into PBS+ solution (PBS supplemented with penicillin-streptomycin, HEPES buffer, MEM NEAA [minimal essential medium with non-essential amino acids], and L-glutamine) (all Gibco, Grand Island, NY).
Local lymph node assay
The LLNA was conducted based on the ICCVAM protocol (http://ntp.niehs.nih.gov/iccvam/docs/protocols/LLNA-BrdU-ELISA.pdf). Briefly, 2,4-dinitrofluorobenzene (DNFB, Sigma) was prepared in acetone/olive oil (4:1 [v/v]) at a final concentration of 0.25%. On Day 1, 25 μl of DNFB solution or vehicle alone (acetone/olive oil [4:1 v/v]) was applied directly on the dorsum of both ears (five mice/group). These procedures were repeated on Days 2 and 3. After a 2-day rest (i.e. on Day 6), animals were euthanized by CO2 asphyxiation and the auricular lymph nodes of each ear of each mouse were excised and pooled in PBS+.
Anti-CD40L treatment
For anti-CD40L co-treatment studies, mice were injected intraperitoneally with 500 μg/mouse/day of anti-CD40L mAb (eBiosciences) on Days 1, 2, and 3. On each day of dosing, mice also received vehicle, amoxicillin (100 mg/kg; MDAM), or DNFB (0.25%; LLNA) via subcutaneous administration 1 h after the administration of the anti-CD40L antibody.
Lymph node single cell suspension preparation and flow cytometry analysis
Single cell suspensions were prepared by gently rubbing the lymph nodes through a cell strainer. Cells were washed and re-suspended in FACS buffer (eBiosciences). Cell numbers and viability were determined by counting with a cellometer (Nexcelom Bioscience LLC, Lawrence, MA). Fluorescence staining was performed in 96-well V-bottomed microtiter plates. Aliquots of 106 cells/well were incubated with each selected fluorochrome-conjugated monoclonal antibody for 0.5 h at 4 °C in the dark. Labeled cells were then washed twice with FACS buffer and analyzed on a FACSCanto II cytometer (BD). BD FACSdiva Software was used to analyze the data. A minimum of 100,000 events per sample was acquired.
Statistical analysis
One-way ANOVA was performed using Prism 5.0 (Graphpad Software Inc., San Diego, CA). A p-value ≤ 0.05 was considered significant in all comparisons. All data are presented as the mean ± SD or SEM.
Results
Lymphocyte subsets in the draining lymph nodes
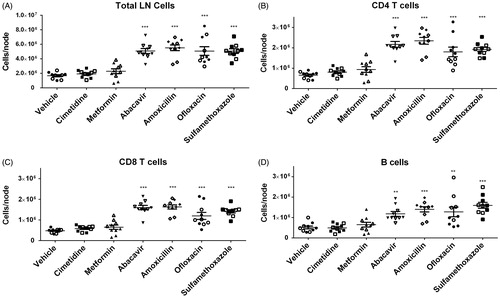
To evaluate the effects of different drugs on changes in lymphocyte subsets, phenotypic analysis of T- and B-cell sub-populations (CD3+CD4+, CD3+CD8+, and CD3-CD19+) of the DLN was performed using flow cytometry. As previously reported in the MDAM, an increase in the total cell number of the DLN from animals administered the positive control compounds (i.e. abacavir, amoxicillin, ofloxacin, and sulfamethoxazole) was observed (). Total numbers of CD4+ T-cells, CD8+ T-cells, and B-cells in the DLN were increased in mice administered positive control drugs (compared to in the animals administered vehicle) (). No difference in total cell count was detected between negative control groups (cimetidine and metformin) and the vehicle group. In addition, no differences were observed in the percentages of the lymphocyte subsets between vehicle and drug treated groups (data not shown).
Figure 1. (A) Absolute total cell counts, as well as (B–D) Total CD4+ and CD8+ T-cells and B-cells from brachial LN of mice treated with vehicle, cimetidine, metformin, abacavir, amoxicillin, ofloxacin, or sulfamethoxazole (SMX). **p < 0.01 or ***p < 0.001; n = 10. Data were combined from two independent experiments with five mice/group/experiment. Each point represents one individual value. All data are expressed as mean ± SEM.
CCR7 expression
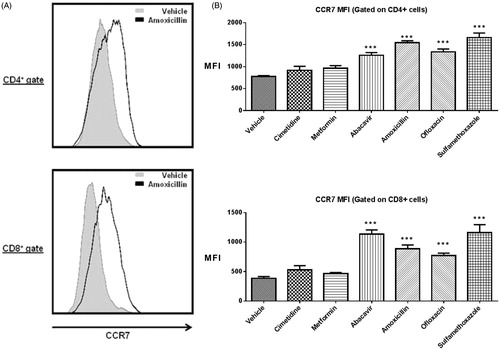
To determine whether cell migration plays a role in the observed increase in DLN cellularity in the MDAM, CCR7 expression on CD4+ and CD8+ T-cells isolated from the DLN of mice was measured and analyzed by flow cytometry (). The mean fluorescence intensity (MFI) of CCR7 surface levels on both CD4+ and CD8+ T-cells was significantly increased in mice administered positive control drugs compared with those administered vehicle or negative control drugs (). In the positive control group, the MFI fold-change above the mean vehicle response for CD4+ T-cells was 1.6 (abacavir), 2.0 (amoxicillin), 1.7 (ofloxacin), and 2.1 (sulfamethoxazole); the MFI fold-change in the CD8+ population was 2.7 (abacavir), 2.3 (amoxicillin), 1.9 (ofloxacin), and 2.9 (sulfamethoxazole). No significant changes in surface CCR7 expression were found in the negative control groups where the MFI fold-changes for the CD4+ subset were 1.2 (cimetidine and metformin), and1.4 (cimetidine) and 1.2 (metformin) for the CD8+ T-cell subset.
Figure 2. (A) Representative histograms showing the up-regulation of CCR7 surface expression on CD4 + and CD8+ cells following amoxicillin treatment. (B) MFI of CCR7 for CD4+ and CD8+ T-cells. ***p < 0.001; n = 10. Data were combined from two independent experiments with five mice/group/experiment. Each point represents one individual value. All data are expressed as mean ± SEM.
Expression of CD62L
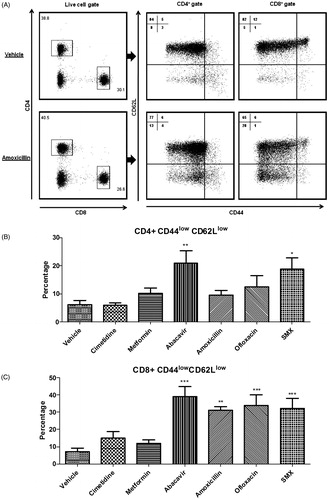
The adhesion molecule CD62L plays an important role in T-cell migration into DLN and can serve as a marker of cellular activation. To investigate changes on this endpoint in the MDAM, CD62L levels were measured following administration of positive and negative control drugs. The T-cell marker CD44 was also included in the staining panel to differentiate between a naïve and an effector memory phenotype (). As shown in , mice treated with positive control drugs had a significantly higher percentage of CD8+ cells expressing a CD44lowCD62Llow phenotype in the DLN compared to vehicle and negative control treated mice. For CD4+ T-cells, significant changes in the percentage of cells expressing a CD44lowCD62Llow phenotype were only observed in animals treated with abacavir and sulfamethoxazole.
Figure 3. (A) Representative dot plots depicting CD44 and CD62L surface staining in DLN following amoxicillin treatment (100 mg/kg). Percentages of CD44lowCD62Llow sub-populations among (B) CD4+ and (C) CD8+ cells isolated from DLN of vehicle and drug-treated mice. *p < 0.05, **p < 0.01, and ***p < 0.001; n = 10. Data were combined from two independent experiments with five mice/group/experiment. Each point represents one individual value. All data are expressed as mean ± SEM.
Expression of Ki67
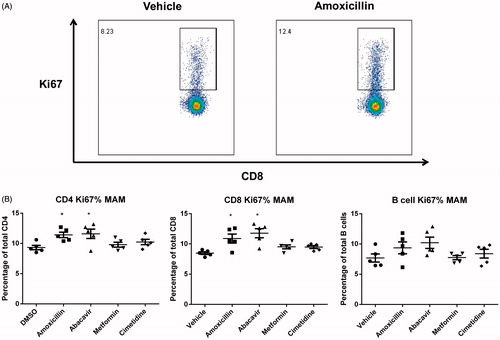
Proliferation of DLN cells was investigated by Ki67 expression (). A mild increase in the percentage of cells expressing Ki67 was observed for CD4+ and CD8+ T-cells present in the DLN of mice administered amoxicillin and abacavir. The mean percentage of Ki67+ CD4+ T-cells in the amoxicillin and abacavir treatment groups was 10.8% and 11.6%, respectively, whereas the average percentage in mice administered metformin and cimetidine were 9.7% and 10.2%, respectively (compared to 9.0% in vehicle group) (). In the CD8+ T-cell population, the mean percentage of Ki67+ cells following amoxicillin, abacavir, metformin, and cimetidine treatment were 11.2%, 13.9%, 9.5%, and 9.4%, respectively, while 8.3% was the mean for the vehicle control group. No significant differences were detected in the B-cell population for any drug tested.
Figure 4. (A) Representative dot-plots of Ki67 staining. (B) Percentage of Ki67+ cells within CD4+, CD8+, and B-cell sub-populations from the DLN of mice administered vehicle, abacavir, amoxicillin, cimetidine, or metformin. *p < 0.05; n = 5. All data are expressed as mean ± SEM.
Comparison of the MDAM and LLNA responses using flow cytometric analysis
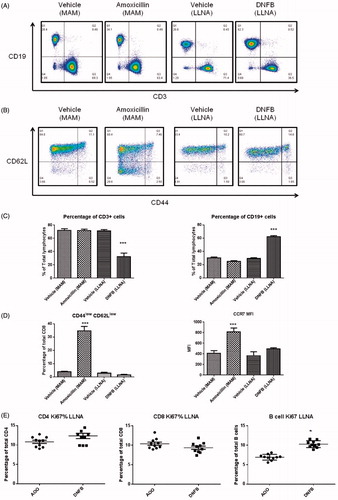
In the present study, amoxicillin (in the MDAM) and DNFB (in the LLNA) were used to compare the DLN responses in these two assays. In the MDAM, amoxicillin (100 mg/kg) treatment resulted in no change in the proportion of CD4+ and CD8+ T-cells and B-cells within the DLN, whereas a significant (2-fold) increase in the percentage of B-cells was observed in the LLNA with the potent skin sensitizer DNFB (). Increased expression of the chemokine receptor CCR7 and down-regulation of CD62L was observed in DLN cells in mice treated with amoxicillin (MDAM), while no changes on these endpoints were observed following DNFB administration (LLNA) (). As shown in , significant increases in Ki67 expression were found in the B-cell population in the DNFB treatment group (10.2%) compared to in the vehicle control group (7.0%). These data are in contrast to that observed for amoxicillin in the MDAM, where only a mild increase in Ki67 expression on the T-cell population was observed ().
Figure 5. Example of dot-plots. (A) CD3+ versus CD19+ cells. (B) CD44 and CD62L expression on CD8+ cells. (C) Percentage of T-cells (CD3+) and B-cells (CD19+). (D) Percentage of CD8+ cells expressing CD44lowCD62Llow and CCR7 mean fluorescence intensity (MFI) in the draining LN following drug treatment in the MDAM and LLNA. (E) Percentage of Ki67+ cells within CD4+, CD8+, and B-lymphocyte sub-populations from the DLN of mice treated with DNFB. *p < 0.05 or ***p < 0.001 compared to vehicle control group; n = 5. Values shown are mean ± SEM.
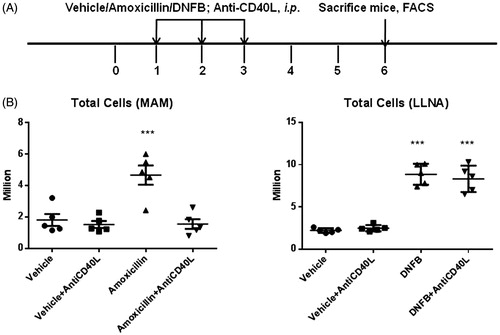
To investigate the role of the co-stimulatory molecule CD40L in the induction of the MDAM and LLNA responses, animals treated with amoxicillin or DNFB were co-treated with anti-CD40L antibody (). Administration of the anti-CD40L antibody inhibited the amoxicillin-induced increase in DLN cellularity in the MDAM (). In contrast, administration of anti-CD40L had no impact on the DNCB-induced increase in DLN cellularity in the LLNA.
Figure 6. (A) Experimental design for anti-CD40L experiments. Mice were administered vehicle, amoxicillin, or DNFB in the presence or absence of anti-CD40L antibody (500 µg on Days 1, 2, and 3). (B) Effects of anti-CD40L treatment on total cell count in DLN in the MDAM and LLNA. ***p < 0.001; n = 5. Values shown are mean ± SEM.
Discussion
In the mouse drug allergy model (MDAM), drugs that cause adverse hypersensitivity responses in the clinic were associated with a marked increase in the cellularity in the LN draining the subcutaneous injection sites (Whritenour et al., Citation2014). To understand the possible underlying mechanisms of such increases in total cell counts, the present study set out to examine the expression of several key markers associated with lymphocyte migration and proliferation and investigate whether they may play a role in the observed increases in MDAM. CCR7, a molecule governing the entry of lymphocytes into the lymph nodes, was significantly up-regulated following administration of positive control drugs. Changes in CCR7 were accompanied by the loss of L-selectin expression and mild increases in Ki67 levels in the T-cell population. The second objective of the present study was to compare the LN responses in the MDAM with those observed in the LLNA. Interestingly, the changes in CCR7 and L-selectin expression described above for positive control drugs in the MDAM were not observed for DNFB in the LLNA. In addition, attenuation of the MDAM response with amoxicillin was observed with anti-CD40L antibody co-administration, whereas the DNFB LLNA response was unaffected by the anti-CD40L antibody treatment.
Although proliferation is generally considered to be one of the factors leading to increased cellularity in the DLN during an immune response, involvement of lymphocyte migration is suggested to play a very important role as well (Forster et al., Citation1999). One of the key chemokine receptors that regulate trafficking and homing of lymphocytes to and within secondary lymphoid organs is CCR7 (Forster et al., Citation2008). CCR7 is expressed by many sub-types of immune cells including T-cells and dendritic cells (Rot & von Andrian, Citation2004); its two ligands, CCL19 and CCL21, are constitutively expressed within the lymph nodes (Forster et al., Citation2008). In this study, CCR7 expression on murine T-cells following subcutaneous injection of drugs associated (or not) with hypersensitivity reactions was investigated. CCR7 levels were significantly higher on CD4+ and CD8+ T-cells in the DLN from animals treated with positive control drugs compared with in mice from the vehicle and negative control groups. Interestingly, such increases in the CD8+ T-cell population are much greater compared with the CD4+ T-cell population. These data indicate that the increase in lymph node cellularity may be partially due to the migration of circulating lymphocytes into the DLN mediated by CCR7. Evidence suggests that lymphocyte migration to lymph nodes is mainly dependent on the expression of CCR7 (Forster et al., Citation1999). In vivo, it has been shown that T-cells fail to home to lymph nodes in CCR7-deficient mice. These mice have severe defects in T-cell and DC migration as well as immune response induction (Forster et al., Citation1999). In addition, it is conceivable that such lymphocyte trafficking may occur as a result of T-cell activation. It has been suggested that up-regulation of CCR7 expression may contribute to continued lymph node homing and facilitate T-cell priming (Noor et al., Citation2010). In addition, CCR7 expression is associated with the strength and duration of T-cell receptor (TCR) ligation (Calabresi et al., Citation2003).
The expression of CD62L was significantly down-regulated on CD4+ cells following abacavir and sulfamethoxazole treatment in the MDAM. Down-regulation of L-selectin expression on CD8+ T-cells was observed for all positive control treated groups and the percentage of CD8+ cells expressing this phenotype was greater than that observed for the CD4+ T-cell population. The majority of CD4+ and CD8+ lymphocytes in control lymph nodes express CD44lowCD62Lhigh that represent a naive phenotype (Mackay et al., Citation1992). The subset of CD44lowCD62Llow cells, which has been referred to as an activated effector phenotype (Wiede et al., Citation2009), was significantly increased after positive control drug treatment and appeared to be a separate sub-population. The loss of expression of L-selectin has been shown to occur after TCR triggering or trans-migration of lymphocyte subsets across the high endothelial venules of peripheral lymph nodes (Chao et al., Citation1997). Combined with the data on the changes of CCR7 surface expression discussed above, it is possible that the CD44lowCD62Llow cell population of T-cells may represent a sub-population of T-cells that migrated into the DLN and became activated upon TCR ligation by the drug/antigen. The decreased expression of CD62L on CD8+ cells may serve as an alternative or additional endpoint that may enhance sensitivity and specificity of the MDAM.
In addition to lymphocyte migration, proliferation represents another mechanism that may lead to increased cellularity in the DLNs. Ki67 is a nuclear protein that is associated with the regulation of cell division. The protein is expressed during all active phases of cell division, but is absent in resting cells (Gerdes et al., Citation1984). Compared with the traditionally used assay for detection of T-cell proliferation which involves incorporation of [3H]-thymidine into the proliferating cells (Payan et al., Citation1983), the Ki67 method enables co-staining of the samples with other phenotypic markers, thus allowing the assessment of changes within each individual lymphocyte sub-population (Bachmann et al., Citation2005). Drugs such as amoxicillin and abacavir induced a mild, but statistically significant, increase in the frequency of Ki67+ T-cells in the DLN. These data suggest that lymphocyte proliferation was promoted with the positive drug treatment and may also have contributed to the increased cell number in the MDAM.
The LLNA has been used extensively as a tool to predict for contact sensitization potential. However, the assay has been demonstrated not to be a predictive model for systemically-administered drugs; this may be partially due to the routes of administration and drug absorption. On the other hand, the MDAM has shown to be predictive for HR reactions with systemically administered drugs. While both assays demonstrate an increase in DLN cellularity following administration of positive control drugs/chemicals, whether or not the mechanisms driving the response are similar is not known. In the present study, phenotypic differences in lymphocyte subsets were compared between the MDAM and the LLNA. Although an increase in the DLN total cell count in the MDAM positive control groups was observed, none of the positive or negative control drugs produced significant changes in the percentages of T- and B-cell sub-populations. The total cell number increase in the MDAM was due to a proportional increase in both T- and B-cells.
For the LLNA, it has been reported that contact sensitizers cause a significant increase in the B/T ratio (Jung et al., Citation2012; Lee et al., Citation2004; Manetz & Meade, Citation1999; Sikorski et al., Citation1996). In the current study, compared with the vehicle group, the percentage of the B-cell population greatly increased ≈2-fold to 60% after DNFB treatment. These data suggest that the mechanisms driving the MDAM responses are due to increases in B- and T-cell counts while, in the LLNA, changes are driven primarily by increases in B-cells. In the current study, ≈10% of the total B-cells are Ki67+; this appears to be in contrast with stimulation index results reported for DNFB in the LLNA using [3H]-thymidine incorporation as the endpoint (Woolhiser et al., Citation2000). This could potentially be due to differences in sensitivity between the two methods.
Effects amoxicillin and DNFB had on the T-cell surface marker expression of CD62L was also compared between the MDAM and LLNA. In the MDAM, amoxicillin induced a significant down-regulation of CD62L expression on T-cells, an outcome not observed for DNFB in the LLNA. This finding in the LLNA is consistent with a previous report, where no changes in the population of CD44lowCD62Llow cells were observed for DNFB (Larsen et al., Citation2007). The loss of CD62L expression has been closely associated with the activation status of T-cells (Chao et al., Citation1997). Therefore, the time course and underlying mechanisms of T-cell activation appears to differ between amoxicillin in the MDAM and DNFB in the LLNA. The potential differences in mechanism are further supported by the results from direct blocking of CD40L, a co-stimulatory molecule tightly regulated and induced by TCR ligation (Daoussis et al., Citation2004). Whereas MDAM responses were inhibited by anti-CD40L treatment, DNFB LLNA responses were not affected. Taken together, these data suggest a difference in the mechanisms involved in the DLN response between the two assays. However, it should be noted that only amoxicillin and DNFB were tested in our study. Other compounds and contact sensitizers may act through different mechanisms involving different pathways. Additional drugs need to be tested and compared in both models to further confirm the above results.
Conclusions
Data from the present study suggest that the DLN response in the MDAM with drugs associated with hypersensitivity reactions may be due to an increase in T- and B-cells that is characterized by a mild increase in proliferating T-cells and increased numbers of activated T-cells migrating into the DLN (CD62L down-regulation and increased CCR7 expression). In addition, the data indicate that the mechanisms behind the MDAM and LLNA responses may differ.
Declaration of interest
The authors report no conflicts of interest. The authors alone are responsible for the content and writing of the paper.
Acknowledgments
The authors would like to thank Ellen Evans (Pfizer) for her review and helpful comments on the manuscript.
References
- Adkinson N. F. Jr., Essayan, D., Gruchalla, R., et al, the Health & Environmental Sciences Institute Task Force. 2002. Task force report: Future research needs for the prevention and management of immune-mediated drug hypersensitivity reactions. J. Allergy Clin. Immunol. 109:S461–S478
- Bachmann, M. F., Wolint, P., Schwarz, K., et al. 2005. Functional properties and lineage relationship of CD8+ T-cell subsets identified by expression of IL-7 receptor alpha and CD62L. J. Immunol. 175:4686–4696
- Bloksma, N., Kubicka-Muranyi, M., Schuppe, H. C., et al. 1995. Predictive immunotoxicological test systems: Suitability of the popliteal lymph node assay in mice and rats. Crit. Rev. Toxicol. 25:369–396
- Calabresi, P. A., Allie, R., Mullen, K. M., et al. 2003. Kinetics of CCR7 expression differ between primary activation and effector memory states of TH1 and TH2 cells. J. Neuroimmunol. 139:58–65
- Chao, C. C., Jensen, R., and Dailey, M. O. 1997. Mechanisms of L-selectin regulation by activated T-cells. J. Immunol. 159:1686–1694
- Cose, S. C., Joens, C. M., Wallace, M. E., et al. 1997. Antigen-specific CD8+ T-cell subset distribution in lymph nodes draining the site of herpes simplex virus infection. Eur. J. Immunol. 27:2310–2316
- Daoussis, D., Andonopoulos, A. P., and Liossis, S. N. 2004. Targeting CD40L: A promising therapeutic approach. Clin. Diagn. Lab. Immunol. 11:635–641
- Elgueta, R., Benson, M. J., de Vries, V. C., et al. 2009. Molecular mechanism and function of CD40/CD40L engagement in the immune system. Immunol. Rev. 229:152–172
- Finlay, D., and Cantrell, D. A. 2011. Metabolism, migration and memory in cytotoxic T-cells. Nat. Rev. Immunol. 11:109–117
- Forster, R., Davalos-Misslitz, A. C., and Rot, A. 2008. CCR7 and its ligands: Balancing immunity and tolerance. Nat. Rev. Immunol. 8:362–371
- Forster, R., Schubel, A., Breitfeld, D., et al. 1999. CCR7 coordinates the primary immune response by establishing functional microenvironments in secondary lymphoid organs. Cell 99:23–33
- Gerdes, J., Lemke, H., Baisch, H., et al. 1984. Cell cycle analysis of a cell proliferation-associated human nuclear antigen defined by the monoclonal antibody Ki-67. J. Immunol. 133:1710–1715
- Gomes, E. R., and Demoly, P. 2005. Epidemiology of hypersensitivity drug reactions. Curr. Opin. Allergy Clin. Immunol. 5:309–316
- Inchley, C. J. 1987. The contribution of B-cell proliferation to spleen enlargement in Babesia microti-infected mice. Immunology 60:57–61
- Jung, K. M., Jang, W. H., Lee, Y. K., et al. 2012. B-Cell increases and ex vivo IL-2 production as secondary end-points for the detection of sensitizers in non-radioisotopic local lymph node assay using flow cytometry. Toxicol. Lett. 209:255–263
- Kimber, I., Dearman, R. J., Basketter, D. A., et al. 2002. The local lymph node assay: Past, present and future. Contact Dermatitis 47:315–328
- Larsen, J. M., Geisler, C., Nielsen, M. W., et al. 2007. Cellular dynamics in the draining lymph nodes during sensitization and elicitation phases of contact hypersensitivity. Contact Dermatitis 57:300–308
- Lee, J. K., Hee Park, S., Byun, J. A., et al. 2004. Evaluation of lymphocyte subpopulations in draining lymph node cells following allergen and irritant. Environ. Toxicol. Pharmacol. 17:95–102
- Liu, Q., Chen, T., Chen, G., et al. 2007. Triptolide impairs dendritic cell migration by inhibiting CCR7 and COX-2 expression through PI3-K/Akt and NF-κB pathways. Mol. Immunol. 44:2686–2696
- Mackay, C. R., Marston, W., and Dudler, L. 1992. Altered patterns of T-cell migration through lymph nodes and skin following antigen challenge. Eur. J. Immunol. 22:2205–2210
- Manetz, T. S., and Meade, B. J. 1999. Development of a flow cytometry assay for the identification and differentiation of chemicals with the potential to elicit irritation, IgE-mediated, or T-cell-mediated hypersensitivity responses. Toxicol. Sci. 48:206–217
- Masopust, D., and Schenkel, J. M. 2013. The integration of T-cell migration, differentiation, and function. Nat. Rev. Immunol. 13:309–320
- Mauri C., and Bosma, A. 2012. Immune regulatory function of B-cells. Annu. Rev. Immunol. 30:221–241
- Noor, S., Habashy, A. S., Nance, J. P., et al. 2010. CCR7-dependent immunity during acute Toxoplasma gondii infection. Infect. Immun. 78:2257–2263
- Payan, D. G., Brewster, D. R., and Goetzl, E. J. 1983. Specific stimulation of human T-lympho-cytes by substance P. J. Immunol. 131:1613–1615
- Rot, A., and von Andrian, U. H. 2004. Chemokines in innate and adaptive host defense: Basic chemokinese grammar for immune cells. Annu. Rev. Immunol. 22:891–928
- Sikorski, E. E., Gerberick, G. F., Ryan, C. A., et al. 1996. Phenotypic analysis of lymphocyte subpopulations in lymph nodes draining the ear following exposure to contact allergens and irritants. Fundam. Appl. Toxicol. 34:25–35
- Sordi, V., Bianchi, G., Buracchi, C., et al. 2006. Differential effects of immunosuppressive drugs on chemokine receptor CCR7 in human monocyte-derived dendritic cells: Selective upregulation by rapamycin. Transplantation 82:826–834
- Thong, B. Y., and Tan, T. C. 2011. Epidemiology and risk factors for drug allergy. Br. J. Clin. Pharmacol. 71:684–700
- von Andrian, U. H., and Mempel, T. R. 2003. Homing and cellular traffic in lymph nodes. Nat. Rev. Immunol. 3:867–878
- Weaver, J. L., Chapdelaine, J. M., Descotes, J., et al. 2005. Evaluation of a lymph node proliferation assay for its ability to detect pharmaceuticals with potential to cause immune-mediated drug reactions. J. Immunotoxicol. 2:11–20
- Whritenour, J., Cole, S., Zhu, X., et al. 2014. Development and partial validation of a mouse model for predicting drug hypersensitivity reactions. J. Immunotoxicol. 11:141–147
- Wiede, F., Roomberg, A., Cretney, E., et al. 2009. Age-dependent, polyclonal hyperactivation of T-cells is reduced in TNF-negative gld/gld mice. J. Leukocyte Biol. 85:108–116
- Woolhiser, M. R., Munson, A. E., and Meade, B. J. 2000. Comparison of mouse strains using the local lymph node assay. Toxicology 146:221–227