
Abstract
Transcriptional profiling is a powerful tool to study biological mechanisms during stem cell differentiation and reprogramming. Genome-wide methods like microarrays or next generation sequencing are expensive, time consuming, and require special equipment and bioinformatics expertise. Quantitative RT-PCR remains one of today’s most widely accepted and used methods for analyzing gene expression in biological samples. However, limitations in the amount of starting materials often hinder the quantity and quality of information that could be obtained from a given sample. Here, we present a fast 4-step workflow allowing direct, column-free RNA isolation from limited human pluripotent stem cell (hPSC) cultures that is directly compatible with subsequent reverse transcription, target specific multiplex pre-amplification, and standard SYBR-Green quantitative PCR (qPCR) analysis. The workflow delivers excellent correlations in normalized gene-expression data obtained from different samples of hPSCs over a wide range of cell numbers (500–50,000 cells). We demonstrate accurate and unbiased target gene quantification in limiting stem cell cultures which allows for monitoring embryoid body differentiation and induced pluripotent stem cell (iPSC) reprogramming. This method highlights a rapid and cost effective screening process, allowing reduction of culture formats and increase of processing throughputs for various stem cell applications.
Introduction
Assessing pluripotency and differentiation capacities of human embryonic or induced pluripotent stem cell lines is a challenging process. Due to obvious ethical restrictions, powerful in vivo experiments, like chimera formation to test lineage commitment of human pluripotent stem cell (hPSC) during embryonic development, are not possible in humans [De Los Angeles et al. Citation2012]. Microarray analysis and next-generation sequencing are whole-genome methods allowing the characterization of stem cell cultures by comparing them to established human embryonic stem cell (hESC) or induced pluripotent stem cell (iPSC) lines [Williams et al. Citation2011]. However, these methods are expensive, time consuming, and often require core facilities and bioinformatics expertise. Hence, before conducting these comprehensive experimental approaches, routine assessment of hPSC cultures is usually performed for a restricted number of targets using immunocytochemistry, flow cytometry, or mRNA analysis [Marti et al. Citation2013]. Quantitative RT-PCR (RT-qPCR) remains one of the most commonly used and accepted methods for control assessment of stem cell cultures. Key advantage of RT-qPCR is that it is a cost-effective approach to generate highly quantitative gene expression data across a large number of samples for defined targets [Pal et al. Citation2013]. However, standard column-based RNA extraction protocols require a relatively large amount of starting materials, which are often not obtainable in certain stem cell research experiments. Therefore micro samples are often not extractable, limit the number of analyzable targets, or show varying quality of results.
Here, we developed a workflow, allowing precise quantification of mRNA expression levels in micro samples of several hundred to several thousand cells for 100 stem cell specific targets. This workflow allows direct analysis of growing hESC/hiPSC colonies without the need for sacrificing or re-passaging culture vessels. Furthermore, it can be used to analyze hPSC differentiation during embryoid body (EB) formation down to the single EB level. The minimal starting material required for this method, and the large target numbers that can be accurately quantified, allow reduction in culture vessel formats, thereby enabling more economical high-throughput screenings of stem cell cultures.
Results and Discussion
Design and validation of the workflow
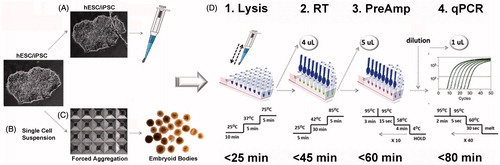
We developed a workflow (), which allows transcriptional profiling for a large number of targets from micro samples of hPSC cultures using standard SYBR-Green quantitative PCR (qPCR) analysis. Samples such as small colony biopsies of hESC/hiPSC cultures (), dissociated single cells or individual embryoid bodies () are collected and a genomic DNA (gDNA)-free total RNA lysate is generated in a single pipetting step (). Complementary DNA (cDNA) is synthesized by standard reverse transcription and, in a subsequent pre-amplification (Pre-Amp) reaction, parallel enrichment of 100 specific targets, including stem cell markers, a gDNA contamination control and 5 reference genes, is achieved. Quantification of the enriched targets is then performed by qPCR analysis.
Figure 1. Development of a workflow for gene expression profiling of human pluripotent stem cell (hPSC) micro samples. Samples from human embryonic stem cell (hESC) or human induced pluripotent stem cell (hiPSC) cultures were collected from (A) colony biopsy, scraped and aspirated using a pipette tip from monolayers covered with PBS; or from (B) enzymatically dissociated cells, washed, and spun down in PBS. (C) Uniform embryoid bodies (EBs) were formed by forced aggregation of dissociated cells in AggreWell400 plates. Individual EBs were washed in PBS and transferred to lysis buffer containing proteinase K and DNAse. (D1) Cell lysis and gDNA clearance was performed using a 3-step temperature protocol in a thermocycler. (D2) 4 µl of the lysate was used in a reverse transcription (RT) reaction. (D3) For pre-amplification (Pre-Amp) of specific targets, 5 µl of cDNA was used in a 50 µl Pre-Amp reaction containing 100 distinct primer pairs. (D4) Enriched samples were diluted 1:5 to 1:10 in ddH2O, and 1 µl of diluted sample was used in subsequent SYBR-Green quantitative PCR (qPCR) reactions.
Firstly, we verified that this workflow produces unbiased and reproducible gene expression data from freshly isolated human stem cell culture samples. Uniform EBs were generated in a large scale format by forced aggregation of dissociated CA1 cells (∼650 cells/EB; ). After 15 days of growth in suspension culture, 5 EBs (∼5000 cells/EB) were randomly collected and immediately transferred to the lysis reaction. Quantitative PCR expression data were obtained from both the Pre-Amp reaction and the non-amplified starting cDNA sample. Comparison of expression data (Cq values) for expressed targets revealed excellent correlation (R2 = 0.994) between corresponding samples (). This example shows that multiplex Pre-Amp works for targets of varying expression levels (Cq 21-32 in cDNA sample), and further demonstrates the absence of carry-over inhibition that could be introduced during sample collection. Only targets with a Cq ≤ 32 were included into the study. Targets with Cq ≥ 32 are within the low copy detection limit of qPCR, at which confounding variation due to stochastic nature of sampling is observed. Although highly optimized assays (efficiency > 90%) significantly improve single copy detection by qPCR, the precision in quantification is generally poor, requiring different approaches to correctly assess gene expression values [Bernardo et al. Citation2013; Kralj and Salit Citation2013].
Figure 2. Evaluation of the workflow. Key to pre-amplification (Pre-Amp) is to retain the specific gene expression profile of the original cDNA sample. (A) Illustration of the analytical deduction of expected (theoretical) ΔCq between starting cDNA material and Pre-Amp sample for any given target. 10 cycles of Pre-Amp results in ∼1000 fold enrichment of specific targets: For instance 5 µl of cDNA with 1 copy/µl result in 5,000 copies/Pre-Amp reaction. Considering a dilution of 1:5, a 20 fold increase in targets (20 copies/µl) is achieved, representing a shift in about 4.3 Cq values. Thus, an unbiased Pre-Amp reaction generates a ΔCq value close to the theoretical value of 4.3. The difference (ΔΔCq) between experimental (ΔCq) and theoretical Cq (4.3) results in a value equal to zero. A tolerance range of ± 0.75 Cq is applied. (B) Expression data were obtained from day 15 EBs using the PrimePCR human embryonic stem cell (hESC) panel. Pre-Amp values reveal an excellent correlation (R2 = 0.994) to corresponding cDNA material for all 57 expressed targets. (C) Bias assessment for the Pre-Amp reaction compared to starting cDNA (ΔΔCq) displays minimal bias, within the tolerance range of ± 0.75 Cq. (D) Performing three independent Pre-Amp and quantitative PCR (qPCR) reactions from the same cDNA sample proves excellent reproducibility for expression data for all targets (target numbers as listed in Supplemental Table 1). 96.5% of targets (55 out of 57) are within the tolerance range of +/− 0.75 Cq. The average standard deviation of 3 independent Pre-amp experiments is ±0.09 ΔΔCq (0.02–0.17). All targets with Cq ≤ 32 in starting cDNA samples were analyzed.
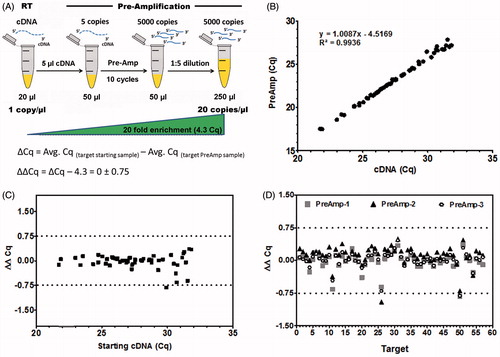
To assess the extent of bias that could be introduced by Pre-Amp, a simple mathematical calculation taking amplification cycles and sample dilution into account, is applied (). Pre-Amp using 10 cycles leads to a ∼1,000-fold enrichment of specific target sequences of the original cDNA sample. Considering respective dilutions of samples, a theoretical shift in Cq values for targets detected in the Pre-Amp, compared to the starting cDNA sample (ΔCq), is expected. The difference of the theoretical (expected) compared to the experimental (detected) values (ΔΔCq), reflects the bias of the Pre-Amp reaction. In this workflow the Pre-Amp reaction introduces minimal bias within a ΔΔCq range of less than ±0.75 Cq compared to the theoretical or expected value. This range is defined as the tolerance range for bias introduced by the multiplex Pre-Amp reaction chemistry in combination with validated primers (). Low abundant targets show higher bias compared to highly expressed targets due to sampling ambiguity and stochastic behavior. However, this is inherent also in standard PCR/qPCR experiments and not specifically occurring in pre-amplification reactions.
In addition, Pre-Amp is highly reproducible when comparing data from three independent experiments analyzing the same cDNA sample (). Thus, the workflow is compatible with gene expression profiling from hPSC samples: It allows multiplex Pre-Amp of stem cell markers, introduces minimal to no bias, and is highly reproducible, which is of great importance when biological samples are collected or processed at different time points and subsequently combined with existing gene expression studies.
Monitoring EB differentiation
EB formation is a widely performed standard procedure in hPSC research to promote differentiation into cells of all germ layers [Dang et al. Citation2004]. EB propagation is often assessed by qPCR to monitor effects of culture media, growth factors, or other aspects on lineage differentiation [Kibschull et al. Citation2011; Ungrin et al. Citation2008]. We applied the workflow to study target gene expression profiles in differentiating EBs compared to undifferentiated hESC, and assessed bias introduced by Pre-Amp when working with normalized gene expression data (). For normalization [Vandesompele et al. Citation2002] the 3 out of 6 most stably expressed reference target genes were used (see Real-time PCR analysis section below). EBs were cultured for 7 days with 15% FBS, which induces rapid random differentiation as indicated by down-regulation or repression of multiple pluripotency associated genes compared to undifferentiated hESC monolayers (). Normalized gene expression data show matching regulations for targets in Pre-Amp and cDNA samples (). The detected error in expression data introduced by Pre-Amp is within a very tight fold change range between +1.38 (CDK1) and −0.37 (SOX15) (). This demonstrates the robustness of the workflow for normalized gene expression data, when comparing two independent biological samples. In this experiment EBs showed differentiation into mesodermal lineages as indicated by the up-regulation of 6 mesodermal markers and the meso-/ectodermal marker NCAM1 (). The mesodermal marker endoglin (ENG) showed divergent expression data in Pre-Amp and cDNA samples, probably due to the low abundance of this target (Cq = 31.5) in the starting cDNA sample. This highlights again the need of conservative interpretation of qPCR data when targets reach the threshold of Cq = 32. Amplification data on low-abundant target samples are subject to Poisson-distribution due to stochastic sampling effects. Such samples can be more confidently analyzed by increasing the number of technical replicates for SYBR-Green based qPCR [Bernardo, et al. Citation2013; Kralj and Salit Citation2013; Tellinghuisen and Spiess Citation2015].
Figure 3. Monitoring lineage differentiation in embryoid bodies (EBs). Gene expression profiling of EBs using random differentiation by FBS for 7 days (A–F) or specific lineage induction using defined culture conditions (G–H). Graphs show normalized gene expression data for Pre-Amp (PA) and corresponding cDNA samples of randomly differentiating EBs compared to undifferentiated human embryonic stem cell (hESC) (A, C, E). Down-regulated or repressed pluripotency markers (A) indicate extensive differentiation of cells. Predominantly mesodermal markers are up-regulated (E). When comparing Pre-Amp and cDNA sample, 45 out of 47 targets (95.7%) show excellent correlation of expression data, within the fold change range of ± 2 (B, D, F). Endoglin (ENG) show up-regulation of expression in both samples, but divergent levels, most likely due to low abundance (Cq = 31.5) of transcripts in the CA1 reference sample. Specific lineage induction by serum free culture of EBs supplemented with BMP4, activin A, and bFGF were analyzed at days 7, 14, and 21 using Pre-Amp samples (G–I). Data demonstrate temporal regulation of early ectodermal (G) and early mesodermal lineages (H) indicated by a temporal regulation of specific markers and progressive loss of pluripotent cells (I).
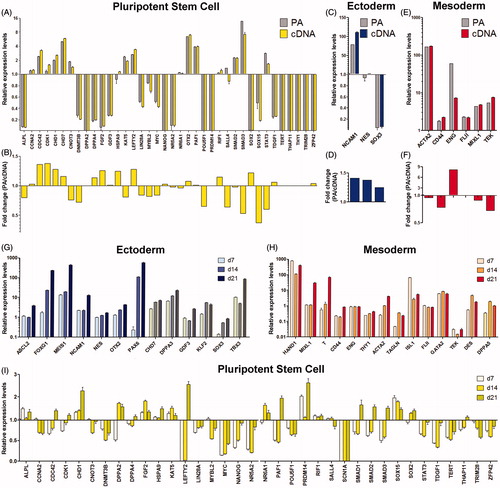
Next, we monitored time-dependent EB differentiation, induced by the addition of specific growth factors to defined serum free medium, which is performed to induce precursor cell differentiation for subsequent analysis and isolation of specific cell types, i.e., by flow cytometry [Outten et al. Citation2012; Yang et al. Citation2008]. EBs were cultured in a 96 well micro format with 50 µl of medium containing the growth factors BMP4, activin A, and bFGF. At days 7, 14, and 21 EBs were collected, processed, and gene expression profiles of Pre-Amp samples were compared to undifferentiated CA1 (). Several markers show a time dependent regulation of expression, indicating progressive differentiation into early neuroepithelial (PAX6, FOXG1, MEIS1, NCAM1, TBX3; ) as well as into early mesodermal (Hand1, MIXL1, T (brachyury)) cells within 21 days [Esmailpour and Huang Citation2012; Zhang et al. Citation2008]. ACTA2, TAGLN, and ISL1 indicate differentiation of muscle precursors as expected for these conditions [Outten et al. Citation2012; Werth et al. Citation2010; Yang et al. Citation2008], whereas hematopoietic/endothelial markers FLII, GATA2, TEK indicate no major changes in this lineage [Song et al. Citation2009]. Expression of pluripotency markers indicate a much slower progression of EBs compared to EB differentiation in FBS (). Endodermal markers were absent or expressed at extremely low levels (Cq < 29) after 21 days of EB differentiation, indicating the presence of trace endodermal cells (data not shown). In general, this demonstrates that the workflow is of great value to monitor progression of lineage formation during complex and cost intensive EB differentiation screenings. It allows generation of gene expression data from micro samples of EB cultures, down to the individual EB level, and enables researchers to evaluate the quality of their differentiation approaches by analyzing large numbers of specific stem cell markers.
Comparing small biopsies from hPSC cultures
RNA profiling from hPSC cultures using column based RNA-purification methods requires a large amount of cells, typically obtained by using a replica culture vessel. Using the newly designed workflow we analyzed tiny colony biopsies ranging from a few hundred to a few thousands of cells scraped from a CA1 culture (), and compared the expression profile of these biopsies to 50,000 CA1 cells isolated by standard enzymatic dissociation. Samples were also collected from different cultures and passages of CA1, and individually processed to assess reproducibility of the workflow. A representative comparison of two samples (a small colony biopsy and a sample of dissociated cells) is shown in . Plotting normalized Pre-Amp gene expression data shows excellent correlation between the samples for targets with Cq ≤ 30 (). Targets with Pre-Amp Cq > 30 were excluded from analysis due to stochastic effects observed for low abundant targets as discussed previously in the Design and validation of the workflow section above and as displayed by reduced correlations in . In addition, the different amount of cells analyzed between the colony biopsy and the enzymatically isolated cells is around 32-fold, as indicated by the marker POU5F1 (OCT4) showing a Cq ∼ 22 in the biopsy compared to Cq ∼ 17 in the well. Despite this big difference in starting material the workflow delivers excellent correlation of quantitative marker gene expression. Overall, this result shows that this workflow can be applied to characterize biopsies of selected hPSC colonies, delivering reproducible and reliable gene expression data from varying cell numbers, and thus, is ideally applied to situations where only limited numbers of stem cells are available and a large number of markers need to be analyzed. We have tested the workflow on hPSC colonies consisting of as little as 50 cells and observed linearity of gene expression data when compared to larger sample sizes (data not shown).
Figure 4. Analyzing hPSC cultures at a micro sample format. Graphs show a comparison of gene expression data obtained by pre-amplification (Pre-Amp) analysis from a small colony biopsy of CA1 (∼1,000 cells) vs. a dissociated CA1 culture sample (∼50,000 cells) (A, B), and an iPSC colony biopsy vs. CA1 (C, D). Normalized gene-expression data for each detected target are plotted on x1, y1 axes. The corresponding Cq values for each target are shown on x2, y2 axes. Dotted lines indicate a fold-change range of ±3.68 (21 + 20.75; qPCR error range + Pre-Amp tolerance range). Selected targets for all germ layers are indicated. (A) Comparison of two representative samples of CA1 cultures isolated and processed separately; show strongly correlating Pre-Amp gene expression data, for targets with Cq ≤ 30. (B) Reduced correlation of expression data are observed with Pre-Amp Cq > 30 (single copy detection range). (C) Comparison of a representative iPSC colony biopsy at the first passage (P1) after initial isolation, reveal a highly comparable expression profile, especially of pluripotency markers, compared to CA1. (D) Targets with Cq < 30 show strongly correlating gene expression data between the two analyzed samples. The workflow allows accurate gene expression profiling at earliest stages of reprogramming for quality control and colony selection.
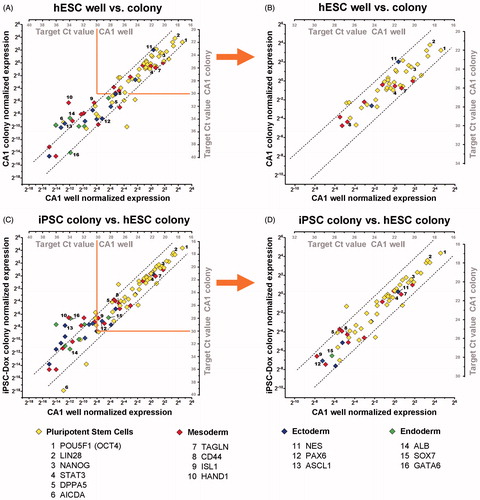
Next, we explored the potential of applying this method for gene expression profiling during early stages of iPSC reprogramming. Currently, the criteria for iPSC colony selection still rely on morphological observation and selection based on researcher’s experience. Established colonies are then characterized in depth by genomic and proteomic approaches when sufficient material is available. Using this workflow, we analyzed newly derived iPSC colonies obtained from reprogramming human embryonic fibroblasts [Woltjen et al. Citation2011]. A small section of the colony was dissected at the first passage (P1), and the Pre-Amp gene expression profile was compared to the hESC line CA1 (). The iPSC colony biopsy shows an excellent correlation for analyzed markers with Cq ≤ 30 (): in particular the pluripotency markers show a strong similarity between the iPSC colony to the hESC line CA1. This implies that the reprogramming procedure was successful and that the iPSC colony is pluripotent. Therefore, this workflow could be used for initial classification of iPSC colonies, potentially as early as when initial colonies become visible, and can serve as an efficient screening tool for pre-selecting promising iPSC colonies. Identifying effective markers for iPSC quality assessment currently is a critical and highly discussed area in the stem cell field [Bock et al. Citation2011; Maddah et al. Citation2014]. As this information becomes available, this workflow, due to its large scale gene expression profiling capacity, can be integrated in comprehensive screenings to separate ‘good’ from ‘bad’ iPSC clones.
Conclusions
We demonstrate a workflow that enables large scale gene expression profiling of hESC and hiPSC cultures with minimal sample consumption, and more importantly provides fast, reproducible, and unbiased quantitative results within one work day. The one-step generation of a gDNA-free total RNA lysate, which is compatible with all subsequent reactions, makes it adaptable to automated handling and high-throughput screening applications. Multiplex Pre-Amp of 100 specific stem cell targets shows accurate results over a wide expression range, and the primer pool can be customized to address specific questions in research studies. Importantly, gene expression data from samples collected and processed at different time points, and from different culture formats, allows continuous addition of samples to an existing study without compromising accuracy of data. The reduction in starting sample sizes will not only provide economic benefits, but will also improve the chance of obtaining gene expression data from micro samples.
Materials and Methods
Cell cultures
The human embryonic stem cell line CA1 [Adewumi et al. Citation2007] was derived in the laboratory of Dr. A. Nagy at the Mount Sinai Hospital, Toronto, Ontario, Canada. It is approved by the Stem Cell Oversight Committee (SCOC) at the Canadian Institute of Health Research (CIHR) and registered in the Human Embryonic Stem Cell Registry (#0137) at the National Institute of Health (NIH). CA1 was routinely cultured on Geltrex matrix (Life Technologies, Mississauga, ON, Canada) in mTeSR1 complete medium (Stem Cell Technologies, Vancouver, BC, Canada). Medium was changed every other day and cultures were passaged weekly as single cell suspensions using TrypLE (Life Technologies). The ROCK (rho-associated kinase) inhibitor Y-27632 (Cayman Chemicals, Ann Arbor, MI, USA) was applied at 10 µM to the cultures 1 h prior to dissociation and for 24 h post-passaging.
Uniform EBs of each 6 x 10⁵ cells were generated as previously described [Kibschull et al. Citation2011] using AggreWell400 plates and AggreWell medium (Stem Cell Technologies). For random differentiation, EBs were transferred to ultra-low adhesion dishes (Corning, Tewksbury, MA, USA) containing 15% fetal bovine serum (FBS) in DMEM/F12, supplemented with 0.1 mM non-essential amino acids, 2 mM GlutaMAX, 0.2 mM sodium pyruvate, 0.1% (w/v) bicarbonate, 0.1 mM β-mercaptoethanol, 100 U/mL penicillin, and 0.1 mg/mL streptomycin (all Life Technologies). For serum-free differentiation, 10 EBs were transferred to a 96-well ultra-low adhesion plate (Corning) containing 50 µl of STEMdiff APEL medium (Stem Cell Technologies) with 10 ng/mL BMP4, 10 ng/mL activin A, and 5 ng/mL bFGF (all R&D Systems, Minneapolis, MN, USA). Plates were incubated at 5% O2, 5% CO2 and medium was changed every 4 d.
For iPSC derivation, the human embryonic fibroblast line XHEFb [Kibschull et al. Citation2011] was plated at 105 cells in a gelatin coated 6 cm dish as previously described [Woltjen et al. Citation2011]. The next day cells were transduced with each 106 lentiviral particles of the doxycycline (dox) inducible vector pTetO-FUW-OKSM, expressing the four factors Oct4, Klf-4, Sox2 and c-Myc, and pFUW-M2rtTA encoding the reverse trans-activator [Brambrink et al. Citation2008]. Lentivirus was prepared as previously described [Yu et al. Citation2013]. Twenty-four h post transduction cells were passaged onto Geltrex coated 6 well plates in TesR-E7 medium (Stem Cell Technologies) supplemented with 1.5 µg/mL dox (Sigma, Mississauga, ON, Canada) and cultured for 20 d until iPSC-like colonies appeared (P0). Individual colonies were mechanically passaged 1:2 onto Geltrex coated 4well plates (ThermoFisher, Waltham, MA, USA) in mTeSR1 with or without dox (P1). Dox-independent growing clones were analyzed at P1.
Sample collection and lysis
Cell lysis was conducted by depositing samples into 50 µL freshly prepared SingleShot buffer (48 µL buffer, 1 µL DNase, 1 µL proteinase K; Bio-Rad, Hercules, CA, USA) pre-loaded into PCR tubes. All samples were collected in ≤5 µL of PBS. For colony biopsy collection, cultures were washed with PBS and then covered with a thin layer of PBS. Using an inverted microscope, small parts of hPSC colonies were cut using a glass scalpel, aspirated using a 200 µL lab pipette, and transferred into the lysis buffer. Dissociated single cells were isolated by TrypLE (Life technologies) digestion of monolayers followed by a wash in PBS. Cells were then counted using a CASY cell counter (Roche, Laval, QC, Canada), and aliquots containing specific cell numbers were spun down in a micro tube at 250 x g for 5 min. Supernatant was removed and cell pellets were re-suspended in lysis buffer. EBs were briefly washed twice in PBS droplets to remove buffer components and debris. They were then collected, using a 200 µL pipette tip, and transferred into pre-plated lysis buffer. Reaction tubes or plates were then placed into a thermocyler (Eppendorf, Mississauga, ON, Canada) and incubated for 10 min at 21°C for cell lysis, 5 min at 37°C for gDNA elimination, and 5 min at 75°C for enzyme inactivation. Lysates were stored at −80°C.
cDNA synthesis and pre-amplification
Four microliter of gDNA-free total RNA lysates generated as indiated in the Sample collection and lysis step above were used in a standard reverse transcription reaction using the iScript reserve transcription supermix (Bio-Rad) according to manufacturer’s instructions. Target-specific Pre-Amp was conducted by transferring 5 µL of the RT-reaction in a 50 µL PCR reaction containing: 25 µL SsoAdvanced PreAmp supermix (Bio-Rad), and 5 µL of the hESC PrimePCR assay pool (Supplemental Tables 2 and 3; Bio-Rad). Pre-Amp reactions were activated at 95°C for 3 min, and targets were enriched for 10 cycles at: denaturation at 95°C for 15 s followed by an annealing/amplification step at 58°C for 4 min. Reactions were stored at −20°C.
Real-time PCR analysis
Expression profiling using qPCR was performed using 1:4 diluted RT reactions (no PreAmp control) and 1:5 – 1:10 diluted Pre-Amp reactions. Each qPCR reaction contained 1 µL of diluted template, 1x SsoAdvanced universal SYBR supermix (Bio-Rad) and 1x PrimePCR assays. Reactions were performed in 4 technical replicates at 10 µL final volume. Real-time PCR was performed using the CFX384 real-time PCR systems (Bio-Rad): activation at 95°C for 2 min, 40 cycles of denaturation at 95°C for 5 s and annealing/elongation at 60°C for 30 s. Specificity of target amplification was confirmed by melting-curve analysis (Supplemental Figure 1). Expression data were analyzed using the CFX manager 3.1 software based on the ΔΔCq method and graphed in GraphPad Prism 5.02 (GraphPad Software Inc., La Jolla, CA, USA). For each gene-expression study the top 3 out of 6 reference genes [ALAS1 (aminolevulinic acid synthase 1), B2M (beta-2-microglobulin), GAPDH (glyceraldehyde-3-phosphate dehydrogenase), HPRT-1 (hypoxanthine phosphoribosyl-transferase 1), TBP (TATA-binding protein), and TFRC (transferrin receptor)] showing most stable expression were selected for normalization using the geometric mean approach as described previously [Vandesompele et al. Citation2002].
| Abbreviations | ||
| cDNA | = | complementary DNA |
| EB | = | embryoid body |
| gDNA | = | genomic DNA |
| hESC | = | human embryonic stem cell |
| hiPSC | = | human induced pluripotent stem |
| hPSC | = | human pluripotent stem cell |
| iPSC | = | induced pluripotent stem cell |
| qPCR | = | quantitative PCR |
| RT | = | reverse transcription |
| RT-qPCR | = | quantitative RT-PCR |
| Pre-Amp | = | pre-amplification |
Supplementary material available online
Supplementary Figures and Tables.
IAAN_1062578_Supplementary_Files.zip
Download Zip (2.6 MB)Acknowledgments
We thank Dr. Andras Nagy for the hESC line CA1 and Dr. Rudolph Jaenisch for lentiviral vectors. Dr. Yan Wang and Dr. Craig Simmons we thank for critically reading the manuscript and Mr. Ronnie Ireland for helping with cell cultures.
Declaration of interest
This work was supported by The Canadian Institutes of Health Research grant (MOP-130550) to SJL. STO and HS are currently employees of Bio-Rad Laboratories.
Author contributions
Planned the study, performed experiments, analyzed and interpreted data, wrote the manuscript: MK; Planned the study, provided funding, interpreted data, approved the manuscript: SJL; Planned the study, provided material, interpreted data, revised the manuscript: STO; Planned the study, performed experiments, analyzed and interpreted data, edited the manuscript: HS.
References
- Adewumi, O., Aflatoonian, B., Ahrlund-Richter, L., Amit, M., Andrews, P.W., Beighton, G., et al. (2007) Characterization of human embryonic stem cell lines by the International Stem Cell Initiative. Nat Biotechnol 25:803–816
- Bernardo, V., Ribeiro Pinto, L.F. and Albano, R.M. (2013) Gene expression analysis by real-time PCR: experimental demonstration of PCR detection limits. Anal Biochem 432:131–133
- Bock, C., Kiskinis, E., Verstappen, G., Gu, H., Boulting, G., Smith, Z.D., et al. (2011) Reference Maps of human ES and iPS cell variation enable high-throughput characterization of pluripotent cell lines. Cell 144:439–452
- Brambrink, T., Foreman, R., Welstead, G.G., Lengner, C.J., Wernig, M., Suh, H., et al. (2008) Sequential expression of pluripotency markers during direct reprogramming of mouse somatic cells. Cell Stem Cell 2:151–159
- Dang, S.M., Gerecht-Nir, S., Chen, J., Itskovitz-Eldor, J. and Zandstra, P.W. (2004) Controlled, scalable embryonic stem cell differentiation culture. Stem Cells 22:275–282
- De Los Angeles, A., Loh, Y.H., Tesar, P.J. and Daley, G.Q. (2012) Accessing naive human pluripotency. Curr Opin Genet Dev 22:272–282
- Esmailpour, T. and Huang, T. (2012) TBX3 promotes human embryonic stem cell proliferation and neuroepithelial differentiation in a differentiation stage-dependent manner. Stem Cells 30:2152–2163
- Kibschull, M., Mileikovsky, M., Michael, I.P., Lye, S.J. and Nagy, A. (2011) Human embryonic fibroblasts support single cell enzymatic expansion of human embryonic stem cells in xeno-free cultures. Stem Cell Res 6:70–82
- Kralj, J.G. and Salit, M.L. (2013) Characterization of in vitro transcription amplification linearity and variability in the low copy number regime using External RNA Control Consortium (ERCC) spike-ins. Anal Bioanal Chem 405:315–320
- Maddah, M., Shoukat-Mumtaz, U., Nassirpour, S. and Loewke, K. (2014) A system for automated, noninvasive, morphology-based evaluation of induced pluripotent stem cell cultures. J Lab Autom 19:454–460
- Marti, M., Mulero, L., Pardo, C., Morera, C., Carrio, M., Laricchia-Robbio, L., et al. (2013) Characterization of pluripotent stem cells. Nat Protoc 8:223–253
- Outten, J.T., Gadue, P., French, D.L. and Diamond, S.L. (2012) High-throughput screening assay for embryoid body differentiation of human embryonic stem cells. Curr Protoc Stem Cell Biol Chapter 1:Unit 1D 6
- Pal, R., Mamidi, M.K., Das, A.K., Rao, M. and Bhonde, R. (2013) Development of a multiplex PCR assay for characterization of embryonic stem cells. Methods Mol Biol 1006:147–166
- Song, H., Suehiro, J., Kanki, Y., Kawai, Y., Inoue, K., Daida, H., et al. (2009) Critical role for GATA3 in mediating Tie2 expression and function in large vessel endothelial cells. J Biol Chem 284:29109–29124
- Tellinghuisen, J. and Spiess, A.N. (2015) Absolute copy number from the statistics of the quantification cycle in replicate quantitative polymerase chain reaction experiments. Anal Chem 87:1889–1895
- Ungrin, M.D., Joshi, C., Nica, A., Bauwens, C. and Zandstra, P.W. (2008) Reproducible, ultra high-throughput formation of multicellular organization from single cell suspension-derived human embryonic stem cell aggregates. PLoS One 3:e1565
- Vandesompele, J., De Preter, K., Pattyn, F., Poppe, B., Van Roy, N., De Paepe, A., et al. (2002) Accurate normalization of real-time quantitative RT-PCR data by geometric averaging of multiple internal control genes. Genome Biol 3:RESEARCH0034
- Werth, D., Grassi, G., Konjer, N., Dapas, B., Farra, R., Giansante, C., et al. (2010) Proliferation of human primary vascular smooth muscle cells depends on serum response factor. Eur J Cell Biol 89:216–224
- Williams, R., Schuldt, B. and Muller, F.J. (2011) A guide to stem cell identification: progress and challenges in system-wide predictive testing with complex biomarkers. Bioessays 33:880–890
- Woltjen, K., Hamalainen, R., Kibschull, M., Mileikovsky, M. and Nagy, A. (2011) Transgene-free production of pluripotent stem cells using piggyBac transposons. Methods Mol Biol 767:87–103
- Yang, L., Soonpaa, M.H., Adler, E.D., Roepke, T.K., Kattman, S.J., Kennedy, M., et al. (2008) Human cardiovascular progenitor cells develop from a KDR + embryonic-stem-cell-derived population. Nature 453:524–528
- Yu, Y., Liu, L., Xie, N., Xue, H., Fazli, L., Buttyan, R., et al. (2013) Expression and function of the progesterone receptor in human prostate stroma provide novel insights to cell proliferation control. J Clin Endocrinol Metab 98:2887–2896
- Zhang, P., Li, J., Tan, Z., Wang, C., Liu, T., Chen, L., et al. (2008) Short-term BMP-4 treatment initiates mesoderm induction in human embryonic stem cells. Blood 111:1933–1941