
Abstract
In Finland, the national Core Curriculum for Basic Education defines the learning objectives along with the numerical grade to be given for good competence in each school subject in the final phase of basic education. While serving as a guideline for schools and teachers, it should also ensure an objective evaluation of all students in Finland. In this paper, we take a closer look at the equality of student assessment in Finland in the light of student performance in the Programme for International Student Assessment (PISA) 2009. This study investigates the relationship between the grades given to students in mother tongue and literature at different schools and the same students’ reading literacy performance in PISA 2009. The results are presented as a map produced using a method called kriging (McCoy and Johnston 2001). Kriging is a geostatistical interpolation method based on the statistical relationship among measured points’ spatial autocorrelation. In this case, the method produces contour maps illustrating areal differences for educational variables. The contour maps and related analysis indicate that teachers tend to adjust their grading practices to the general competence level of their class or school rather than strictly following the national curriculum guideline for student assessment. This may lead to local variations in terms of students’ school grades as indices of learning achievement and becomes evident when contrasted with an external, nation-wide reference point, such as their reading literacy performance in PISA 2009.
A strive for equality in education
Educational assessment is important in many European countries, and a majority of them also use different high-stake assessments, such as national examinations at the end of basic education, as a data source for the external evaluation of their school systems (Eurydice 2012). Educational evaluation is also often associated with the authoritative control of schools and teachers by school inspections, for instance. In this respect, Finland differs from many other European countries as there is no national examination at the end of basic education and no longer any school inspectorate system, either. In Finland, the main purpose of educational evaluation is to support the development of education and improve the conditions for learning (Act on Basic Education Citation1998). Nevertheless, various international assessments also play an increasingly important role in developing the Finnish education system.
The highest educational authority in Finland is the Ministry of Education and Culture, which also drafts legislation on education. The next level of the administrative hierarchy is represented by a state agency called the National Board of Education, which is responsible for the national curricula. Municipalities with their local authorities are obliged to organise education in practice, constructing municipal curricula in accordance with the above-mentioned national guidelines and steering documents. Finally, at the school level each school drafts its own curriculum founded on both the national and the local one. This means the teachers are also involved in developing the school-based curriculum, and the schools have a chance to adjust the curriculum to the local circumstances. Hence, the Finnish education system is characterised by a combination of national and local control.
The assessment of learning outcomes can be viewed from many perspectives and serves different purposes for different target groups. First, it can be viewed from a national perspective. Until recently, the Finnish National Board of Education used to conduct national assessments of students’ learning achievement. Since May 2014, this is now a duty of the Finnish Education Evaluation Centre (FINEEC). Among other things, the FINEEC is responsible for evaluating learning outcomes with respect to the distribution of lesson hours and the national core curriculum targets stipulated in the Basic Education Act (628/1998). The assessment of learning outcomes is based on sampling. Typical sample sizes comprise 5 to 10 percent of the age group, meaning each assessment involves about 4,000 to 6,000 students (Jakku-Sihvonen Citation2013, 24). The assessed schools represent around 15 percent of all schools that provide basic education in Finland (Ouakrim-Soivio Citation2013, 21).
These national assessments provide valuable information for the highest educational authorities. In Finland, basic education is expected to secure equal educational opportunities for all students. Therefore, the equity of learning outcomes is studied from several perspectives like, for example, those of students’ gender, region, type of municipality, and socioeconomic background as well as language spoken at school. In principle, reaching the objectives for equal learning opportunities as defined in the National Core Curricula should lead to educational equity so as to ensure there are no statistically significant differences between boys’ and girls’ learning outcomes, for example, or between different regions of Finland.
Second, from the schools’ perspective, the national assessments of learning outcomes provide benchmarks for schools to evaluate their own success in achieving their objectives of teaching and learning in different subjects. Schools selected for an assessment receive feedback in the form of reference data on the results and learning-related perceptions of their own students. Because there are no national examinations at the end of basic education, many schools welcome this opportunity to compare their own results and grading practices against the national benchmarks and use the assessment as a tool to develop their instruction in different subjects (Ouakrim-Soivio and Kuusela Citation2012, 13).
Third, teachers assess each student in the final phase (in Grades 8 and 9) of basic education and this is based on student performance. At the end of basic education (i.e. Grade 9 in the comprehensive school), most students are 15-year-olds and about to finish their compulsory education. In Finland the national Core Curriculum for basic education determines the learning objectives for each school subject. Grading guidelines are also given, but with a specific description for good competence only, which equals grade 8 on the student assessment scale ranging from 4 to 10, where 4 means failed and 10 is the highest grade. This good competence level serves as a baseline for assessment and should help ensure an objective evaluation of all students attending basic education. An objective evaluation at this point is very important; the grades obtained in different subjects at the end of compulsory education will largely determine the next steps in a student's educational path.
In sum, student assessments at different levels (national, school or individual) all strive for the same goal: equality and equity in education. Based on these premises, the following research question is formulated: is there any geographical variation in Finnish students’ grades in mother tongue and literature when contrasted with their reading literacy scores in PISA 2009? In order to answer this question, Finnish PISA 2009 data are used. PISA is an OECD (Organisation for Economic Co-operation and Development) Programme for International Student Assessment that measures 15-year-old students’ proficiency in three main domains: reading, mathematics and science. The Finnish PISA 2009 data consist of 203 sampled schools and 6,415 students. Further, in order to illustrate possible regional inequalities a method called Kriging is used (McCoy and Johnston Citation2001). Kriging is a geostatistical interpolation method based on the statistical relationship among measured points’ spatial autocorrelation. This new method for educational sciences helps recognise the geographical distribution of various educational factors (see Vettenranta and Harju-Luukkainen Citation2013; Harju-Luukkainen and Vettenranta Citation2013, Citation2014).
Assessment of students’ learning outcomes
In every education system the assessment of student performance has more or less the same objectives. These are: to indicate to the students themselves and also to their parents and others how the student has succeeded in learning (Calfee and Masuda Citation1997; Loyd and Loyd Citation1997), to confirm the student has achieved the objectives defined in curricula, for instance, and to verify the student is ready to proceed to the next grade or next level of schooling (Broadfoot Citation1996; Klapp Lekholm Citation2008). The evaluation of learning outcomes in different countries can be viewed from many perspectives; the chosen perspectives also further specify the concept and give an overview of what the assessment of learning outcomes actually means in the context of a particular country.
First, at the highest level the evaluation of students’ learning outcomes can be seen as norm referenced or as criterion based. In Finland, this evaluation includes both of these perspectives. It is norm referenced in the sense that each student's achievement can be compared with the results of other students belonging to the same sample. On the other hand, the assessments of learning outcomes can also be seen as criterion based. This is because the evaluations are based on preassigned external criteria defined in the national core curriculum for basic education. The national Core Curriculum defines not only the learning objectives but also the grade to be given for good competence in each school subject. It should be noted that the grading criteria are defined for grade 8 (good competence) only, which is to serve as a baseline on the grade scale from 4 (lowest) to 10 (highest) (Opetushallitus Citation1998, 8; Metsämuuronen Citation2009, 17; Jakku-Sihvonen Citation2013, 18).
Second, School-Based Assessment (SBA) takes place at the classroom level mainly as summative tests. Besides this, the teacher formatively evaluates how the students’ performance is improving over time. The formative assessment is carried out during lessons. The overall evaluation is based on a wide range of evidence and allows the teacher to adjust his or her teaching methods to the students’ specific needs and therefore also gives a chance to improve the learning process in general (see e.g. Heinonen Citation2001a, 22; Brookhart Citation2007, 43; Metsämuuronen Citation2009, 8-9).
As regards school grades, in the year Grades from 1 to 7 (ages 7 to 13) the students are given either written feedback or receive an alphabetical or numerical grade. In Grades 8 and 9, i.e. the last two years of basic education, feedback is given by numerical grades. The final grades for each core subject at the end of a comprehensive school are based on the student's performance in Grades 8 and 9 (National Core Curricula Citation2004, 260).
Students in the Finnish education system apply and are selected for upper secondary education chiefly on the basis of their school grades at the end of basic education. To ensure these final grades are nationally comparable regardless of the school, the teachers are supposed to follow the good competence grade definition for each subject. While also serving as a general guideline for schools and teachers, it should primarily ensure an objective evaluation for all students. The grade to be given for good subject-specific competence is defined from various perspectives. For example, in mother tongue and literature the grade definition includes interaction skills, capability to interpret and utilise various texts, produce texts and use them for different purposes and also the students’ relationship with language, literature and culture. Surpassing the standard for certain criteria can compensate failing in some other criteria. In general, on the scale from 4 to 10 where 4 means failed, grade 5 is given for elementary achievement of the criteria defined, while 10 is reserved for excellent competence exceeding the standard requirements (see e.g. National Core Curricula Citation2004, 264).
Recent studies have brought up an inequality issue concerning student assessment, i.e. how teachers grade their students in the comprehensive school. This challenge – regarding the students’ competencies in mathematics – was initially pointed out by Mattila (Citation2002, 90–91) and later by Kuusela (Citation2006, 67–98) and Hirvonen (Citation2012, 69–71). Lappalainen (Citation2006, 2011) observed similar inequality issues in two national assessments of mother tongue and literature. In these cases, Lappalainen found discrepancies between the grades given to students in different schools and the competence they showed in a follow-up assessment. The most recent analyses of the national assessment data also show the competence levels between students with the same grade can vary significantly, for instance, in history and social studies (Ouakrim-Soivio and Kuusela Citation2012, 110–112; Ouakrim-Soivio Citation2013, 175–176), and also in health education (Summanen Citation2014, 129). This means there may be significant variation as to how well the grade given matches a student's actual competence level in a particular subject. According to Ouakrim-Soivio (Citation2013), students at the same skill and competence level could receive a different grade depending on the general level of the school concerned. For example, students scoring 60 percent of the maximum in a national test in social sciences (conducted by the National Board of Education) had school grades ranging from 6 to 8. The lower the average school level was, the higher the grades received by the students and vice versa (Ouakrim-Soivio Citation2013, 175).
In sum, when teachers grade their students at the lower secondary level in Finland, it seems to be partly influenced by the general competence level of the school or class, rather than following the learning objectives or the baseline description for good competence defined in the core curriculum.
Regional variation and gender gap
Although Finland is known as a country with particularly equal learning outcomes among students and schools, domestic differences are still notable. There is also evidence that the equality is challenged by the growing differentiation trends at many levels. The differences in learning outcomes can be observed between various groups of students, genders (especially in reading literacy), schools and geographical areas. While girls in Northern Finland on average score 580 points in the PISA reading literacy tests, boys in Eastern Finland score about 100 points less. In PISA 2009, this difference corresponded to more than two years of schooling.
The trend of growing competence gaps is evident in the repeated PISA evaluations in reading literacy. The latest international PISA assessments showed a marked and uneven decline in the Finnish results. Not only did the score point average drop by an equivalent of half a school year (25 points) within a decade, but the bottom 10 percent of Finnish schools fell considerably more steeply than most schools (Kupari et al. Citation2013). In fact, the study pointed out a group of schools which had dropped even below the OECD average. Besides at the school level, the comparatively steeper decline at the ‘low-achieving’ end also shows at the student level since the results of the poorest learners generally dropped more than the average decline in the national results would suggest. In mathematics, for instance, the percentage of “very poor” performers – falling short of the minimum criteria for managing basic mathematical tasks needed in contemporary society – rose from 7 percent to 12 percent. The performance gap between the highest and lowest student deciles has grown by 25 score points in the last decade, corresponding to several months of schooling.
The differences in student performance in the PISA assessments are to some extent related to the social background of the students. While gender, for example, is a significant factor in explaining educational outcomes, socioeconomic backgrounds also appear to be strongly linked to academic performance, especially for between-school variation. While socioeconomic background generally accounts for 8 to 11 percent of between-student variation in the national and international assessments, as much as 80 percent of the variation between schools can be accounted for by the students’ socioeconomic background (Kuusela 2009). The effect of socioeconomic background on individual outcomes was also shown to be growing in Finland, since the statistical effect that a one-unit increase on the socioeconomic scale has on student scores rose from 28 points to 33 points in the PISA assessments, and the difference between the lowest and highest socioeconomic quartiles grew by 6 score points (Kupari et al. Citation2013).
Student background variables also affect the geographical variation of educational outcomes. After decades of a strong welfare state with relatively homogeneous socio-spatial development, Finnish regions and especially larger urban areas have started to differentiate. Socio-spatial and ethnic segregation has increased rapidly, particularly in the capital region with roughly one-fifth of the total population of Finland (Vaattovaara and Kortteinen, Citation2011). This trend has led to relatively notable and growing school segregation in urban areas because the school catchment areas have differentiated ethnographically in socioeconomic and ethnic terms. The social and ethnic segregation between neighbourhood schools is then reflected in widening gaps in their educational outcomes. According to Bernelius and Kauppinen (Citation2011), the relationship between the school catchment area characteristics and school outcomes is linear throughout all types of neighbourhoods. This means one should expect to see the more advantaged neighbourhoods and schools attaining higher results than predicted by the linear model, or the more disadvantaged neighbourhoods producing a significantly lower attainment level than predicted.
Previous studies by Harju-Luukkainen and Vettenranta (Citation2013) Harju-Luukkainen and Vettenranta (Citation2014); Vettenranta and Harju-Luukkainen Citation2013) also provided evidence of the uneven distribution of student achievement in different regions of Finland in the PISA and TIMSS assessments, like in the School Health Promotion Study of 2009. In PISA 2009, students were assessed in the respective domains of reading literacy, mathematical literacy and scientific literacy. It turned out that some regions showed an especially low student achievement, on average, while some others reached a relatively high level in all three domains. More specifically, Harju-Luukkainen and Vettenranta (Citation2014) took a closer look at student performance in three different regions or areas of Swedish-speaking Finland. In their analysis, all of the assessed regions stood out with distinctive profiles in terms of their student performance. One of these regions performed relatively poorly in all test domains. It is also possible to find similar regional variation, for example, in different student groups in PISA 2012, e.g. students with an immigrant background and students attending Swedish-language schools in Finland (Harju-Luukkainen et al. Citation2014a; Harju-Luukkainen et al. Citation2014b). Here the authors were able to find regional variation when it comes to students’ educational outcomes.
Data and context
The PISA assessment and the definition of reading literacy
This paper draws on the Finnish PISA 2009 data, which consist of 203 sampled schools (in all, there are approximately 3,000 schools) and of 6,415 students (in all, there are 66,198 students in the same age cohort). PISA is an OECD Programme for International Student Assessment that measures 15-year-old students’ proficiency in three main domains: reading, mathematics and science. The PISA 2009 assessment covered about 65 participating countries and economic areas across the world. This makes it one of the largest international educational assessments so far. PISA is conducted every 3 years with an alternating main domain. This gives an opportunity to monitor changes in student achievement in a specific subject every third round. PISA has been conducted since 2000, when the main domain was reading literacy. In PISA 2003, the main domain was mathematical literacy and in PISA 2006 it was science. Reading was again in the prime focus in PISA 2009. In each assessment round, about one-half of the testing time is devoted to the main domain.
In this paper, the focus is on student performance in the PISA 2009 reading literacy test, together with their self-reported last grade in mother tongue and literature, which was obtained from student questionnaire data. Reading literacy skills are naturally important for individuals in a modern society. These skills are fundamental for student achievement in most school subjects, but also needed very widely in most areas of adult life. There is an apparent connection between students’ reading literacy performance and their further study and career prospects as well. According to a longitudinal study conducted in Canada, the completion of secondary school education and participation in at least some post-secondary education is connected with the students’ reading literacy performance at the end of basic education (OECD Citation2010b, 3). Therefore, the reading proficiency of 15-year-old students is of great importance.
The concept of reading literacy has changed along with various societal changes over time. Different reading literacy skills have been needed at different times. While memorisation of information was an earlier priority in education, we have come to a new era in which finding, selecting and applying this information is seen as far more important. While the quantity of reading material around us is increasing all the time, the spectrum of different texts is also widening. Therefore, it is nowadays essential how people are able to understand and use various text types for their own benefit.
For PISA, the original definition of reading literacy was developed for the first test round in 2000. The definition partly evolved from the definitions used in the IEA Reading Literacy Study and the International Adult Literacy Survey (IALS) (OECD Citation2009, 20). In the first definition, the interactive nature of reading, but also the capacity to enable participation in society were especially emphasised. Much of this is retained in the PISA 2009 definition, but in an extended form. Now the motivational, behavioural and cognitive characteristics of an individual are also recognised. PISA 2009 introduced the following definition:
Reading literacy is understanding, using, reflecting on and engaging with written texts, in order to achieve one's goals, to develop one's knowledge and potential, and to participate in society (OECD Citation2009, 23).
When students are graded at the end of their compulsory education in Finland, the definition of good competence (grade 8) is used as a reference in each subject. This is described more closely in the National Core Curriculum for Basic Education (2004). Before giving the final grade for mother tongue and literature, teachers have to consider a variety of aspects with regard to students’ competences. For example, they need to consider a student's skills in communication (five different aspects), the interpretation and use of various texts by others (six different aspects), the production and use of a range of text types (nine different aspects) and language, literature and culture (12 different aspects).
The way PISA defines reading literacy and how the Finnish national core curriculum defines good competence in mother tongue and literature are two different things, of course. The objectives of the assessments pertinent to these frameworks are also very different. What these assessments have in common, however, is that they target the same area of proficiency that is essential for the students’ future prospects. Despite the obvious differences between these two assessment frameworks, i.e. the PISA tests and school marks, they are similar enough to give a reason to expect some kind of consistency between them. Based on this assumption, it is possible to use the PISA scores as a reference point when analysing school grades across the country. If the PISA scores and school grades were mutually fully consistent throughout the country, we would not find any residuals in the statistical model (see below). Then again, if the comparison between these two estimates of student proficiency shows some inconsistencies, we might detect inequalities in school-based grading. In this setting, the definitions of these instruments do not need to be equivalent as such.
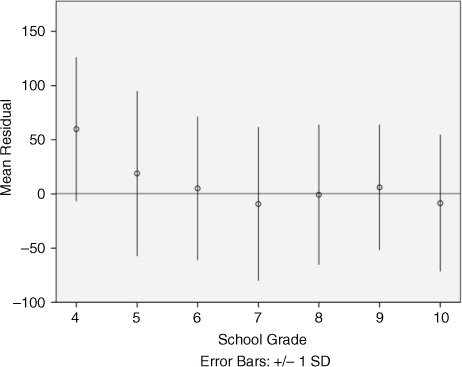
Figure 1. Mean residuals (difference between real scores and predicted scores) and their standard deviation in the PISA predicted score model
Method and findings
This study investigates the comparability of school grades given in different schools (N= 203) and regions of Finland. This is done by contrasting individual students’ (n=5964) school grades in mother tongue and literature (self-reported in a PISA student questionnaire, ranging from 4 to 10) with their results in the PISA 2009 reading literacy test. Note here that not all of the 6,415 students in the original Finnish PISA 2009 data answered the question concerning their school grade in mother tongue and literature. In order to produce predicted values for the PISA results based on the school grades, a simple linear model was fitted to the data, using the following formula:
where PS is a student's predicted PISA reading literacy score calculated as an average of students’ plausible values, and SG is a student's school grade in mother tongue and literature (4 to 10). This model can explain about 37 percent of the total variation in students’ actual PISA scores.
presents the mean residuals and their standard deviation. This figure illustrates the degree to which the model can predict an individual student's PISA result, as the model residuals indicate a difference between the real score and the predicted value. Negative residuals indicate the model gives too high a prediction compared to the real score, and positive residuals reveal the predicted value is lower than the real score. In , the correlation between school grades and PISA score points is not quite linear. For school grades 4 to 6, the model gives increasing residuals, meaning the model underestimates the PISA scores for those students with the lowest school grades. Hence, in the PISA test students with school grades 4 and 5 performed markedly better, on average, than these grades would suggest.
Further, it is possible to obtain school averages by aggregating all individual students’ residuals. The school average indicates how well the model can predict student performance at the school level, in other words, what kind of match there is between the school grades and the school-based PISA results as indicators of student achievement at the school level. Almost equal results would have been obtained by using 2-stage hierarchical modelling, and by substituting random school factors for mean school residuals.
In this paper, a method called Kriging is applied to these average school residuals. This method offers a relatively new way of illustrating spatial distributions of educational variables and enables, for instance, related analyses of regional variation (Vettenranta and Harju-Luukkainen Citation2013; Harju-Luukkainen and Vettenranta Citation2014; Vettenranta Citation2015). More specifically, Kriging is a geostatistical interpolation method based on the statistical relationship among the measured points’ spatial autocorrelation. The geographical distribution of the schools in the PISA sample is not even. This means, for example, that southern Finland and the larger cities have more sampled schools than more dispersed areas. When using the Kriging method, predictions are made by a fixed number of near observations instead of a predefined search radius. This makes the method suitable even for more dispersed areas. Kriging weights the surrounding measured values to derive predictions for non-measured locations according to the distance between measured points, the prediction location and the overall spatial arrangement among the measurements (McCoy and Johnston, Citation2001). In this study, plausible values of PISA data are used for the school-average residuals. Plausible values and their mean standard errors were estimated at the nodes of a square grid of 10 km x 10 km over the entire area of Finland.
The estimation is calculated by kriging (ArcGisTM software) based on the 12 (as a default) nearest neighbours (schools that participated in the PISA study) weighted by distance. School-average residuals are used in this estimation. Predictions were weighted by distance only, not by any student or school variable. A corresponding contour map was produced for visual observation. This method allows the effect of individual students and schools to be separated from the spatial variation, as well as any possible variation of background factors among them, and thus observe the purely regional variation, which is affected by regional characteristics, naturally. This method gives an opportunity to observe regional results without revealing the participating schools and their results. It is important to note that in Finland it is not allowed to reveal results on the school level. The final results are displayed as contour maps composed of surfaces that indicate the predicted value of the model residual for a randomly located school's randomly chosen student (). This method is illustrative and displays the results in a concretised form.
Figure 2. A residual (the difference between actual scores and predicted scores) map of Finland, produced with the Kriging method
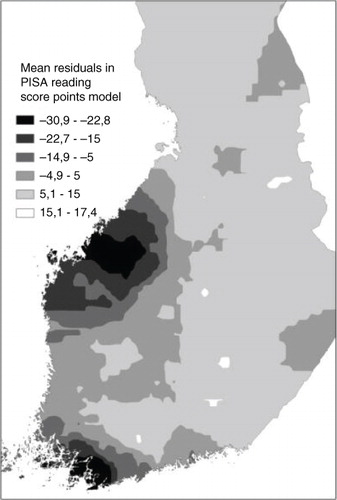
According to , a slight underestimation can be found in most areas of Finland (in lighter colour) when contrasting students’ school grades in mother tongue and literature with their performance in PISA 2009. A lighter colour stands for the value range 5.1 to 17.4 points above the average 0. This means that in most parts of Finland teachers grade students harder than the PISA scores would suggest. By the same token, the model also indicates a clear overestimation in certain areas (in darker colour) so that the students’ school grades in mother tongue and literature are too high compared to their PISA 2009 performance. Hence, in the light of the regional averages, in some areas of Finland students could score up to 31 points less in the PISA test than their peers in another area, even if they have the same school grade. When converted to an educational time scale, such a gap in the PISA scores (31 points) in reading literacy equals almost a year of schooling. Such differences may also be a sign of problems with regard to equality in student assessment.
Conclusions and discussion
One of the guiding principles of the Finnish education system is equality. Ensuring equal opportunities for students is important at every level of the education system. In this article, our aim was to identify, in the light of the Finnish PISA 2009 data, possible regional differences in student assessment. Our analysis concerned students’ reading literacy scores as well as their self-reported latest school grades in mother tongue and literature.
In order to illustrate possible regional differences in student assessment, a statistical method called Kriging was used. This method helps to visualise areal differences of educational variables. More generally, this method opens up new possibilities for investigating various educational factors in terms of their spatial distribution, which can provide valuable information, for example, for educational policymakers to ensure educational equality, not only in Finland but also around the world. For such purposes, this method gives a better view of the geographical variation and distribution of various educational issues within countries than what is obtained by measuring areal factors for predefined regions. The method can reveal some unrecognised or unperceived spatial occurrences which can explain deviations in educational variables, e.g. regional characteristics of student assessment.
In this study, the model used could explain about 37 percent of the total variation in students’ actual PISA scores. Overall, this means the grades given to students in mother tongue and literature can fairly well predict or explain their PISA scores in reading literacy. However, a closer analysis of the contour maps produced by the Kriging method reveals some challenges with respect to student grading.
First, this study suggests that in basic education in Finland students’ school grades in mother tongue and literature are not necessarily based on an equal assessment of their actual skills and knowledge. This seriously undermines the nation-wide validity, reliability and comparability of these grades. Our study reinforces the view that the criteria for a student's good competence level (grade 8) defined in the national core curriculum is not enough to ensure the teachers in different schools apply the national grading scale equally across the country. This inequality in students’ grading was already pointed out in several assessments, for example by Mattila (Citation2002, 90–91) and later by Kuusela (Citation2006, 67–98) and Hirvonen (Citation2012, 69–71). Lappalainen (Citation2006, 2011) also observed similar issues in two national assessments of mother tongue and literature. In addition, this notion was pointed out by Ouakrim-Soivio (Citation2013, 213–214, 223–225).
One aspect of this discrepancy might concern whether or not teachers truly understand the concept of assessment. In previous studies, this was somewhat of a problem area. According to Black and colleagues (Citation2010), teachers’ summative practices were not consistent with their beliefs about validity. Teachers also lacked skills and confidence in assessment. Black and colleagues (ibid.) suggest that teachers would benefit from jointly agreed criteria for validity in any subject and also from a common guideline for handling the summative interface. In the light of these previous findings and our results, there is a need for more research in Finland on how teachers understand and interpret the level of good competence in their assessment practices, and how they understand the concept of assessment in general.
Second, our study brings a new dimension into this discussion by revealing not only the differences between students’ school grades and their test performance (i.e. between the two estimates of their proficiency; the former given by the teacher and the latter received in the PISA test), but also the areal differences and accumulation of the results. Here especially two regions stood out as regions where the students seemed to receive better grades in mother tongue and literature than suggested by their PISA performance. Hence, the results of this study suggest that when teachers are grading their students they tend to adjust the grades to the general competence level of the school or area, instead of strictly following the curricular guidelines for learning objectives and grade definitions. This makes student assessment less equal in national terms, and this inequality seems to accumulate geographically.
The two exceptional regions found in this study are marked with a darker colour in . These regions appear to be the same ones as in a previous study by Vettenranta (Citation2015). According to Vettenranta (Citation2015) these regions were characterised by a higher percentage of low performers and a lower percentage of excellent performers than in most other parts of Finland. One explanation for these similar regional findings could be that how people in general view on education in these two regions in these two regions is somehow different from that of the other regions. In fact, it has been suggested in previous research that in some contexts the influence of the environment on student performance can be negative and in some other contexts positive (see e.g. Plagens Citation2011, 40). Certain student background variables might thus have a different effect on educational outcomes in some areas. It is also a well-known fact that family and environmental factors correlate markedly with educational outcome, but the larger question is: why is their affect different in size in different areas? One explanation might be that the PISA assessment measures purely educational skills, motivation and perseverance, whereas school assessment might include several other factors as well, which might be focused on variously in different areas. This is all something that has been studied very little around the world and, to the best of our knowledge, not at all in Finland. In any case, in further studies it would be important to understand why educational underachievement seems to accumulate in certain areas and not in others.
But why then is this equality of student assessment so important? First and foremost, it is important for the equal, just and fair treatment of students, especially with regard to their further study paths, because even small margins may be decisive in student placement. If teachers apply the national grading scale differently and students’ further placement depends on those final grades, some students might be unduly excluded from a study place, even if their actual competence level is higher than that of somebody admitted with a higher grade. The larger the differences between teachers’ grading practices in different schools, the larger the inequality problem becomes. Within the analytical framework of this study, the biggest observed difference was 31 score points on the PISA reading literacy scale. In terms of educational time, that equals almost a year of schooling. This gap can therefore be regarded as large.
This study naturally raises several questions. How much discrepancy in student assessment can be tolerated, and can the assessment ever be objective? An absolutely objective assessment is probably impossible, at least in the current setting. The question of equality and equity in assessment becomes a really complex concept in Finland when, for example, surpassing the standard for certain criteria can compensate failing in some others. This means the student assessment practices in Finland can allow and be sensitive to some individual variation in performance. In the light of all of this, we see that understanding of the concept of assessment and how teachers apply the criteria need to be discussed more widely. This is something that, for example, Newton (Citation2007) pointed out as important.
How then can this inequality issue be solved in Finland? One obvious solution is to train teachers to more accurately identify what kind of student performance fulfils the criteria of good competence (grade 8), as described in the core curriculum. In practice, however, this might not be enough to entirely solve the challenge that teachers tend to grade their students in relative terms, i.e. according to the general competence level in the area or school. One way to avoid this kind of regional accumulation could entail teacher visits and cooperation between different regions. A broader view of the competence level of different areas, and also regarding assessment practices generally, might help ensure a more equal student assessment. However, according to Brown and colleagues (Citation2004) in order to successfully introduce a new assessment policy to teachers, policymakers need to take the complex structure of teachers’ understanding of assessment into account. Teachers can obviously view assessment from various, often highly individual perspectives.
Additional information
Notes on contributors
Heidi Harju-Luukkainen
Heidi Harju-Luukkainen, PhD (Education) holds a qualification in management and a special education teacher qualification from Finland. She also holds a title of docent in student assessment from University of Jyväskylä, Finland. She has taken part in several national and international developmental and research projects. Harju-Luukkainen has published over 120 articles, books and conference papers on her specialties. Currently Dr. Harju-Luukkainen is a visiting scholar at CRESST, UCLA. Email: [email protected]
Jouni Vettenranta
Jouni Vettenranta, Sc.D. (Forestry) is a senior researcher at the Finnish Institute for Educational Research, University of Jyväskylä. His main responsibilities are conducting the Finnish TIMSS-study and working as a science expert in the PISA study. His research interests lie in the areas of regional variation of learning results as well as in students’ social and cultural conditions. Email: [email protected]
Najat Ouakrim-Soivio
Najat Ouakrim-Soivio, PhD (Education) works at the Ministry of Education and Culture of Finland. She conducts research on topics like assessment of learning outcomes in history and social studies in secondary schools and the validity of grades at the end of secondary schools in Finland. During 2011–2013 she was a project manager for a national assessment project in history and social studies. She was also an expert in two previous reforms of the Finnish National Core Curricula in 2004 and 2014 and a representative of the steering group for the National Core Curriculum for basic education in 2014. Email: [email protected]
Venla Bernelius
Venla Bernelius, PhD (Urban Geography) is a university lecturer in regional studies at the University of Helsinki. She is specialised in urban segregation and education, and has participated in multiple interdisciplinary research projects on those topics. Besides her scientific publications, books and conference papers, Bernelius has extensive experience in consulting the national governance in educational equality, for example creating a research-based model for recognising the need for extra funding in segregated urban schools used in Helsinki. Email: [email protected]
Related Research Data
References
- Basic Education Act 21.8.1998/628.http://www.finlex.fi/fi/laki/ajantasa/1998/19980628?search%5Btype%5D=pika&search%5Bpika%5D=1998 perusopetus laki (Accessed 2016-04-07).
- Bernelius V. , Kauppinen T. M , Ham M. , Manley D. , Bailey N. , Simpson L. , Maclennan, D D . School outcomes and neighbourhood effects: a new approach using data from Finland. Neighbourhood Effects Research: New Perspectives. 2011; London: Springer. 225–247.
- Black P. , Harrison C. , Hodgen J. , Marshall B. , Serret N . Validity in teachers’ summative assessment. Assessment in Education: Principles. , Policy and Practice. 2010; 17(2): 215–232.
- Broadfoot P . Education, assessment and society. 1996; Buckingham: Open University Press.
- Brookhart S . McMillan J . Expanding views about formative classroom assessment: a review of the literature. Formative Classroom Achievement. 2007; New York: Teachers College Press. 43–62.
- Brown G . Teachers’ conceptions of assessment: implications for policy and professional development. Assessment in Education. 2004; 11(3): 301–318.
- Calfee R. C. , Masuda W. V . Phye G. D . Classroom assessment as inquiry. Handbook of Classroom Assessment. Learning, Adjustment and Achievement. 1997; San Diego: Academic Press. 69–102.
- Harju-Luukkainen H. , Vettenranta J . Tirri K. , Kuusisto E . The influence of local culture on students’ educational outcomes. Interaction in Educational Domains. 2013; Rotterdam: Sense Publishers. 77–90.
- Harju-Luukkainen H. , Vettenranta J . Hyry E. , Estola E. , Hiltunen M . Social capital and local variation in student performance in Swedish-speaking Ostrobothnia in Finland. Place and Education. 2014; Oulu: University of Oulu. 127–143.
- Harju-Luukkainen H. , Nissinen K. , Sulkunen S , Suni M . Avaimet osaamiseen ja tulevaisuuteen: Selvitys maahanmuuttajataustaisten nuorten osaamisen tasosta ja siihen liittyvistä taustatekijöistä PISA 2012 –tutkimuksessa. (Keys to competence and future. A report on PISA 2012 results and related underlying factors for students with an immigrant background.). 2014a; Jyväskylä: Finnish Institute for Educational Research..
- Harju-Luukkainen H. , Nissinen K. , Vettenranta J . PISA 2012: Åländska 15-åriga elevers resultatnivå. (15-year-old students on the Åland Islands in the PISA 2012 assessment). 2014b; Jyväskylä: Finnish Institute for Educational Research.
- Heinonen S . Jakku-Sihvonen R. , Heinonen S . Arvioinnin teoreettisia lähtökohtia [Theoretical starting points of assessment]. Johdatus koulutuksen uudistuvaan arviointikulttuuriin [Introduction to new educational assessment culture]. 2011; Helsinki: Opetushallitus. Arviointi 2/2001. 21–46.
- Hirvonen K . Onko laskutaito laskussa? Matematiikan oppimistulokset perusopetuksen päättövaiheessa 2012. [Are mathematical skills in decline? Mathematics learning outcomes at the end of basic education 2012.] Koulutuksen seurantaraportit 2012: 4. 2012; Helsinki: Opetushallitus.
- Jakku-Sihvonen R , Räisänen A . Oppimistulosten arviointijärjestelmistä ja niiden kehittämishaasteista [On assessment systems for learning outcomes and developmental challenges of these systems]. Oppimisen arvioinnin kontekstit ja käytännöt [Contexts and practices for the assessment of learning] . 2013; Helsinki: Opetushallitus. 13–36. (ed.) Raportit ja selvitykset 2013:3.
- Klapp Lekholm A . Grades and grade assignment: effects of student and school characteristics . 2008; Gothenburg: University of Gothenburg.
- Kupari P. , Välijärvi J. , Andersson L. , Arffman I. , Nissinen K. , Puhakka E. , Vettenranta J . PISA 2012 Ensituloksia [PISA 2012 initial results]. 2013; Helsinki: Opetus- ja kulttuuriministeriö. Helsinki: Opetus- ja kulttuuriministeriön julkaisuja 2013:20.
- Kuusela J . Temaattisia näkökulmia perusopetuksen tasa-arvoon [Thematic viewpoints on the equality of basic education]. 2006; Helsinki: Opetushallitus. Oppimistulosten arviointi 6/2006.
- Lappalainen H.-P . Ei taito taakkana ole. Perusopetuksen äidinkielen ja kirjallisuuden oppimistulosten arviointi 9. vuosiluokalla 2005 [Skill is no burden. Assessment of learning outcomes in mother tongue and literature in the ninth grade in basic education 2005]. 2006; Helsinki: Opetushallitus. Oppimistulosten arviointi 1/2006.
- Loyd B. H. , Loyd D. E . Phye G. D . Kindergarten through grade 12 standards: a philosophy of grading. Handbook of Classroom Assessment. Learning, Adjustment and Achievement. 1997; San Diego: Academic Press. 481–489.
- Mattila L . Perusopetuksen matematiikan oppimistulosten kansallinen arviointi 9. vuosiluokalla 2002 [National assessment of mathematics learning outcomes in the ninth grade in basic education 2002]. Oppimistulosten arviointi 8/2002 . 2002; Helsinki: Opetushallitus.
- McCoy J. , Johnston K . Using ArcGis™ Spatial Analyst. 2001; New York: ESRI.
- Metsämuuronen J . Metodit arvioinnin apuna. Perusopetuksen oppimistulosarviointien ja -seurantojen menetelmäratkaisut Opetushallituksessa. [Methods in aid of assessment. Methodological solutions used by the NBE in assessing and reviewing learning outcomes in basic education.] Oppimistulosten arviointi 1/2009. 2009; Helsinki: Opetushallitus.
- National Core Curricula. Perusopetuksen opetussuunnitelman perusteet. (2004); Helsinki: Opetushallitus.
- Newton P . Clarifying the purpose of educational assessment. Principles, Policy and Practice. 2007; 12(2): 149–170.
- OECD (Organisation for Economic Co-operation and Development). PISA 2009. Assessment framework – Key competencies in reading, mathematics and science. (2009); Paris: OECD.
- OECD (Organisation for Economic Co-operation and Development). PISA pathways to success. How knowledge skills at age 15 shape future lives in Canada. (2010); Paris: OECD.
- Opetushallitus. Kansallinen oppimistulosten arviointimalli. (1998); Helsinki: Opetushallitus. Arviointi 4/98.
- Ouakrim-Soivio N . Toimivatko päättöarvioinnin kriteerit? Oppilaiden saamat arvosanat ja opetushallituksen oppimistulosten seuranta-arviointi koulujen välisten osaamiserojen mittareina. [Are the criteria for final grading functioning? Student grades and NBE reviews on learning outcomes as indicators of between-school differences] Raportit ja selvitykset 2013: 9. 2013; Helsinki: Opetushallitus.
- Ouakrim-Soivio N. , Kuusela J . Historian ja yhteiskuntaopin oppimistulokset perusopetuksen päättövaiheessa 2011 [Learning outcomes in history and social studies at the end of basic education 2011]. Koulutuksen seurantaraportit 2012:3. (2012); Helsinki: Opetushallitus.
- Plagens G . Social capital and education: implications for student and school performance. Education and Culture. 2011; 27(1): 40–64.
- Summanen A-M . Terveystiedon oppimistulokset perusopetuksen päättövaiheessa 2013 [Learning outcomes in health education at the end of basic education 2013]. Koulutuksen seurantaraportit 2014:1. (2014); Helsinki: Opetushallitus.
- Vaattovaara M. , Schulman H , Kortteinen M . Driant J-C. , Houard N . A Nordic welfare model at a turning point? Social housing and segregation in Finland. Social Housing across Europe. 2011; Paris: La documentation Francaise.
- Vettenranta J., Harju-Luukkainen H. A New Way of Recognizing the Spatial Distribution of Educational Issues: Regional Variation of Science Literacy in the Finnish TIMSS 2011 Data. 5th IEA International research conference. (2013). TIMSS and TIMSS advanced. http://www.iea.nl/fileadmin/user_upload/IRC/IRC_2013/Papers/IRC-2013_Vettenranta_Harju-Luukkainen.pdf (Accessed 2013-08-13).
- Vettenranta J . Välijärvi J. , Kupari P . Koulutuksellinen tasa-arvo Suomessa [Educational equality in Finland]. Millä eväillä tulevaisuuden peruskoulu nousuun? Opetus- ja kulttuuriministeriön julkaisuja 2015:9. 2015; Helsinki: Opetus- ja kulttuuriministeriö.