Abstract
Background
Dietary intakes of plant lignans have been hypothesized to be inversely associated with the risk of developing cardiovascular disease and cancer. Earlier studies were based on a Finnish lignan database (Fineli®) with two lignan precursors, secoisolariciresinol (SECO) and matairesinol (MAT). More recently, a Dutch database, including SECO and MAT and the newly recognized lignan precursors lariciresinol (LARI) and pinoresinol (PINO), was compiled. The objective was to re-estimate and re-evaluate plant lignan intakes and to identify the main sources of plant lignans in five European countries using the Finnish and Dutch lignan databases, respectively.
Methods
Forty-two food groups known to contribute to the total lignan intake were selected and attributed a value for SECO and MAT from the Finnish lignan database (Fineli®) or for SECO, MAT, LARI, and PINO from the Dutch database. Total intake of lignans was estimated from food consumption data for adult men and women (19–79 years) from Denmark, Finland, Italy, Sweden, United Kingdom, and the contribution of aggregated food groups calculated using the Dutch lignin database.
Results
Mean dietary lignan intakes estimated using the Dutch database ranged from 1 to 2 mg/day, which was approximately four-fold higher than the intakes estimated from the Fineli® database. When LARI and PINO were included in the estimation of the total lignan intakes, cereals, grain products, vegetables, fruit and berries were the most important dietary sources of lignans.
Conclusion
Total lignin intake was approximately four-fold higher in the Dutch lignin database, which includes the lignin precursors LARI and PINO, compared to estimates based on the Finnish database based only on SECO and MAT. The main sources of lignans according to the Dutch database in the five countries studied were cereals and grain products, vegetables, fruit, berries, and beverages.
Plant lignans are plant-derived diphenolic compounds that belong to the group of phytoestrogens that are structurally similar to 17-estradiol. After ingestion, plant lignans are metabolized to the enterolignans enterodiol (END) and enterolactone (ENL) by colonic bacteria before they are absorbed (Citation1, Citation2). END and ENL are detected in plasma within 8–10 h after intake of plant lignans (Citation3), and their half-lives in plasma are approximately 5 and 13 h, respectively (Citation4, Citation5). However, a substantial inter-individual variation has been detected in plasma concentrations and urinary excretion of enterolignans, partly due to the complex interaction between colonic environment and external and internal factors (Citation6) which moreover, seems to be more dependent on the dietary lignan source than the absolute lignan intake (Citation7). Reliable methods of exposure measurement are crucial for understanding the possible health benefits of plant lignans and the first step in this process is to establish comprehensive dietary databases to estimate plant lignan exposure in population-based studies (Citation6).
Observational studies have examined the association between habitual intake of plant lignans – estimated from the intake of selected food items and their content of two major precursors of enterolignans secoisolariciresinol (SECO) and matairesinol (MAT) – and risk of developing lifestyle-related diseases, such as cardiovascular disease (Citation8, Citation9), breast cancer (Citation10), and prostate cancer (Citation11). The metabolite responsible is ENL showing an inverse association with postmenopausal breast cancer risk (Citation12) and mortality risk due to coronary heart disease, cardiovascular disease (Citation13), and breast cancer (Citation14) at high ENL serum levels. Furthermore, animal experiments on rats (Citation15) and studies in vitro showed a breast cancer protective effect of END and ENL that is discussed to be imputable to their higher biological activity (Citation16). Dietary lignan intake was also found to decrease the risk of adenocarcinoma of the esophagus and gastroesophageal junction on a case-control study (Citation17).
As progress has been made in this area, a food database of Dutch plant foods was published (Citation18) with data on the content of SECO and MAT, as well as two more recently identified precursors of mammalian lignans, lariciresinol (LARI) and pinoresinol (PINO) (Citation19). Estimated dietary intakes of lignans in the Dutch diet based on the new food database of Dutch plant foods (Citation20) suggest that plant lignan intakes are much higher than first reported (Citation21–Citation24) and that LARI and PINO contribute approximately 75% to the estimated intake of plant lignans in the Dutch diet with the primary food group sources of lignans being beverages, vegetables, nuts and seeds, bread and fruits (Citation20). A few oilseeds, such as flaxseed and sesame seeds have a high content of plant lignans (Citation18), but the intake of such foods is only used by a small proportion of the population and commonly, the amounts consumed are low (Citation20).
In addition to the improved understanding of the importance of total lignan intakes, it has become clear that the contribution of selected food groups to the total plant lignan intake may be different than originally expected due to the contribution from LARI and PINO. Therefore, it is necessary to re-estimate and re-evaluate the total intake of plant lignans and contribution from different food groups to the total intakes in other European countries.
The main objective of this study is to estimate the total intake of plant lignans and identify the main food sources of plant lignans in different European countries by using a Finnish lignan database (Fineli®) which includes two enterolignan precursors MAT and SECO and a Dutch lignan database which includes four enterolignan precursors SECO, MAT, LARI, and PINO.
Methods
The lignan intakes were calculated from 42 food groups that included plant foods and beverages known to be sources of lignans among European men and women. Each of the 42 food groups were given a lignan value for the content of the mammalian lignan precursors MAT, SECO, PINO, and LARI based on the lignan database of Dutch plant foods (Citation18) or on only MAT and SECO based on the Fineli® database from Finland (Citation24) as described in Appendix A. Both databases provide the Linnean binomial nomenclature for plants. The new lignan values for food groups were either weighted values or arithmetic means based on the food content of plant lignans available from commonly consumed food items best representing that food group. For example, in the case of Fineli®-based values, the lignan content of whole grain rye flour contributed most to the food group ‘rye’, whereas the value for cabbages was the arithmetic mean of all available lignan values for different types of cabbages. In the case of food group values based on the Dutch database, the food group values were based on a single analyzed food item (e.g. value of strawberry for the group ‘berries’) or arithmetic means drawn from the analyzed values available in the database (e.g. mean of tofu and soy milk for the group ‘soy products’).
Food consumption data for men and women were available for Denmark, Finland, Italy, Sweden, and the United Kingdom. The data included individual data from national dietary surveys (DK, FI, IT, UK) and from cohort studies in Sweden. An overview of the studies is presented in . All analyses were performed by using SPSS statistical software package (version 12, Chicago). The non-parametric Kruskal-Wallis ranked test was used to test the differences in the distribution of the total lignan intakes between Denmark, Finland, and Italy. Lignan intakes and source estimates were calculated by Microsoft Office Excel (2003).
Table 1 Description of the food consumption data
Results
The mean lignan intake estimated using the Dutch lignan database with the four lignan precursors SECO, MAT, LARI, and PINO was lowest among Finnish women (1,036 µg/day) and highest among Swedish men (1,947 µg/day) (). It is noticeable that the SECO and MAT figures are systematically smaller when calculated using the Dutch data set compared with the Finnish database. SECO contributed between 11 and 22% to the lignan intake, MAT between 1 and 3%, LARI between 41 and 45% and PINO between 32 and 44%. The total lignan intake was approximately four times higher when the estimates were calculated using the Dutch lignan database compared to the results based on the Finnish lignan database (Fineli® database). According to the latter estimates, the mean lignan intake was lowest among Italian women (272 µg/day) and highest among Danish women (439 µg/day) and SECO contributed between 81 and 94% to the lignan intake and MAT between 6 and 19%.
Table 2 Lignan intakes (g/day) from five European countries calculated using the Dutch and the Finnish (Fineli®) lignan database (mean values)
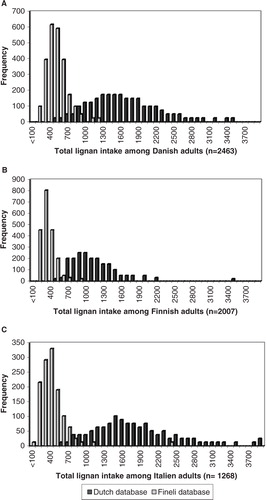
The frequency distribution of the estimated total lignan intake among Danish, Finnish, and Italian adults using the Dutch and Finnish (Fineli®) lignan databases is shown in . The mean lignan intake between countries estimated using the Dutch lignan database of plant foods ranged from 404 µg/day among Finnish adults to 569 µg/day among Italian adults and was slightly skewed toward higher values. The mean lignan intake estimated using the Finnish (Fineli®) lignan database within one country ranged from 91 to 2,335 µg/day among Italian adults and was strongly skewed toward higher values. Significant differences were found between the three countries in the total lignan intakes estimated using both the Dutch database (P<0.001) and the Finnish (Fineli®) lignan databases (P<0.001) (data not shown).
Fig. 1 Distribution of estimated lignan intake (µg/day) among adults in Denmark (A), Finland (B), and Italy (C) calculated using the Dutch and the Finnish (Fineli®) lignan database.
The main food groups and food items contributing to the lignan intake estimated using the Dutch lignan database are shown in . Only food groups and food items, that contributed more than 5% to total lignan intake, have been included in the table. The most important food groups were ‘cereals and grain products’, ‘vegetables’, and ‘fruit and berries’. Cereals and grain products contributed 15–43% of total lignan intake, vegetables16–30%, and fruit and berries 15–46%.
Table 3 Contribution of aggregated food groups and individual foods to the total lignan intake by gender in five European countries calculated using the Dutch lignan database1(%)
Appendix A. Content of lignan and lignan precursors (SECO, MAT, LARI, PINO) in foods and notes on which the lignan values were chosen
Beverages were an additional major source of lignans in all countries. The importance of selected food items varied across countries. Rye was the most important contributor to the lignan intake in the Scandinavian countries Denmark and Finland, whereas wheat and other grains were more important in Sweden, Italy, and United Kingdom. Cabbages were important contributors to lignan intake in Sweden and United Kingdom, whereas the group ‘fruit vegetables’ (e.g. sweet pepper, tomatoes) contributed most to the lignan intake from vegetables in Italy. Malaceous and prunus species fruits (e.g. apricot, peach, pear, and nectarines) were the most important contributors to lignan intake in Italy but were less important contributors in other counties. Tea was the most important contributor to lignan intake in the United Kingdom and in combination with coffee, was a major source to lignan intake in all countries. Among men in Denmark, Italy, and United Kingdom, alcoholic beverages, especially beer and wine contribute to about 10% of the total lignan intake ().
Discussion
The estimated mean lignan intake was approximately fourfold higher when calculations were based on the Dutch lignan database of plant foods including four lignan precursors compared with the calculations using the Finnish lignan database (Fineli®) that includes two lignan precursors SECO and MAT. The additional contribution to the mean lignan intake from the two additional precursors LARI and PINO was 41–45% and 32–44%, respectively. These results are in accordance with data from other investigators concluding LARI and PINO to present >70% of the total lignan intake (Citation30). Dietary lignan intake further was more strongly associated with plasma enterolignan concentrations when taking all four mammalian lignans into account (Citation31).
Estimations of lignan intake based on the Dutch lignan database showed that the major sources of lignans in Europe are from the food groups: ‘cereals and grain products’, ‘vegetables’, ‘fruit and berries’, and ‘beverages’.
In this study, we introduced a relatively simple approach to estimate total lignan intake when food intake data are available. In our approach, average lignan values were applied to food groups that are common in food databases. We used food groups that are known to contribute considerably to the total lignan intake and aggregated them into 42 food groups. The total amount of lignan intake was calculated based on the aggregated amounts of food consumed and the average weighted lignan content of that food group.
In this study, the estimated total lignan intakes based on the Dutch lignan database including four lignan precursors were of similar range as an earlier estimate of the lignan intake of 979 µg/day among Dutch men and women aged 19–97 years (Citation20) and very recent estimates among Finnish men (Citation7) and Italian men and women (Citation32). Compared to the total lignan intakes among Dutch men and women, the total lignan intakes were higher in Denmark and Sweden and within similar range in Finland, Italy, and United Kingdom. The high lignan intakes in Denmark and Sweden were mainly due to a higher consumption of rye and wheat products, respectively. In all Scandinavian countries, cereals and grain products are important contributors to lignan intake whereas fruits and berries are main contributors in Italy and beverages (tea, coffee, and beer) are main contributors in the United Kingdom.
The inclusion of the precursors LARI and PINO in the estimated total lignan intake has shown that more food groups contribute to the total lignan intakes than earlier expected. Vegetables, fruit, and berries are important contributors to the total lignan intakes because they have a relatively high content of LARI and PINO (Citation18). When using four lignan precursors, LARI, and PINO were the main contributors to the lignan intake in all five countries. This has been confirmed also in more recent studies (Citation7, Citation32).
In earlier studies, where the lignan intakes was estimated based on MAT and SECO, the major contributor to the lignan intakes was grain products, whereas tea, coffee, nuts, seeds, and selected fruits and vegetables only contributed to a smaller proportion of the intake (Citation21, Citation22) (Citation33). The systematically lower values for the SECO + MAT intake values estimated using the Dutch database compared with the values estimated from the Finnish database can be explained mainly by the different analytical methods (Citation18, Citation24).
Some issues need to be discussed in order to fully appreciate the results. First, the 42 food groups were selected because they are important contributors to lignan intake based on former knowledge (Citation24). For each of the 42 food groups, a lignan value was chosen to represent the lignan content of all foods from that food group. The decisions on which these plant lignan values were chosen are provided in Appendix A. The lignan values were calculated from a mean of all foods from a particular food group or from a weighted average. An average was weighted according to the importance of foods consumed from a particular food group and taken into account that certain single foods such as sesame seeds and flaxseeds have a high lignan content. It should be noted that the approach used in this study results in a relatively narrow range of lignan intake. Furthermore, both food databases used in this study have been developed from analyses of locally representative foods in the Netherlands and Finland, respectively. Possible differences in the lignan content of country-specific foods due to differences in types of foods available, preparation of foods, available brands are not taken into account in this study. Finally, the fact that the food consumption data were collected using three different dietary assessment methods, i.e. 7-day food records in Denmark, Italy, and the United Kingdom, a 48-h dietary recall in Finland, and a food frequency questionnaire (FFQ) in Sweden, the results are not directly comparable. This may have led to a larger variation and differences in the estimated lignan intakes across countries. However, the results also reflect different dietary patterns and different food intakes.
In conclusion, we have shown that the total lignan intake was approximately fourfold higher after inclusion of the two new mammalian lignan precursors, LARI and PINO, when compared to estimates based on only SECO and MAT. Furthermore, we have shown that LARI and PINO contributed the majority of the lignan intakes in all five countries. When LARI and PINO were included in the estimation of the total lignan intakes, the major sources of lignans were cereals and grain products, vegetables, fruit, berries, and beverages.
Conflict of interest and funding
The authors have not received any funding or benefits from industry or elsewhere to conduct this study.
Acknowledgements
This article is written on behalf of the Phytohealth consortium WP1. Special thanks go to Taina Öhman, Corinna Koebnik, Eva Crammatiki, Alicia Wolk, Yannis Manios, Clarissa Bingham, and Aedin Cassidy for their collaboration to this work. This work was carried out with financial support from the Commission of the European Communities, PHYTOHEALTH QLRT-2001-09453. It does not necessarily reflect its views and in no way anticipates the Commission's future policy in this area.
References
- Borriello SP, Setchell KD, Axelson M, Lawson AM. Production and metabolism of lignans by the human faecal flora. J Appl Bacteriol. 1985; 58: 37–43.
- Setchell KD, Lawson AM, Borriello SP, Harkness R, Gordon H, Morgan DM, etal. Lignan formation in man–microbial involvement and possible roles in relation to cancer. Lancet. 1981; 2: 4–7.
- Hausner H, Johnsen NF, Hallund J, Tetens I. A single measurement is inadequate to estimate enterolactone levels in Danish postmenopausal women due to large intraindividual variation. J Nutr. 2004; 134: 1197–200.
- Kuijsten A, Arts IC, Vree TB, Hollman PC. Pharmacokinetics of enterolignans in healthy men and women consuming a single dose of secoisolariciresinol diglucoside. J Nutr. 2005; 135: 795–801.
- Morton MS, Matos-Ferreira A, Abranches-Monteiro L, Correia R, Blacklock N, Chan PS, etal. Measurement and metabolism of isoflavonoids and lignans in the human male. Cancer Lett. 1997; 114: 145–51.
- Lampe JW, Atkinson C, Hullar MA. Assessing exposure to lignans and their metabolites in humans. J AOAC Int. 2006; 89: 1174–81.
- Nurmi T, Mursu J, Peñalvo JL, Poulsen HE, Voutilainen S. Dietary intake and urinary excretion of lignans in Finnish men. Br J Nutr. 2010; 103: 677–85.
- Van der Schouw YT, Kreijkamp-Kaspers S, Peeters PH, Keinan-Boker L, Rimm EB, Grobbee DE. Prospective study on usual dietary phytoestrogen intake and cardiovascular disease risk in Western women. Circulation. 2005; 111: 465–71.
- Peterson J, Dwyer J, Adlercreutz H, Scalbert A, Jacques P, McCullough ML. Dietary lignans: physiology and potential for cardiovascular disease risk reduction. Nutr Rev. 2010; 68: 571–603.
- Keinan-Boker L, Der Schouw YT, Grobbee DE, Peeters PH. Dietary phytoestrogens and breast cancer risk. Am J Clin Nutr. 2004; 79: 282–8.
- Hedelin M, Klint A, Chang ET, Bellocco R, Johansson JE, Andersson SO, etal. Dietary phytoestrogen, serum enterolactone and risk of prostate cancer: the cancer prostate Sweden study (Dietary lignans: physiology and potential for cardiovascular disease risk reduction. Nutr Rev. 2010; 68: 571–603.
- Zaineddin AK, Vrieling A, Buck K, Becker S, Linseisen J, Flesch-Janys D, etal. Serum enterolactone and postmenopausal breast cancer risk by estrogen, progesterone and herceptin 2 receptor status. Int J Cancer. 2012; 130: 1401–10.
- Vanharanta M, Voutilainen S, Rissanen TH, Adlercreutz H, Salonen JT. Risk of cardiovascular disease-related and all-cause death according to serum concentrations of enterolactone: Kuopio Ischaemic Heart Disease Risk Factor Study. Arch Intern Med. 2003; 163: 1099–104.
- Guglielmini P, Rubagotti A, Boccardo F. Serum enterolactone levels and mortality outcome in women with early breast cancer: a retrospective cohort study. Breast Cancer Res Treat. 2012; 132: 661–8.
- Mabrok HB, Klopfleisch R, Ghanem KZ, Clavel T, Blaut M, Loh G. Lignan transformation by gut bacteria lowers tumor burden in a gnotobiotic rat model of breast cancer. Carcinogenesis. 2012; 33: 203–8.
- Abarzua S, Serikawa T, Szewczyk M, Richter DU, Piechulla B, Briese V. Antiproliferative activity of lignans against the breast carcinoma cell lines MCF 7 and BT 20. Arch Gynecol Obstet. 201; 285: 1145–51.
- Lin Y, Yngve A, Lagergren J, Lu Y. Dietary intake of lignans and risk of adenocarcinoma of the esophagus and gastroesophageal junction. Cancer Causes Control. 2012; 23: 837–44.
- Milder IE, Arts IC, van de PB, Venema DP, Hollman PC. Lignan contents of Dutch plant foods: a database including lariciresinol, pinoresinol, secoisolariciresinol and matairesinol. Br J Nutr. 2005; 93: 393–402.
- Heinonen S, Nurmi T, Liukkonen K, Poutanen K, Wahala K, Deyama T, etal. In vitro metabolism of plant lignans: new precursors of mammalian lignans enterolactone and enterodiol. J Agric Food Chem. 2001; 49: 3178–86.
- Milder IE, Feskens EJ, Arts IC, Bueno de Mesquita HB, Hollman PC, Kromhout D. Intake of the plant lignans secoisolariciresinol, matairesinol, lariciresinol, and pinoresinol in Dutch men and women. J Nutr. 2005; 135: 1202–7.
- Boker LK, Van der Schouw YT, De Kleijn MJ, Jacques PF, Grobbee DE, Peeters PH. Intake of dietary phytoestrogens by Dutch women. J Nutr. 2002; 132: 1319–28.
- De Kleijn MJ, Van der Schouw YT, Wilson PW, Adlercreutz H, Mazur W, Grobbee DE, etal. Intake of dietary phytoestrogens is low in postmenopausal women in the United States: the Framingham study(1–4). J Nutr. 2001; 131: 1826–32.
- Horn-Ross PL, Barnes S, Lee M, Coward L, Mandel JE, Koo J, etal. Assessing phytoestrogen exposure in epidemiologic studies: development of a database (United States). Cancer Causes Control. 2000; 11: 289–98.
- Valsta LM, Kilkkinen A, Mazur W, Nurmi T, Lampi AM, Ovaskainen ML, etal. Phyto-oestrogen database of foods and average intake in Finland. Br J Nutr. 2003; 89(Suppl 1): S31–8.
- Lyhne N, Groth MV, Christensen T, Fagt S, Biltoft-Jensen A, Hartkopp H, etal. Danskernes kostvaner 2000–2002. hovedresultater (Dietary habits in Denmark 2000–2002). 2005; Søborg, Denmark: Danish Institute of Food and Veterinary Research.
- Männistö S, Ovaskainen M-L, Valsta L. The national findiet study. 2002; Helsinki, Finland: National Public Health Institute. 2003.
- Turrini A, Saba A, Perrone D, Cialfa E, D'Amicis A. Food consumption patterns in Italy: the INN-CA study 1994–1996. Eur J Clin Nutr. 2001; 55: 571–88.
- Wolk A, Bergstrom R, Hunter D, Willett W, Ljung H, Holmberg L, etal. A prospective study of association of monounsaturated fat and other types of fat with risk of breast cancer. Arch Intern Med. 1998; 158: 41–5.
- Henderson L, Gregory J, Swan G. The National diet and nutrition survey: adults aged 19–64 years. Types and quantities of foods consumed. Report of the office for national statistics and food standard agency. 2002; London: TSO.
- Zamora-Ros R, Knaze V, Luján-Barroso L, Kuhnle GG, Mulligan AA, Touillaud M, etal. Dietary intakes and food sources of phytoestrogens in the European prospective investigation into cancer and nutrition (EPIC) 24-hour dietary recall cohort. Eur J Clin Nutr. 2012; 66: 932–41.
- Milder IE, Kuijsten A, Arts IC, Feskens EJ, Kampman E, Hollman PC, etal. Relation between plasma enterodiol and enterolactone and dietary intake of lignans in a Dutch endoscopy-based population. J Nutr. 2007; 137: 1266–71.
- Pellegrini N, Valtuena S, Ardigo D, Brighenti F, Franzini L, Del Rio D, etal. Intake of the plant lignans matairesinol, secoisolariciresinol, pinoresinol, and lariciresinol in relation to vascular inflammation and endothelial dysfunction in middle age-elderly men and post–menopausal women living in Northern Italy. Nutr Metab Cardiovasc Dis. 2010; 20: 64–71.
- Linseisen J, Piller R, Hermann S, Chang-Claude J. Dietary phytoestrogen intake and premenopausal breast cancer risk in a German case-control study. Int J Cancer. 2004; 110: 284–90.