
Abstract
Background
Consumption of fruit has been associated with a variety of health benefits, yet, 75% of children have usual intakes of total fruit below minimum recommended amounts. Apples are the second most commonly consumed fruit in the United States; however, no studies have examined the impact of apple consumption on nutrient intake and adequacy in children's diets.
Objective
The purpose of this study is to examine the association between apple (various forms) consumption with nutrient intake and nutrient adequacy in a nationally representative sample of children.
Design
Participants were children aged 2–18 years (n=13,339), from the National Health and Nutrition Examination Survey 2003–2010. Least square means of total energy and nutrient intake, and the percentage of the population below the estimated average requirement (EAR) or above the adequate intake (AI) among apple consumers and non-consumers were examined.
Results
Consumers of total apple products had higher (p<0.01) total intakes of fiber, magnesium, and potassium and lower intakes of total fat, saturated fatty acids, monounsaturated fatty acid, and sodium than non-consumers. Apple consumers had higher (p<0.01) total sugar intake, but lower intake of added sugars compared to non-consumers. A lower (p<0.01) percentage of apple consumers were below the EAR for 13 of the 16 nutrients studied. Apple consumers had approximately a 10 percentage unit difference below the EAR for calcium and magnesium, and vitamins A, C, D, and E, than non-consumers. The percentage above the AI for fiber was significantly (p<0.0001) higher among total apple consumers (6.24±0.45 g) compared to non-consumers (0.57±0.07 g). The results were similar for individual apple products (i.e. apple juice, applesauce, and whole apples).
Conclusion
Consumption of any forms of apples provided valuable nutrients in the diets of children.
To access the supplementary material to this article, please see Supplementary files under ‘Article Tools’.
Consumption of fruit has been associated with a variety of health benefits (Citation1) including a reduced risk of cardiovascular disease (Citation2–Citation5), type 2 diabetes (Citation5–Citation7), and some types of cancer (Citation5, Citation8). Despite these health benefits, approximately 75% of children (9–13 years of age) have usual intakes of total fruit below minimum recommended amounts (Citation9). Most fruits are major contributors of a number of nutrients that are underconsumed in the United States, including dietary fiber, vitamins A and C, folate, and potassium. Dietary fiber and potassium have been identified as nutrients of public health concern by the 2010 Dietary Guidelines for Americans (DGA) (Citation10). Most children consume dietary fiber and potassium in amounts lower than current recommendations (Citation10).
One hundred percent fruit juice makes up approximately 35–50% of the total fruit intake of children 9–18 years (Citation11) and contributes to their total nutrient intake and overall diet quality (Citation12–Citation15). Compared with non-consumers, consumers of 100% fruit juice had significantly higher intakes of energy, vitamins C and B6, riboflavin, iron, folate, magnesium, and potassium; and significantly lower intakes of saturated fatty acids (SFA), discretionary fat, and added sugars (Citation12–Citation14). Apples (Malus domestica) are the second most commonly consumed fruit in the United States (Citation16), with 65% of the apple crop consumed as fresh fruit and 35% as processed apple products (e.g. juice, cider, or applesauce) (Citation17). A medium raw apple (182 g), with skin, provides approximately 95 kilocalories (kcal), 19 g total sugars, 4 g dietary fiber (22% of the daily value), and 195 mg of potassium. In addition, raw apples contain virtually no total fat, SFA, sodium, or cholesterol. Processed apples have a slightly different nutrient profile than raw apples but still contribute valuable nutrients in the diet and count toward the fruit recommendation (Citation10, Citation18). Apples are also the top source of phenolics, especially hydroxycinnamic acid derivatives and flavonoids (Citation19) in the United States (Citation20). There are no studies that have examined the impact of apple consumption (in various forms) on nutrient intake and nutrient adequacy in the diets of children. Thus, the purpose of this study is to examine the association between apple and apple product consumption (fresh fruit, apple sauce, or apple juice) with nutrient intake and nutrient adequacy in a nationally representative sample of children using the National Health and Nutrition Examination Survey (NHANES) 2003–2010 data.
Subjects and methods
Data collection
The NHANES is conducted on a continual basis by the National Center for Health Statistics of the Centers for Disease Control and Prevention. One of major objectives of NHANES is to provide data for investigators to be able to examine the relationship among diet, nutrition, and health (Citation21). Details regarding the survey design, content, operations, and procedures are available online (Citation21–Citation23).
Study population and dietary intake
Participants were children 2–18 years (n=13,339) who participated in the 2003–2010 NHANES. Demographic information was determined from the NHANES interview administered in the Mobile Examination Center. Intake data were obtained from What We Eat in America which collected an in-person, automated, multiple-pass, 24-hour dietary recall interview and a telephonic 24-hour dietary recall conducted 3–10 days later (Citation24, Citation25). Detailed descriptions of the dietary interview methods are provided in the NHANES Dietary Interviewers Procedure Manuals (Citation26, Citation27). Caretakers, usually parents, provided the 24-hour dietary recalls of children 2–5 years; children 6–11 years were assisted by an adult; all others provided their own recalls. Unreliable recall data as assessed by the USDA Food Surveys Research Group (n=275), pregnant and lactating females (n=83), and those consuming breast milk (n=10) were excluded from the analysis. The NHANES has stringent protocols and procedures that ensure confidentiality and protect individual participants from identification using federal laws (Citation28) and additional Institutional Review Board approval was not required.
Determination of apple product consumption
Apple and apple product consumption was determined by using the cycle-appropriate USDA Food and Nutrient Database for Dietary Studies food codes (Citation29) for: 1) whole apples (food codes 62101100, 62101200, 62101220, 62101300, 63101000, 63101210, 63101310, 63101320, 63101330, 63101410, 63101420, 63101500, 63401060); 2) applesauce (which includes cooked apples) (food codes 63101110, 63101120, 63101130, 63101140, 63101150, 67102000, 67102010, 67102020, 67104060, 67104080); 3) 100% apple juice (food codes 64101010, 64104010, 64104050, 64104090, 67202000, 67202010); and 4) total apples (included all food codes from the first three groups). Although the term ‘whole apple’ is used in this study, this term refers not only to whole apples consumed out of hand but also includes apple slices. For each participant, daily total energy and nutrient intakes from foods and beverages were obtained from the total nutrient intake files associated with each data release. The Vitamin D Addendum to USDA Food and Nutrient Database for Dietary Studies 3.0 (Citation29) was used to determine vitamin D intake. Intake from supplements was not considered. Several versions of the USDA Food and Nutrient Database for Dietary Studies were used to determine the nutrient content of foods in the four NHANES releases used in this study. Four separate apple consumption groups were generated: whole apples, applesauce, 100% apple juice, and total apples.
Statistical analysis
Least square means (LSM) of total energy and nutrient intake were based on the first dietary recall data. The covariates used in the LSM analysis were age, gender, race/ethnicity, poverty income ratio grouped into three categories (<1.25, 1.25–3.49, and >3.49), physical activity level (sedentary, moderate, and vigorous), and total energy intake (the latter was not included in analysis of energy intake). The National Cancer Institute (NCI) Method (Citation30) was used to estimate usual intake of selected nutrients in terms of nutrient adequacy. The 2 days of intake, using Day 1 sampling weights, were used to obtain necessary variance estimates. The NCI SAS (SAS Institute Inc., Cary, NC) macros Mixtran v.1.1 and Distrib v.1.1 were used to generate parameter estimates after covariate adjustment and to estimate the distribution of usual intake via the Monte Carlo method, respectively (Citation31). Covariates for these analysis were sequence of participant's intake (Day 1 or Day 2) and a variable for weekday/weekend consumption. Differences among apple consumers and non-consumers among the four apple consumption groups were determined by computing population Z statistics generated from usual intake variables. The percentage of the population below estimated average requirement (EAR) or above the adequate intake (AI) (Citation32) among apple consumers and non-consumers was also examined. For all analysis, study-specific dietary sample weights (Citation33) were used to adjust the variance for the complex sample design of NHANES using the statistical package SUDAAN (version 9.0.3 [2007] Research Triangle Institute, Research Triangle Park, NC).
Results
Apple consumption and sample demographics
The sample consisted of children 2–18 years (n=13,339), of which ~26% of the population (n=3,482) consumed some form of apple products: ~12% (n=1,714) consumed apple juice, 3% (n=332) consumed applesauce, and 14% (n=1,891) consumed whole apple. There was overlap in the population, with some children consuming more than one apple product in 1 day. Among consumers, mean intake of any apple products was 222.2±3.9 g, apple juice was 9.6±0.24 fluid ounces (272.5±6.7 g; 1.2 cup equivalents), applesauce was 129.8±5.7 g (~1/2 cup equivalent), and whole apple was 143±3.8 g (~1 cup equivalent).
For the total sample, very few demographic differences were observed between consumers and non-consumers of total apple products. The non-consumers of apple products were significantly older (p<0.0001) with a higher percentage of current smokers (p<0.0001) compared to consumers (). Demographic differences for the specific apple product groups, namely apples, apple sauce, and apple juice are shown in Supplementary Table 1a–c. Compared to consumers, non-consumers of apple juice were significantly older (p<0.0001) with a higher percentage of current smokers (p<0.0001). Non-consumers of apple sauce were significantly older (p<0.0001) with a higher percentage of Mexican–Americans (p<0.0001) and a lower percentage of non-Hispanic whites (p<0.0001); a lower percentage reporting sedentary-to-moderate physical activity (p<0.01), and a higher percentage of current smokers (p<0.0001). Non-consumers of whole apple consumption were significantly older (p<0.0001) with a higher percentage of non-Hispanic blacks (p<0.01) and current smokers (p<0.0001), and a lower percentage of Mexican–Americans (p<0.01).
Table 1 Demographics of children 2–18 years (n=13,339) participating in NHANES 2003–2010 by total apple/apple product consumption
Total apple consumption
Consumers of total apple products had significantly (p<0.01) higher total intakes of dietary fiber, magnesium, and potassium and lower intakes of total fat, SFA, monounsaturated fatty acids (MUFA), and sodium than non-consumers. Although consumers had a significantly higher total sugar intake, added sugar intake was lower compared to non-consumers ().
Table 2 Mean nutrient intake±SE in children 2–18 years participating in NHANES 2003–2010 by total apple and apple juice consumption (n=13,339)
Apple juice consumption
Consumers of apple juice had significantly (p<0.01) higher intakes of potassium and lower intakes of total fat, SFA, and MUFA. Although the apple juice consumers had a significantly higher intake of total sugars, added sugar intake was lower compared to non-consumers. Dietary fiber and sodium were similar for consumers and non-consumers ().
Applesauce consumption
Consumers of applesauce had significantly (p<0.01) higher intakes of total sugars than non-consumers. No other nutrient intake differences were found among the consumers and non-consumers of applesauce ().
Table 3 Mean nutrient intake±SE in children aged 2–18 years participating in NHANES 2003–2010 by applesauce and whole apple consumption (n=13,339)
Whole apple consumption
Consumers of whole apples had significantly (p<0.01) higher intakes of dietary fiber, magnesium, potassium, iron, and lower intakes of total fat, SFA, and MUFA than non-consumers. Although whole apple consumers had significantly higher intake of total sugars, added sugar intake was lower than non-consumers ().
Percentage of children with usual intakes not meeting recommendations
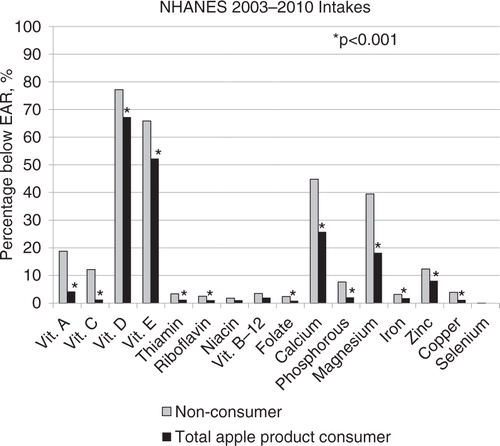
A significantly (p<0.01) lower percentage of total apple consumers was below the EAR for 13 of the 16 nutrients studied (). Total apple consumers had approximately a 10 percentage unit difference in the population below the EAR for calcium and magnesium, and vitamins A, C, D, and E. The percentage above the AI for fiber was significantly (p<0.0001) higher among total apple consumers (6.24±0.45) compared to non-consumers (0.57±0.07). No differences were found in the percentage above the AI for potassium (data not shown). The results were very similar for the specific apple products (i.e. apple juice, applesauce, and whole apple) (data not shown).
Fig. 1 Percentage of children with usual intakes not meeting recommendations by total apple consumption.
Discussion
This is the first published study to examine apple and apple product intake and their effects on the nutrient intake and dietary adequacy of children. Approximately, 26% of the population consumed some type of apple product. Whole apple, apple juice, or total apple consumers consumed an average of at least one cup equivalent of the corresponding product on the day of the recall. Applesauce consumers consumed approximately half that amount. Only applesauce was lower than the number of cup equivalents seen in a national study that examined all whole fruit and 100% fruit juice consumption of children 2–18 years (Citation34), suggesting that apple consumption made a major contribution to the total fruit intake by children.
The fruit recommendation for children is age and gender dependent with 1.5 or 2 cups as the recommendation for most children over 4 years (Citation18). Intake of fruit, including 100% fruit juice, is important because it has been associated with increased nutrient intake and adequacy (Citation35–Citation37), which in turn, is associated with reduced risk of chronic disease (Citation2–Citation5, Citation38, Citation39). The majority of children do not meet the recommendation for fruit (Citation40, Citation41). Apple consumers have a higher intake of total fruit than non-consumers (data not shown) suggesting not only apples contribute to increased fruit consumption, but apple consumption may also be associated with overall increased fruit intake, as has been shown in studies looking at consumption of 100% fruit juice (Citation12, Citation13, Citation42).
Consumers of total apple products had significantly higher total intakes of dietary fiber, magnesium, and potassium than non-consumers. Dietary fiber and potassium were identified as nutrients of public health concern and magnesium is a shortfall nutrient identified by the 2010 DGA (Citation10). Consumers also had higher mean intakes of total sugars than non-consumers, however, levels of added sugars were lower in every consumption group except those consuming applesauce, suggesting that the nutrient intakes are reflecting the intrinsic sugars of the apples. Applesauce can be prepared with or without added sugars (Citation43), so this may account for the differences shown in mean intakes of total sugars and added sugars. Finally, consumers had lower mean intakes of two nutrients to limit – SFA and sodium than non-consumers. Total apple consumption was also associated with improved nutrient adequacy for 15 of the 20 nutrients studied, specifically for vitamins A, C, D, and E; calcium; magnesium; and dietary fiber. A full discussion of all these nutrients is beyond the scope of this paper, but it is important to highlight shortfall nutrients and nutrients to limit (Citation10).
Unlike apple juice and applesauce consumers, whole apple and apple product consumers had higher mean intakes and better dietary adequacy for dietary fiber when compared with non-consumers. This was not surprising because whole apples are a good source of dietary fiber (Citation44) and apple juice and applesauce are low in dietary fiber (Citation43). Dietary fiber recommendations for children vary, so comparison with standards can be difficult (Citation45). Mean intakes of dietary fiber in consumers in this study, using the Dietary Reference Intakes (Citation46): 14 g/d and 25 g/d for children 1–3 and 4–8 years, respectively; 31 g/d and 38 g/d for males 9–13 and 14–18 years, respectively; and 26 g/d for females 9–18 years, were still lower than the recommended amounts.
Apples (with skin) contain a mix of insoluble (3.1 g/1 medium apple) and soluble (1.3 g/1 medium apple) fiber (Citation47, Citation48). Apples are an especially rich source of pectin (Citation49), which is a complex set of plant, non-starch polysaccharides (Citation50). Apples should be consumed with their peels because discarding the peels reduces the fiber content by up to 25% (Citation51). In children, fiber intake is inversely associated with blood cholesterol levels (Citation52–Citation55) and constipation (Citation45, Citation56–Citation58), which is a major cause of morbidity (Citation59). The purported mechanisms behind the health effects of fiber are not well established; benefits from fiber may result from changes in intestinal viscosity, rate of passage of intestinal contents, nutrient absorption, and short-chain fatty acids and gut hormone production (Citation60). Thus, fiber-dense foods, including whole apples, should be encouraged among children.
Although all groups of apple consumers, except applesauce consumers, had higher mean intakes of potassium, a nutrient of public health concern, these groups did not have better nutrient adequacy values when compared with non-consumers. The reasons are likely twofold: apples do have some potassium (Citation43), however, they are not considered a potassium-rich fruit, like bananas or oranges, and the potassium recommendation is relatively high (Citation10, Citation61) and intake is relatively low (Citation62, Citation63); thus, it is difficult to make a significant difference in nutrient adequacy.
Only whole apple and total apple consumers had higher intakes of magnesium and better dietary adequacy than seen in non-consumers; neither applesauce nor apple juice showed this pattern. None of the apple products is a rich source of magnesium, so it is likely that the higher intakes of this mineral are not the result of apple product consumption, per se, but rather foods that may be consumed with apples, for example, nuts (Citation43). This was not part of this study but does represent a further line of research, for example, examining apple dietary patterns and how apple consumption influences consumption of other foods.
Of the nutrients to limit, added sugars were lower in all groups except applesauce consumers, as discussed above. In all consumption groups except the applesauce consumers, SFA intake was lower than that in non-consumers. Because applesauce has virtually no fat added (Citation43), this finding likely reflects foods consumed with applesauce, such as roasted meats, or other foods consumed during the rest of the day. On average, however, all four groups of consumers and non-consumers exceeded the recommendation for SFA of less than 10% of energy (Citation10). Sodium intake was lower in the total apple consumption group only; although it was higher than recommendations in all groups (Citation10). It is important when interpreting nutrient differences in a 24-hour period that these differences do not reflect apple consumption solely but reflect other foods consumed throughout the day. It has been shown that children who consume apple products do have overall better diet quality (Citation64).
Of special interest were the results from the 100% apple juice consumption group. Apple juice consumption, in particular, has been associated with not only obesity in children, but also with stunted growth in children 2 and 5 years (Citation65); although another study was unable to replicate their findings (Citation64). In contrast with other studies looking at consumption of 100% fruit juice (Citation12, Citation13), this study did not show higher energy intake among apple juice consumers when compared with non-consumers. Furthermore, the high sugar content of 100% fruit juice has been cited as a reason to limit consumption. This study showed that although total sugars were higher in apple juice consumers they were also higher in all groups of apple consumers and added sugars were not higher. Unfortunately 100% fruit juice consumption is declining (Citation34) and children are missing the opportunity for greater intake of important nutrients, such as potassium. Aside from potassium, intake of none of the other micronutrients was lower in 100% apple juice consumers, suggesting that 100% apple juice, even when consumed in greater amounts than recommended by the American Academy of Pediatrics for young children (Citation66), does not lead to inadequate intakes of micronutrients or excess energy intake.
Strengths and limitations
The strengths of this study were that it included a large sample size with a nationally representative sample of children. The NHANES has carefully controlled protocols and screens 24-hour dietary recalls confirming they are valid and complete; the NHANES also uses the multiple-pass method to obtain dietary intake, which is the best dietary assessment method available for large-scale, epidemiologic studies. The assessment of nutrient adequacy in this study is an improvement over other studies of fruit that have simply examined nutrient intake (Citation12, Citation67), because it is a better estimate of how groups meet the EAR and AI than mean nutrient intake. To determine nutrient adequacy, an individual's usual intake (UI) must be determined, so more than one dietary recall must be available. Twenty-four-hour dietary recalls used in this study do have several intrinsic limitations: they are memory dependent, and under- and over-reporting may occur. In proxy-assisted recalls of children, parents may know what their children consume at home (Citation68, Citation69), but they may not know what their children consume outside the home, for example in school or day care (Citation70). The sample size for children consuming applesauce was small, so one needs to be cautious when interpreting the results. Finally, cause-and-effect relationships cannot be determined from cross-sectional, epidemiologic data.
Conclusion and recommendations
In conclusion, the consumption of whole apples, applesauce, apple juice, and all apple products provided valuable nutrients in the diets of children. All apple products should be encouraged, in age-appropriate amounts and as part of a healthy diet (Citation71) in children to help them meet nutrient requirements.
Conflict of interest and funding
Partial support received from USDA/ARS and from Dr. Pepper/Snapple. The funding agencies had no input into the study design or interpretation of the data. The authors declare no conflict of interest regarding this paper.
Supplemental Figure 1a. Percentage of children with usual intakes not meeting recommendations by apple juice consumption
Download MS Power Point (77 KB)Supplemental Figure 1b. Percentage of children with usual intakes not meeting recommendations by applesauce consumption
Download MS Power Point (76.7 KB)Supplemental Figure 1c. Percentage of children with usual intakes not meeting recommendations by whole apple consumption
Download MS Power Point (76.7 KB)Notes
To access the supplementary material to this article, please see Supplementary files under ‘Article Tools’.
References
- Slavin JL, Lloyd B. Health benefits of fruits and vegetables. Adv Nutr. 2012; 3: 506–16.
- Hung HC, Joshipura KJ, Jiang R, Hu FB, Hunter D, Smith-Warner SA, etal. Fruit and vegetable intake and risk of major chronic disease. J Natl Cancer Inst. 2004; 96: 1577–84.
- He FJ, Nowson CA, Lucas M, MacGregor GA. Increased consumption of fruit and vegetables is related to a reduced risk of coronary heart disease: meta-analysis of cohort studies. J Hum Hypertens. 2007; 21: 717–28.
- Dauchet L, Amouyel P, Hercberg S, Dallongeville J. Fruit and vegetable consumption and risk of coronary heart disease: a meta-analysis of cohort studies. J Nutr. 2006; 136: 2588–93.
- Global Strategy on Diet, Physical Activity and Health: diet, nutrition and the prevention of chronic diseases. Report of the joint WHO/FAO expert consultation. WHO Technical Report Series, No. 916 (TRS 916). Available from: http://www.who.int/dietphysicalactivity/en/; 2003 [cited 1 April 2015]..
- Muraki I, Imamura F, Manson JE, Hu FB, Willett WC, van Dam RM, etal. Fruit consumption and risk of type 2 diabetes: results from three prospective longitudinal cohort studies. Br Med J. 2013; 347: f5001.
- Carter P, Gray LJ, Troughton J, Khunti K, Davies MJ. Fruit and vegetable intake and incidence of type 2 diabetes mellitus: systematic review and meta-analysis. Br Med J. 2010; 341: c4229.
- Wang Q, Wang X, Gong G, Li G, Li C. Consumption of fruit, but not vegetables, may reduce risk of gasteric cancer: results from a meta-analysis of cohort studies. Eur J Cancer. 2014; 50: 1498–509.
- National Cancer Institute. Usual dietary intakes: recommended amounts of total fruits table. Available from: http://appliedresearch.cancer.gov/diet/usualintakes/pop/2007-10/table_b01.html; 2014 [cited 1 April 2015]..
- Office of Disease Prevention and Health Promotion. Dietary guidelines for Americans. Available from: http://www.health.gov/dietaryguidelines/2010.asp; 2010 [cited 1 April 2015]..
- National Cancer Institute. Usual dietary intakes: food intakes, US Population, 2007–10. Available from: http://appliedresearch.cancer.gov/diet/usualintakes/pop/2007-10/#results; 2014 [cited 25 August 2014]..
- Nicklas TA, O'Neil CE, Kleinman R. Association between 100% juice consumption and nutrient intake and weight of children aged 2 to 11 years. Arch Ped Adolesc Med. 2008; 162: 557–65.
- O'Neil C, Nicklas T, Zanovec M, Fulgoni III V. Diet quality is positively associated with 100% fruit juice consumption in children and adults in the United States: NHANES 2003–2006. Nutr J. 2011; 10: 1–10.
- O'Neil CE, Nicklas TA, Zanovec M, Kleinman RE, Fulgoni III VL. Fruit juice consumption is associated with improved nutrient adequacy in children and adolescents: the National Health and Nutrition Examination Survey (NHANES) 2003–2006. Public Health Nutr. 2012; 15: 1871–8.
- O'Neil CE, Nicklas TA.Rippe JM. Childhood obesity and the consumption of 100% fruit juice: where are the evidence-based findings?. Principles of anatomy and physiology. 2014; New York, NY: Springer. 247–76.
- United States Department of Agriculture. Economic Research Service. Food availability (per capita) data system. Available from: http://www.ers.usda.gov/data-products/food-availability-%28per-capita%29-data-system/.aspx#.U_tVLmM08oE; 2014 [cited 25 August 2014]..
- Mark's Fruit Crops. Apple – Malus domestica. Available from: http://www.fruit-crops.com/apple-malus-domestica/ [cited 25 August 2014]..
- United States Department of Agriculture. MyPlate. Available from: http://www.choosemyplate.gov [cited 27 August 2014]..
- Malec M, Le Quéré JM, Sotin H, Kolodziejczyk K, Bauduin R, Guyot S. Polyphenol profiling of a red-fleshed apple cultivar and evaluation of the color extractability and stability in the juice. Agric Food Chem. 2014; 62: 6944–54.
- Boyer J, Liu RH. Apple phytochemicals and their health benefits. Nutr J. 2004; 12: 1–15.
- Centers for Disease Control and Prevention. National Health and Nutrition Examination Survey (NHANES) 2007–2008. 2009; Public Data General Release File Documentation.. Available from: http://www.cdc.gov/nchs/nhanes/nhanes2007-2008/generaldoc_e.htm [cited 9 March 2015]..
- United States Department of Health and Human Services. Centers for Disease Control and Prevention. National Center for Health Statistics. National Health and Nutrition Examination Survey (NHANES), 2013–2014. Overview. Let's improve our health. 2013 Available from: http://www.cdc.gov/nchs/data/nhanes/nhanes_13_14/2013-14_overview_brochure.pdf [cited 9 March 2015]..
- Centers for Disease Control and Prevention. National Center for Health Statistics. National Health and Nutrition Examination Survey. Questionnaires, datasets, and related documentation. Available from: http://www.cdc.gov/nchs/nhanes/nhanes_questionnaires.htm; 2014 [cited 9 March 2015]..
- Moshfegh AJ, Rhodes DG, Baer DJ, Murayi T, Clemens JC, Rumpler WV, etal. The US Department of Agriculture Automated Multiple-Pass Method reduces bias in the collection of energy intakes. Am J Clin Nutr. 2008; 88: 324–32.
- Blanton CA, Moshfegh AJ, Baer DJ, Kretsch MJ. The USDA Automated Multiple-Pass Method accurately estimates group total energy and nutrient intake. J Nutr. 2006; 136: 2594–9.
- National Center for Health Statistics (NHANES). MEC In-Person dietary interviewers procedures manual. Available from: http://www.cdc.gov/nchs/data/nhanes/nhanes_01_02/dietary_year_3.pdf; 2002 [cited 9 March 2015]..
- National Center for Health Statistics. Phone follow-up dietary interviewer procedures manual. Available from: http://www.cdc.gov/nchs/data/nhanes/nhanes_03_04/DIETARY_PFU.pdf; 2004 [cited 1 April 2015]..
- Centers for Disease Control and Prevention. National Health and Nutrition Examination Survey. Is my survey information confidential?. Available from: http://www.cdc.gov/nchs/nhanes/participant.htm#confidentiality; 2013 [cited 1 April 2015]..
- U.S. Department of Agriculture, Agricultural Research Service. USDA food and nutrient database for dietary studies, versions 1.0–4.1 documentation and user guide, 2004, 2006, and 2008. Available from: http://www.ars.usda.gov/Services/docs.htm?docid=12089; 2014 [cited 25 August 2014].
- National Cancer Institute. Usual dietary intakes: The NCI Method. Available from: http://appliedresearch.cancer.gov/diet/usualintakes/method.html; 2013 [cited 1 April 2015]..
- National Cancer Institute. Usual dietary intakes: SAS macros for analysis of a single dietary component. Available from: http://appliedresearch.cancer.gov/diet/usualintakes/macros_single.html; 2013 [cited 1 April 2015]..
- National Research Council. Dietary reference intakes: applications in dietary assessment. Washington, DC: the National Academy Press. Available from: http://www.nap.edu/catalog.php?record_id=9956; 2002 [cited 5 August 2014]..
- Centers for Disease Control and Prevention. The National Health and Nutrition Examination Survey. Analytic and reporting guidelines, 2011–2012. Available from: http://www.cdc.gov/nchs/nhanes/analytic_guidelines.htm [cited 9 March 2015]..
- Kim SA, Moore LV, Galuska D, Wright AP, Harris D, Grummer-Strawn LM, etal. Vital signs: fruit and vegetable intake among children – United States, 2003–2010. MMWR Morb Mortal Wkly Rep. 2014; 63: 671–6.
- Lorson BA, Melgar-Quinonez HR, Taylor CA. Correlates of fruit and vegetable intakes in US children. J Am Diet Assoc. 2009; 109: 474–8.
- Cooke L. The importance of exposure for healthy eating in childhood: a review. J Hum Nutr Diet. 2007; 20: 294–301.
- Liu RH. Health benefits of fruit and vegetables are from additive and synergistic combinations of phytochemicals. Am J Clin Nutr. 2003; 78: 517S–20S.
- Mirmiran P, Noori N, Zavareh MB, Azizi F. Metabolism. 2009; 58: 460–8.
- Oyebode O, Gordon-Dseagu V, Walker A, Mindell JS. Fruit and vegetable consumption and all-cause, cancer and CVD mortality: analysis of Health Survey for England data. Community Health. 2014; 68: 856–62.
- Guenther PM, Dodd KW, Reedy J, Krebs-Smith SM. Most Americans eat much less than recommended amounts of fruits and vegetables. J Am Diet Assoc. 2006; 106: 1371–9.
- Fox MK, Condon E, Briefel RR, Reidy KC, Deming DM. Food consumption patterns of young preschoolers: are they starting off on the right path?. J Am Diet Assoc. 2010; 110: S52–S9.
- O'Neil C, Nicklas T, Rampersaud G, Fulgoni VR. One hundred percent orange juice consumption is associated with better diet quality, improved nutrient adequacy, and no increased risk for overweight/obesity in children. Nutr Res. 2011; 31: 673–82.
- United States Department of Agriculture. Agricultural Research Service. National nutrient database for standard reference. Release 26. Available from: http://ndb.nal.usda.gov/ [cited 27 August 2014]..
- United States Food and Drug Administration. CFR – Code of Federal Regulations Title 21 – Food and Drugs, Chapter 1 – Food and Drug Administration, Department of Health and Human Services, Sub-Chapter B – Food for Human Consumption, Part 101 – Food Labeling, Sub-part A – General Provisions, Sec. 101.12 Reference amounts customarily consumed per eating occasion. Available from: http://www.accessdata.fda.gov/scripts/cdrh/cfdocs/cfcfr/cfrsearch.cfm?fr=101.12; 2013 [cited 21 August 2014]..
- Kranz S, Brauchla M, Slavin JL, Miller KB. What do we know about dietary fiber intake in children and health? The effects of fiber intake on constipation, obesity, and diabetes in children. Adv Nutr. 2012; 3: 47–53.
- Food and Nutrition Board, Institute of Medicine, National Academies. Dietary Reference Intakes (DRIs): estimated average requirements. Available from: http://www.nal.usda.gov/fnic/DRI/DRI_Tables/recommended_intakes_individuals.pdf [cited 21 August 2014]..
- Li BW, Andrews KW, Pehrsson PR. Individual sugars, soluble, and insoluble dietary fiber contents of 70 high consumption foods. J Food Compost Anal. 2002; 15: 715–23.
- Marlett JA, Cheung T. Database and quick methods of assessing typical dietary fiber intakes using data for 228 commonly consumed foods. J Am Diet Assoc. 1997; 97: 1139–48.
- Moriarty PM, Backes J, Dutton JA, He J, Ruisinger JF, Schmelzle K. Apple pectin for the reduction of niacin-induced flushing. J Clin Lipidol. 2013; 7: 140–6.
- Thakur BR, Singh RK, Handa AK. Chemistry and uses of pectin–a review. Crit Rev Food Sci. 1997; 37: 47–73.
- Marlett JA, Marlett JA. Changes in content and composition of dietary fiber in yellow onions and red delicious apples during commercial storage. J AAOC Int. 2000; 83: 992–6.
- Brown L, Rosner B, Willett WW, Sacks FM. Cholesterol lowering effects of dietary fiber: a meta-analysis. Am J Clin Nutr. 1999; 69: 30–42.
- Erkkila AT, Lichtenstein AH. Fiber and cardiovascular disease risk: how strong is the evidence?. J Cardiovasc Nurs. 2006; 21: 3–8.
- Fernandez ML. Soluble fiber and nondigestible carbohydrate effects on plasma lipids and cardiovascular risk. Curr Opin Lipidol. 2001; 12: 35–40.
- Theuwissen E, Mensink RP. Water-soluble dietary fibers and cardiovascular disease. Physiol Behav. 2008; 94: 285–92.
- Stewart ML, Nikhanj SD, Timm DA, Thomas W, Slavin JL. Evaluation of the effect of four fibers on laxation, gastrointestinal tolerance and serum markers in healthy humans. Ann Nutr Metab. 2010; 56: 91–8.
- Chao HC, Lai MW, Kong MS, Chen SY, Chen CC, Chiu CH. Cut-off volume of dietary fiber to ameliorate constipation in children. J Pediatr. 2008; 153: 45–9.
- Lee WT, Ip KS, Chan JS, Lui NW, Young BW. Increased prevalence of constipation in pre-school children is attributable to under-consumption of plant foods: a community-based study. J Paediatr Child Health. 2008; 44: 170–5.
- Loening-Baucke V. Functional constipation. Semin Pediatr Surg. 1995; 4: 26–34.
- Lattimer JM, Haub MD. Effects of dietary fiber and its components on metabolic health. Nutrients. 2010; 2: 1266–89.
- Institute of Medicine. DRI: Dietary reference intakes for water, potassium, sodium, chloride, and sulfate: a report of the Panel on Dietary Reference Intakes for Electrolytes and Water. 2004; Washington, DC: The Standing Committee on the Scientific Evaluation of Dietary Reference Intakes, Food and Nutrition Board, The National Academies Press.
- Weaver CM. Potassium and health. Adv Nutr. 2013; 4: 368S–77S.
- Fulgoni VL III, Keast DR, Bailey RL, Dwyer J. Food fortificants, and supplements: where do Americans get their nutrients?. J Nutr. 2011; 141: 1847–54.
- O'Neil CE, Nicklas TA, Fulgoni III VL. Consumption of apples is associated with a better diet quality and reduced risk of obesity in children: National Health and Nutrition Examination Survey (NHANES) 2003–2010. Nutr J. 2015; 14: 48.
- Dennison BA, Rockwell HL, Nichols MJ, Jenkins P. Children's growth parameters vary by type of fruit juice consumed. J Am Coll Nutr. 1999; 18: 346–52.
- American Academy of Pediatrics Committee on Nutrition. Policy statement: use and misuse of fruit juice in pediatrics. Pediatrics. 2001; 107: 1210–13.
- O'Neil CE, Nicklas TA, Kleinman R. Relationship between 100% juice consumption and nutrient intake and weight of adolescents. Am J Health Promot. 2010; 24: 231–7.
- Klesges RC, Klesges LM, Brown G, Frank GC. Validation of the 24-hour dietary recall in preschool children. J Am Diet Assoc. 1987; 87: 1383–5.
- Baranowski T, Sprague D, Baranowski JH, Harrison JA. Accuracy of maternal dietary recall for preschool children: socioeconomic status and daycare factors. J Am Diet Assoc. 1991; 91: 669–74.
- Fisher JO, Butte NF, Mendoza PM, Wilson TA, Hodges EA, Reidy KC, etal. Overestimation of infant and toddler energy intake by 24-h recall compared with weighed food records. Am J Clin Nutr. 2008; 88: 407–15.
- Freeland-Graves J, Nitzke S. Position of the academy of nutrition and dietetics: total diet approach to healthy eating. J Acad Nutr Diet. 2013; 113: 307–17.