
Abstract
Background
Isolation of extracellular vesicles from plasma is a challenge due to the presence of proteins and lipoproteins. Isolation of vesicles using differential centrifugation or density-gradient ultracentrifugation results in co-isolation of contaminants such as protein aggregates and incomplete separation of vesicles from lipoproteins, respectively.
Aim
To develop a single-step protocol to isolate vesicles from human body fluids.
Methods
Platelet-free supernatant, derived from platelet concentrates, was loaded on a sepharose CL-2B column to perform size-exclusion chromatography (SEC; n=3). Fractions were collected and analysed by nanoparticle tracking analysis, resistive pulse sensing, flow cytometry and transmission electron microscopy. The concentrations of high-density lipoprotein cholesterol (HDL) and protein were measured in each fraction.
Results
Fractions 9–12 contained the highest concentrations of particles larger than 70 nm and platelet-derived vesicles (46%±6 and 61%±2 of totals present in all collected fractions, respectively), but less than 5% of HDL and less than 1% of protein (4.8%±1 and 0.65%±0.3, respectively). HDL was present mainly in fractions 18–20 (32%±2 of total), and protein in fractions 19–21 (36%±2 of total). Compared to the starting material, recovery of platelet-derived vesicles was 43%±23 in fractions 9–12, with an 8-fold and 70-fold enrichment compared to HDL and protein.
Conclusions
SEC efficiently isolates extracellular vesicles with a diameter larger than 70 nm from platelet-free supernatant of platelet concentrates. Application SEC will improve studies on the dimensional, structural and functional properties of extracellular vesicles.
To access the supplementary material to this article, please see Supplementary files under Article Tools online.
The scientific and clinical interest in plasma-derived vesicles is tremendous, since these vesicles may contain clinically relevant information Citation1–(Citation5) . Isolation of vesicles from plasma with good recovery and without contamination of proteins and lipoproteins, however, is a challenge. Thus far, most isolation protocols are based on differential centrifugation. After removal of cells in the first low-speed centrifugation step, vesicles are isolated using centrifugal accelerations of 19,000–100,000 g (Citation6). Unfortunately, protein aggregates are generated at high velocities of ~100,000 g, Citation7–(Citation9) and vesicles may clump. Isolation of vesicles from plasma is further hampered by the viscosity and density of plasma, and by the presence of lipoprotein particles with a density and diameter similar to the extracellular vesicles of interest (Citation6, Citation10) (Citation11). Consequently, isolation of vesicles from plasma or serum by density-gradient ultracentrifugation results in co-isolation of high-density lipoprotein (HDL), and isolation of HDL results in co-isolation of vesicles [as described in the response of Yuana Y. and Nieuwland R. to (Citation12) and by Vickers K.C. et al. (Citation13)]. Thus, there is an urgent need for a simple and fast protocol to isolate vesicles from human plasma.
In platelet research, two different protocols are commonly applied to isolate platelets from platelet-rich plasma, that is, to replace the plasma by buffer. In one procedure, platelets are isolated from the plasma by centrifugation and washing (Citation14, Citation15). In the other procedure, platelets are isolated by size-exclusion chromatography (SEC), also known as “gel filtration” (Citation15, Citation16). SEC has also been used previously to isolate vesicles from sera, ascites and saliva, and was shown to separate vesicles from proteins Citation17–(Citation20) . Whether SEC separates vesicles from HDL, however, has never been investigated. In this study, we investigate the efficacy of single-step SEC for isolation of extracellular vesicles from human platelet-free supernatant of platelet concentrates and we studied the separation of vesicles by SEC from HDL and proteins.
Material and methods
Platelet concentrates
Platelet concentrates were from Sanquin (Amsterdam, The Netherlands). Buffy coats from 5 whole blood units are pooled together with one plasma unit of one of these donors. Subsequently, this pool was gently centrifuged. The resulting platelet rich plasma was slowly extracted using an automated separator via leukocyte reduction filter to a PVC-citrate storage bag. Platelet concentrates (n=3, 9–12 days old,<1 leukocyte/3×108 platelets) were stored with agitation at room temperature until use.
Platelet-depleted plasma
Platelet concentrate (30 mL) was diluted 1:1 with filtered phosphate-buffered saline [PBS; 1.54 mol/L NaCl, 12.4 mmol/L Na2HPO4, 2.05 mmol/L NaH2PO4, pH 7.4; 0.22 µm filter (Merck chemicals BV, Darmstadt, Germany)]. Next, 12 mL acid citrate dextrose (ACD; 0.85 mol/L trisodiumcitrate, 0.11 mol/L D-glucose and 0.071 mol/L citric acid) was added and the suspension was centrifuged for 20 minutes at 800 g, 20°C. Thereafter, the vesicle-containing supernatant was isolated and centrifuged (20 minutes at 1,550 g, 20°C) to remove remaining platelets. This centrifugation procedure was repeated for 3 cycles, to ensure complete removal of platelets.
SEC column
Sepharose CL-2B (30 mL, GE Healthcare; Uppsala, Sweden) was washed with PBS containing 0.32% trisodiumcitrate (pH 7.4, 0.22 µm filtered). Subsequently, the tip of a 10 mL plastic syringe [Becton Dickinson (BD), San Jose, CA] was stuffed with nylon stocking (20 denier, Hema, Amsterdam, The Netherlands), and the syringe was stacked with 10 mL washed sepharose CL-2B () to create a column with diameter of 1.6 cm and height of 6.2 cm ().
Collection of fractions
Platelet-free supernatant of a platelet concentrate (1.5 mL) was loaded on the column, followed by elution with PBS/0.32% citrate (pH 7.4, 0.22 µm filtered). The eluate was collected in 26 sequential fractions of 0.5 mL (). For each fraction, the number of particles was determined by nanoparticle tracking analysis (NTA), resistive pulse sensing (RPS) and flow cytometry. In addition, HDL cholesterol and protein concentrations were measured for each fraction. Of each fraction, ~200 µL was frozen in liquid nitrogen and stored at −80°C for subsequent transmission electron microscopy (TEM) on thawed fractions.
Nanoparticle tracking analysis
The concentration and size distribution of particles in collected fractions was measured with NTA (NS500; Nanosight, Amesbury, UK), equipped with an EMCCD camera and a 405 nm diode laser. Silica beads (100 nm diameter; Microspheres-Nanospheres, Cold Spring, NY) were used to configure and calibrate the instrument. Fractions were diluted 10–1,000-fold in PBS to reduce the number of particles in the field of view below 200/image. Of each fraction, 10 videos, each of 30-seconds duration, were captured with the camera shutter set at 33.31 ms and the camera gain set at 400. All fractions were analysed using the same threshold, which was calculated by custom-made software (MATLAB v.7.9.0.529). Analysis was performed by the instrument software (NTA 2.3.0.15).
Resistive pulse sensing
The concentration and size distribution of particles was measured with RPS (qNano; Izon Science Ltd, Christchurch, New Zealand) using an NP200A nanopore. This nanopore was suitable for the detection of 100–400 nm particles. Samples were measured with 7 mbar pressure, 45 mm stretch and 0.34 V. Samples were analysed for 5 minutes or until 1,000 vesicles were counted, whichever came first. To calibrate size and concentration, carboxylated polystyrene beads (Izon Science Ltd) were sonicated for 10 seconds, diluted in PBS with 0.3 mM sodium dodecyl sulphate and analysed immediately after dilution.
Flow cytometry
To detect platelet vesicles, 20 µL of each fraction was incubated for 15 minutes with an antibody against glycoprotein IIIa (CD61), which is a subunit of the platelet fibrinogen receptor and also known as integrin β3, phycoerythrin (PE)-conjugated CD61; 5 µL 1:10 prediluted in PBS/citrate, Pharmingen, San Diego, CA). IgG1-PE (BD) was used as control antibody. To detect all vesicles, 20 µL of each fraction was labelled with lactadherin (fluorescein isothiocyanate-conjugated, 5 µL 1:10 prediluted in PBS/citrate). After incubation, 300 µL PBS/citrate was added and samples were analysed on a FACSCalibur (BD, Cellquest version 4.0.2) for 1 minute at a flow rate of 60 µL min−1. The trigger was set on FSC at E00, SSC voltage of 329, threshold FSC 30, SSC 0. No gates were used to determine extracellular vesicles.
Transmission electron microscopy
After thawing, samples from all fractions, both undiluted and 50-fold diluted in PBS, were subjected to overnight fixation, in 0.1% final concentration (v/v) paraformaldehyde (Electron Microscopy Science, Hatfield, PA). Then, a 200-mesh formvar and carbon coated copper grid (Electron Microscopy Science) was placed on a 10 µL droplet to allow adherence of particles to the grid (7 minutes, room temperature). Thereafter, the grid was transferred onto drops of 1.75% uranyl acetate (w/v) for negative staining. Each grid was studied using a transmission electron microscope (Fei, Tecnai-12; Eindhoven, the Netherlands) operated at 80 kV using a Veleta 2,000×2,000 side-mounted CCD camera and Imaging Solutions software (Olympus, Shinjuku, Tokyo, Japan).
Protein
The protein concentration was determined using a Bradford protein assay according to the manufacturer's instructions (Pierce, Rockford, IL). The absorbance was measured at 595 nm on a Spectramax Plus (Molecular Devices, Sunnyvale, CA). In addition, to directly visualize the relative presence of proteins in the collected fractions, in a single experiment, 10 µL of each fraction was mixed with 10 µL 2-fold concentrated reducing sample buffer, boiled for 5 minutes and loaded on an 8–16% gradient gel (BioRad, Hercules, CA). Proteins were stained with Bio-Safe Coomassie G-250 Stain (BioRad).
Western blot
Proteins from all fractions (800 µL) were precipitated using trichloroacetic acid (20% final concentration; Sigma-Aldrich, St. Louis, MO). From each fraction, equal amounts of protein (4 µg) were dissolved in non-reducing sample buffer, boiled and loaded on 8–16% gradient PAGE gels (Biorad), and proteins were transferred to PVDF membrane (Millipore, Billerica, MA). Blots were incubated with anti-CD63 (BD, clone H5C6) or anti-CD9 (BD, clone M-L13), extensively washed and then incubated with a goat-anti-mouse (GAM)-horseradish peroxidase (Dako, Glostrup, Denmark). Subsequently, the PVDF membranes were incubated with a 5-fold diluted peroxidase substrate (LumiLight, Roche Diagnostics, Almere, The Netherlands) for 5 minutes, followed by analysis of luminescence using a LAS4000 luminescence image analyser (Fuji, Valhalla, NY).
High density lipoprotein
HDL Cholesterol was determined using the colorimetric reagent HDL-Cholesterol Plus third generation (Roche Diagnostics, Almere, The Netherlands) on a Cobas C8000 analyser (Roche) as per manufacturer's instructions. This assay specifically detects HDL-associated cholesterol (Citation21). Furthermore, a specific protein present in HDL, apo lipoprotein A1 (APO A1), was measured on an Architect (Abbott, Abbott Park, IL) according to manufacturer's instructions.
Recovery and enrichment
Recovery was defined as the total number of CD61-exposing vesicles in all fractions combined divided by the total number of CD61-exposing vesicles in the starting material. Recovery in a limited number of fractions is the total number in those fractions divided by the total number in the starting material.
The enrichment factor of vesicles to protein or HDL in fraction X is the ratio of CD61-exposing vesicles to protein or HDL in fraction X compared to the ratio of vesicles to protein or HDL in the starting material. Results from 3 independent experiments are presented as the mean±the standard deviation.
Results
Particles by NTA
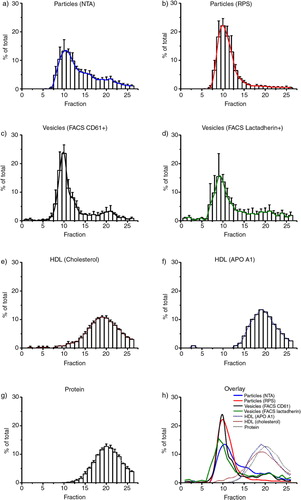
The concentration of particles was determined by NTA in both starting material and fractions. Particles detected by NTA are not necessarily extracellular vesicles. With our settings, NTA will detect single particles with a diameter larger than 70 nm, which may include not only vesicles, but also protein aggregates, chylomicrons [size range 100–2,000 nm (Citation22)] and very low density lipoproteins [VLDL; 27–200 nm (Citation22)]. NTA will not detect HDL [7–12 nm (Citation22)], low density lipoproteins [LDL; 18–23 nm (Citation22)] and intermediate density lipoproteins [IDL; 23–27 nm (Citation22)]. After SEC, the highest concentration of particles was found in fractions 9–12 (a). The recovery of particles measured by NTA was 76%±38, and 46%±6 of the recovered particles were present in fractions 9–12.
Particles by RPS
The concentration of particles was determined by RPS in both the starting material and in the fractions. Also particles detected by RPS are not necessarily vesicles. With our settings, RPS can detect single particles with a diameter of approximately 100–400 nm, which will include vesicles, protein aggregates, chylomicrons and VLDL. RPS will not detect HDL, LDL, or IDL. After SEC, the highest concentrations of particles were present in fractions 9–12 (b). The recovery of particles measured by RPS was 60%±10, and 72%±1 of the recovered particles were present in fractions 9–12 (b).
Detection of platelet-derived vesicles
Since the particles detected in fractions 9–12 by both NTA and RPS are not necessarily vesicles, we applied flow cytometry to distinguish vesicles from lipoprotein particles. Because the studied extracellular vesicles originated from platelets, we used CD61 and lactadherin as vesicle markers. With our settings, the flow cytometer detects vesicles with a diameter larger than 500 nm. The recovery of CD61-exposing vesicles by flow cytometry was 71%±35, and 61%±2 of the recovered vesicles were present in fractions 9–12 (c, for dot plots see Supplementary Fig. 1). The recovery of CD61-exposing vesicles in fractions 9–12 was 43%±23 of the starting material. The recovery of lactadherin-binding vesicles was 163%±55, and 44%±5 of the recovered vesicles were present in fractions 9–12 (d). The recovery of lactadherin-binding vesicles in fractions 9–12 was 73%±31 of the starting material.
Fig. 1. Image of size-exclusion chromatography column. A 10 mL syringe stacked with sepharose CL-2B for isolation of vesicles from platelet-free supernatant of platelet concentrates.
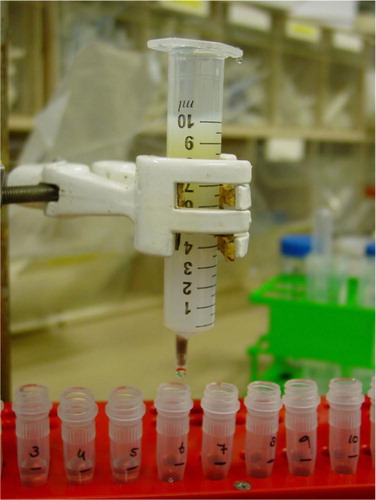
Fig. 2. Presence of vesicles, protein and lipoproteins per fraction. The concentration of vesicles, protein and lipoproteins was measured in each fraction. Each bar shows the number present in a fraction as % of the total number that passed the column. The height of the bar represents the mean, the error bars the standard deviation from 3 experiments. a) Particles (larger than 70 nm) measured by NTA. b) Particles (100–400 nm) measured by RPS. c) CD61+ vesicles measured by flow cytometry. d) Lactadherin+vesicles measured by flow cytometry. e) HDL (Cholesterol) concentration measured by a colorimetric assay. f) HDL (APO A1) concentration measured by a turbidimetric assay. g) Protein concentration measured by a Bradford protein assay h) Overview of all measured results.
Lipoproteins and protein
The recovery of HDL cholesterol was 103%±11, and fractions 18–20 contained 32%±2 of total recovered HDL (e). Although the HDL cholesterol assay is specific for HDL, we confirmed these measurement results by also measuring APO A1, a specific HDL protein, in a control experiment. The recovery of HDL APO A1 was 72% and fractions 18–20 contained 38% of total recovered HDL APO A1 (f). The recovery of protein was 95%±17, and fractions 19–21 contain 36%±2 of total recovered protein (g). Fractions 9–12 contained the majority of vesicles and additionally contained 4.8%±1 of total recovered HDL cholesterol, whereas HDL APO A1 was below the detection limit (0.01 g/L) in these fractions. Fractions 9–12 contained 0.65%±0.3 of total recovered protein.
Overview of detected parameters
h shows an overlay of the percentage of particles (NTA, RPS), vesicles (CD61-exposing, lactadherin-binding), HDL (cholesterol, APO A1) and protein per fraction. Particles and vesicles showed a peak at fraction 10, whereas HDL (cholesterol and APO A1) and protein showed a peak at fraction 19 and 20, respectively. Thus, it is clear that vesicles can be separated from protein and lipoproteins by SEC.
Presence of proteins per fraction
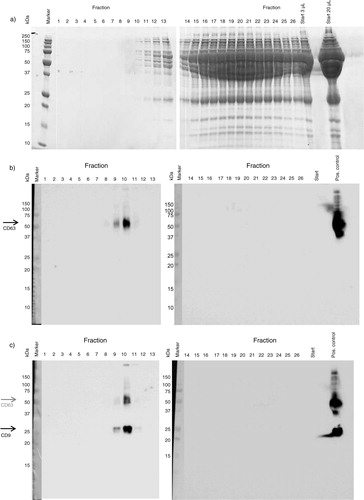
To directly visualize the efficacy of SEC to separate vesicles from plasma proteins, a control experiment was performed in which similar volumes from all collected fractions (as described in Material and Methods) were compared for the presence of plasma protein after gel electrophoresis. The starting material, platelet-free supernatant of a platelet concentrate (1.5 mL), contained very high concentrations of proteins including albumin (66 kDa) when applied directly to gel electrophoresis (3 and 20 µL, a, right gel). Evidently, after SEC low levels of protein become detectable from fraction 8 or 9 onwards, but the bulk of the protein elutes from fraction 15 onwards (a). Thus, vesicles, which are mainly present in fractions 9–12, are clearly separated from the bulk of soluble plasma proteins by SEC.
Presence of CD63 and CD9 per fraction
To confirm the detection of vesicles by flow cytometry, we performed a control experiment to study the presence of CD63 and CD9, both vesicle-associated tetraspanins, by Western blot. CD63 and CD9 were both detectable in fractions 9 and 10 (b and c, respectively), confirming the presence of vesicles in these fractions.
Fig. 3. Presence of proteins, CD63 and CD9 in collected fractions. a) The presence of proteins in each fraction determined by loading 20 µL on PAGE gels. The molecular weight of albumin is 66 kDa. b,c) Presence of tetraspanins in the different fractions was studied by Western blot, with 4 µg protein used per fraction. First, the presence of CD63 was shown (53 kDa, panel b), and next the presence of CD9 was shown (24 kDa, panel c). The tetraspanin bands are indicated by arrows in panels b and c. Platelet lysate was used as positive control.
Visualization of vesicles, lipoproteins and proteins
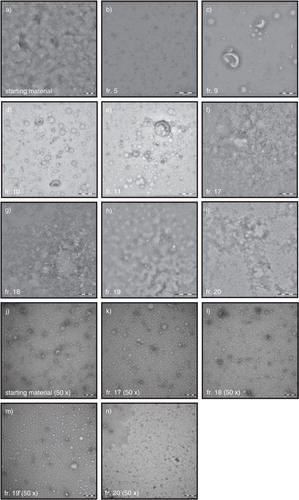
TEM was used to confirm the presence of vesicles or lipoprotein particles. shows representative images of the starting material and fractions 5, 9, 10, 11, 17, 18, 19 and 20 (a–i). In the starting material, vesicles were not visible due to the abundant presence of lipoproteins and proteins (a). To improve the visualization of the contents of the starting material and fractions 17–20, we also performed TEM on 50-fold diluted samples (j–n). In the diluted starting material, vesicles (cup shaped) as well as lipoproteins (white spheres) and proteins (white ragged structures) were visible (j). In fraction 5, no vesicles or lipoproteins are detectable (b), which confirms the results of NTA, RPS and flow cytometry. As expected, in fraction 9 the vesicles were clearly visible but also visible were low numbers of lipoproteins (c). Vesicles were also visible in fractions 10 and 11 (d–e), but the number of lipoprotein particles was increased compared to fraction 9. The vesicles in fractions 9–11 range in diameter from 70 to 500 nm. Very few vesicles and an abundance of proteins and lipoprotein particles were visible in fractions 17–20 (f–i undiluted and k–n 50-fold diluted). Thus, TEM confirms that SEC separates vesicles from proteins and lipoproteins.
Fig. 4. TEM images of fractions. Starting material and fractions, undiluted or 50-fold diluted when indicated, were analysed by TEM for the presence of particles. All images shown are representative images for the starting material (a, j) and fractions 5, 9, 10, 11, 17, 18, 19 and 20 (b–i, k–n). Scale bar is 200 nm (a–g, j–n), 500 nm (h), or 1 µm (i).
Recovery and enrichment
As mentioned, most particles and vesicles were present in fractions 9–12. To gain insight into the extent of purification of the vesicles, we calculated the recovery of CD61-exposing vesicles, protein and HDL cholesterol of fractions 9–12 compared to the starting material (a). In fraction 9, the recovery of vesicles was 14%±9 and the recoveries of protein and HDL cholesterol were low, 0.023%±0.01 and 0.8%±0.07, respectively. Thus, sepharose CL-2B SEC results in a 562±337-fold enrichment of vesicles compared to proteins in the starting material (b), and a 17±11-fold enrichment of vesicles compared to HDL cholesterol (c).
Fig. 5. Recovery and enrichment. The recovery and enrichment relative to the starting material, in the vesicle-containing fractions (9, 9–10, 9–11, 9–12) are shown. a) Recovery of vesicles, protein and HDL (cholesterol) in the vesicle-containing fractions. b) Enrichment factor of vesicle to protein. c) Enrichment factor of vesicle to HDL (cholesterol).
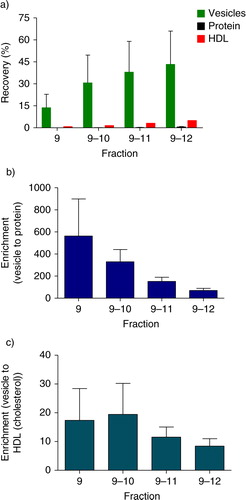
When fractions 9 and 10 were combined, the recovery of vesicles was 31%±19, but this increase was at the expense of an increased contamination with protein and HDL cholesterol compared to fraction 9 alone (a). Nevertheless, combining fractions 9 and 10 gives a 330±111-fold enrichment of vesicles compared to protein (b), and a 19±11-fold enrichment of vesicles compared to HDL cholesterol (c). Combining fractions 9–11 recovered 38%±21 of the vesicles from the starting material and results in a 152±37-fold enrichment of vesicles compared to protein (b), and a 12±4-fold enrichment of vesicles compared to HDL cholesterol (c). Combining fractions 9–12 recovered 43%±23 of vesicles from the starting material and give a 70±19-fold enrichment of vesicles compared to protein (b), and a 8±3-fold enrichment of vesicles compared to HDL cholesterol (c). Thus, it is clear that the recovery of vesicles can be improved by combining fractions 9–11 or 9–12, but this result is at the expense of more contamination by protein and HDL cholesterol (a).
Discussion
We demonstrate that vesicles can be purified from human platelet-free supernatant of platelet concentrates by sepharose CL-2B SEC. With this approach, vesicles can be easily separated from proteins and HDL. We also isolated vesicles from human plasma with SEC, which resulted in similar recoveries of vesicles, proteins and lipoproteins in fractions 9–12 (data not shown).
SEC has several major advantages compared to differential centrifugation and density-gradient ultracentrifugation, which are the most widely applied protocols for vesicle isolation. Compared to differential centrifugation, there is no risk of protein complex formation and vesicle aggregation. In addition, the high viscosity of plasma affects the recovery of vesicles isolated by differential centrifugation (Citation23, Citation24), but does not affect the recovery of vesicles by SEC.
Compared to density-gradient ultracentrifugation, buffers with physiological osmolarity and viscosity can be used. The most commonly applied density gradient for the isolation of vesicles, sucrose (Citation6, Citation7), Citation25–(Citation29) , may have some additional downsides. For example, isolation of organelles by sucrose density-gradient ultracentrifugation is detrimental, since these gradients are “highly viscous and grossly hyperosmotic, leading to slow sedimentation rates for small particles and loss of water from subcellular organelles” (Citation30). Furthermore, whereas several investigators reported a loss of biological function when vesicles are isolated by sucrose density-gradient ultracentrifugation (ISEV meeting Budapest, October 2013), vesicles from saliva isolated by SEC are still fully functional with regard to their capacity to induce coagulation (data not shown, personal communication C.M. Hau), indicating that the biological properties of vesicles seem unaffected after isolation by SEC. Moreover, by density-gradient ultracentrifugation, contaminants with overlapping densities cannot be isolated. For example, the density of HDL considerably overlaps with vesicles (Citation6, Citation10).
The recovery of vesicles isolated with SEC is 43%±23, when combining fractions 9–12. Similar recoveries are reported after isolation of vesicles by (ultra) centrifugation and detection by flow cytometry, namely 50–80% (Citation31). Furthermore, Momen-Heravi showed a recovery of 2% of plasma vesicles after ultracentrifugation as measured by NTA (Citation23). In both studies, however, contamination by proteins and lipoproteins was not studied. When combining fractions 9–12, a reduction of 70-fold in the protein to vesicle ratio and 8-fold in the HDL to vesicle ratio is found. To our knowledge, it is unknown to which extent HDL and protein are reduced in the vesicle fraction after a (sucrose gradient) ultracentrifugation protocol. However, despite the reduced contamination after isolation of vesicles with SEC, we recommend the use of blood samples collected from fasting subjects, to minimize potential contamination by chylomicrons and VLDL.
The principle of SEC is separation based on a difference in size. The sepharose beads in the column have pores with a diameter of approximately 75 nm (Citation32, Citation33), and a tortuous path through the bead. A particle that can enter the beads is delayed due to the increased path length. All particles larger than 75 nm, including lipoproteins, cannot enter the beads and can only travel along with the void volume fluid. Based on our TEM results, the smallest vesicles that are present in fraction 9–12 have a diameter of 70 nm or larger, which confirms the theoretical separation of components below and above 75 nm.
Because the size distribution of vesicles, as measured by RPS and NTA, does not change between the starting material and fraction 9–12 (data not shown), there seems to be no separation of vesicles in the size range from 70 to 500 nm. We confirmed this by making a mixture of 100 and 400 nm silica beads. After application of SEC, 45–48% of both sizes of beads were recovered in fractions 9–12, confirming no separation within this size range (data not shown).
Vesicles smaller than 75 nm are probably present in the fractions high in HDL, that is fractions 18–20. From the size distributions of vesicles in urine (Citation34) and erythrocyte concentrates (Y. Yuana, personal communication), we estimate that approximately 50% of all vesicles are larger than 75 nm. It is unknown whether vesicles smaller than 75 nm harbour different clinical information than the larger vesicles. Sepharose CL-2B has relatively large pores. Choice of a sepharose with smaller pores may allow the isolation of vesicles smaller than 75 nm, albeit with higher contamination by lipoproteins.
We used sepharose CL-2B in a 10 mL plastic syringe (), which has a diameter of 1.6 cm and a height of 6.2 cm. We expect that the column height, column diameter and sample volume can be optimized to improve separation of vesicles from contaminants and the recovery of vesicles. For example, a longer, narrower column with the same volume of sepharose may result in an improved separation of protein and vesicles. A narrower column with a smaller volume of sepharose and the same length, on the other hand, may result in a higher recovery of vesicles. Investigators should optimize those parameters to their own experimental needs.
Because the size distribution of vesicles does not vary between fractions 9 and 12, we assume that the vesicles in each fraction are comparable. Fraction 9 is the purest vesicle fraction, but contains only 14% of the vesicles in the starting material. The method used for further analysis determines whether it is best to collect only fraction 9 or to combine multiple fractions. For example, for proteomics the lowest possible contamination with protein is essential and the use of fraction 9 only may be optimal. For TEM imaging, the background is much improved when comparing fractions 9–11 to the starting material (a–d). Combining multiple fractions may result in a higher density of vesicles on the TEM grid, speeding up the analysis. For flow cytometry, we prefer a higher concentration of vesicles if this does not lead to swarm detection (Citation35, Citation36), and thus fractions 9–12 would be combined.
In conclusion, our study shows that vesicles of a diameter larger than 75 nm can be isolated from complex body fluids such as plasma by single-step SEC. Purification of vesicles in combined fractions 9-12 relative to protein and HDL is 70- and 8-fold, respectively. Recovery of vesicles with sepharose CL-2B SEC is 43% compared to 2–80% with ultracentrifugation. Thus, compared to ultracentrifugation, SEC results in a good recovery of vesicles with almost complete removal of contaminants. Furthermore, vesicle isolation by sepharose CL-2B SEC takes less than 20 minutes, compared to 2–96 hours for ultracentrifugation, thus vesicle samples can be prepared for analysis on the same day of collection. In addition, sepharose CL-2B SEC components cost approximately €15,- and no expensive equipment is needed. Thus, isolation of vesicles by SEC is quick, cheap and easy.
Conflict of interest and funding
Part of this work is funded by a grant from EMRP (European Metrology Research Programme). EMRP project METVES (www.metves.eu) is jointly funded by the EMRP participating countries within EURAMET and the European Union.
Supplementary figure 1
Download PDF (277 KB)Acknowledgements
The authors wish to thank C.M. Hau for her assistance with the experiments, and the Laboratory of Clinical Chemistry for the measurement of HDL Cholesterol and APO A1.
Notes
To access the supplementary material to this article, please see Supplementary files under Article Tools online.
Related Research Data
References
- Li J, Sherman-Baust CA, Tsai-Turton M, Bristow RE, Roden RB, Morin PJ. Claudin-containing exosomes in the peripheral circulation of women with ovarian cancer. BMC Cancer. 2009; 9: 244–55. [PubMed Abstract] [PubMed CentralFull Text].
- Tavoosidana G, Ronquist G, Darmanis S, Yan J, Carlsson L, Wu D et al. Multiple recognition assay reveals prostasomes as promising plasma biomarkers for prostate cancer. Proc Natl Acad Sci. 2011; 108: 8809–14. [PubMed Abstract] [PubMed CentralFull Text].
- Tesselaar ME, Romijn FP, Van Der Linden IK, Prins FA, Bertina RM, Osanto S. Microparticle-associated tissue factor activity: a link between cancer and thrombosis?. J Thromb Haemost. 2007; 5: 520–7. [PubMed Abstract].
- van Doormaal F, Kleinjan A, Berckmans RJ, Mackman N, Manly D, Kamphuisen PW et al. Coagulation activation and microparticle-associated coagulant activity in cancer patients. An exploratory prospective study. Thromb Haemost. 2012; 108: 160–5. [PubMed Abstract].
- Zwicker JI, Liebman HA, Neuberg D, Lacroix R, Bauer KA, Furie BC et al. Tumor-derived tissue factor-bearing microparticles are associated with venous thromboembolic events in malignancy. Clin Cancer Res. 2009; 15: 6830–40. [PubMed Abstract] [PubMed CentralFull Text].
- Thery C, Amigorena S, Raposo G, Clayton A. Isolation and characterization of exosomes from cell culture supernatants and biological fluids. Curr Protoc Cell Biol. 2006. Chapter 3: Unit 3.22.
- Bard MP, Hegmans JP, Hemmes A, Luider TM, Willemsen R, Severijnen LA et al. Proteomic analysis of exosomes isolated from human malignant pleural effusions. Am J Respir Cell Mol Biol. 2004; 31: 114–21. [PubMed Abstract].
- Gyorgy B, Modos K, Pallinger E, Paloczi K, Pasztoi M, Misjak P et al. Detection and isolation of cell-derived microparticles are compromised by protein complexes resulting from shared biophysical parameters. Blood. 2011; 117: e39–48. [PubMed Abstract].
- Rood IM, Deegens JK, Merchant ML, Tamboer WP, Wilkey DW, Wetzels JF et al. Comparison of three methods for isolation of urinary microvesicles to identify biomarkers of nephrotic syndrome. Kidney Int. 2010; 78: 810–16. [PubMed Abstract].
- Redgrave TG, Roberts DC, West CE. Separation of plasma lipoproteins by density-gradient ultracentrifugation. Anal Biochem. 1975; 65: 42–9. [PubMed Abstract].
- van der Pol E, Boing AN, Harrison P, Sturk A, Nieuwland R. Classification, functions, and clinical relevance of extracellular vesicles. Pharmacol Rev. 2012; 64: 676–705. [PubMed Abstract].
- Wagner J, Riwanto M, Besler C, Knau A, Fichtlscherer S, Roxe T et al. Characterization of levels and cellular transfer of circulating lipoprotein-bound microRNAs. Arterioscler Thromb Vasc Biol. 2013; 33: 1392–400. [PubMed Abstract].
- Vickers KC, Palmisano BT, Shoucri BM, Shamburek RD, Remaley AT. MicroRNAs are transported in plasma and delivered to recipient cells by high-density lipoproteins. Nat Cell Biol. 2011; 13: 423–33. [PubMed Abstract] [PubMed CentralFull Text].
- Copley AL, Houlihan RB. Studies on platelets; the isolation of platelets from human and dog blood. Blood. 1947; 1: 170–81. [PubMed Abstract].
- Zucker WH, Shermer RW, MAson RG. Ultrastructural comparison of human platelets separated from blood by various means. Am J Pathol. 1974; 77: 255–67. [PubMed Abstract] [PubMed CentralFull Text].
- Lages B, Scrutton MC, Holmsen H. Studies on gel-filtered human platelets: isolation and characterization in a medium containing no added Ca2+, Mg2+, or K+. J Lab Clin Med. 1975; 85: 811–25. [PubMed Abstract].
- Taylor DD, Zacharias W, Gercel-Taylor C. Exosome isolation for proteomic analyses and RNA profiling. Methods Mol Biol. 2011; 728: 235–46. [PubMed Abstract].
- Taylor DD, Chou IN, Black PH. Isolation of plasma membrane fragments from cultured murine melanoma cells. Biochem Biophys Res Commun. 1983; 113: 470–6. [PubMed Abstract].
- Sokolova V, Ludwig AK, Hornung S, Rotan O, Horn PA, Epple M et al. Characterisation of exosomes derived from human cells by nanoparticle tracking analysis and scanning electron microscopy. Colloids Surf B Biointerfaces. 2011; 87: 146–50. [PubMed Abstract].
- Ogawa Y, Kanai-Azuma M, Akimoto Y, Kawakami H, Yanoshita R. Exosome-like vesicles with dipeptidyl peptidase IV in human saliva. Biol Pharm Bull. 2008; 31: 1059–62. [PubMed Abstract].
- Sugiuchi H, Uji Y, Okabe H, Irie T, Uekama K, Kayahara N et al. Direct measurement of high-density lipoprotein cholesterol in serum with polyethylene glycol-modified enzymes and sulfated alpha-cyclodextrin. Clin Chem. 1995; 41: 717–23. [PubMed Abstract].
- Colhoun HM, Otvos JD, Rubens MB, Taskinen MR, Underwood SR, Fuller JH. Lipoprotein subclasses and particle sizes and their relationship with coronary artery calcification in men and women with and without type 1 diabetes. Diabetes. 2002; 51: 1949–56. [PubMed Abstract].
- Momen-Heravi F, Balaj L, Alian S, Trachtenberg AJ, Hochberg FH, Skog J et al. Impact of biofluid viscosity on size and sedimentation efficiency of the isolated microvesicles. Front Physiol. 2012; 3: 162–7. [PubMed Abstract] [PubMed CentralFull Text].
- O'Brien JR. Cell membrane damage, platelet stickiness and some effects of aspirin. Br J Haematol. 1969; 17: 610–11. [PubMed Abstract].
- Aalberts M, van Dissel-Emiliani FM, van Adrichem NP, van Wijnen M, Wauben MH, Stout TA et al. Identification of distinct populations of prostasomes that differentially express prostate stem cell antigen, annexin A1, and GLIPR2 in humans. Biol Reprod. 2012; 86: 82–90. [PubMed Abstract].
- Keller S, Ridinger J, Rupp AK, Janssen JW, Altevogt P. Body fluid derived exosomes as a novel template for clinical diagnostics. J Transl Med. 2011; 9: 86–95. [PubMed Abstract] [PubMed CentralFull Text].
- Palma J, Yaddanapudi SC, Pigati L, Havens MA, Jeong S, Weiner GA et al. MicroRNAs are exported from malignant cells in customized particles. Nucleic Acids Res. 2012; 40: 9125–38. [PubMed Abstract] [PubMed CentralFull Text].
- Poliakov A, Spilman M, Dokland T, Amling CL, Mobley JA. Structural heterogeneity and protein composition of exosome-like vesicles (prostasomes) in human semen. Prostate. 2009; 69: 159–67. [PubMed Abstract].
- Raposo G, Nijman HW, Stoorvogel W, Liejendekker R, Harding CV, Melief CJ et al. B lymphocytes secrete antigen-presenting vesicles. J Exp Med. 1996; 183: 1161–72. [PubMed Abstract].
- Ford T, Graham J, Rickwood D. Iodixanol: a nonionic iso-osmotic centrifugation medium for the formation of self-generated gradients. Anal Biochem. 1994; 220: 360–6. [PubMed Abstract].
- Jayachandran M, Miller VM, Heit JA, Owen WG. Methodology for isolation, identification and characterization of microvesicles in peripheral blood. J Immunol Methods. 2012; 375: 207–14. [PubMed Abstract] [PubMed CentralFull Text].
- Williams A, Hagel L. Column handbook for size exclusion chromatography. 1999; Philadelphia, PA: Academic Press.
- Hagel L, Östberg M, Andersson T. Apparent pore size distributions of chromatography media. J Chrom A. 1996; 743: 33–42.
- van der Pol E, Hoekstra AG, Sturk A, Otto C, van Leeuwen TG, Nieuwland R. Optical and non-optical methods for detection and characterization of microparticles and exosomes. J Thromb Haemost. 2010; 8: 2596–607. [PubMed Abstract].
- Nolan JP, Stoner SA. A trigger channel threshold artifact in nanoparticle analysis. Cytometry A. 2013; 83: 301–5. [PubMed Abstract] [PubMed CentralFull Text].
- van der Pol E, van Gemert MJ, Sturk A, Nieuwland R, van Leeuwen TG. Single vs. swarm detection of microparticles and exosomes by flow cytometry. J Thromb Haemost. 2012; 10: 919–30. [PubMed Abstract].