
Abstract
Background
Platelet-derived extracellular vesicles (EVs) participate, for example, in haemostasis, immunity and development. Most studies of platelet EVs have targeted microparticles, whereas exosomes and EV characterization under various conditions have been less analyzed. Studies have been hampered by the difficulty in obtaining EVs free from contaminating cells and platelet remnants. Therefore, we optimized an EV isolation protocol and compared the quantity and protein content of EVs induced by different agonists.
Methods
Platelets isolated with iodixanol gradient were activated by thrombin and collagen, lipopolysaccharide (LPS) or Ca2+ ionophore. Microparticles and exosomes were isolated by differential centrifugations. EVs were quantitated by nanoparticle tracking analysis (NTA) and total protein. Size distributions were determined by NTA and electron microscopy. Proteomics was used to characterize the differentially induced EVs.
Results
The main EV populations were 100–250 nm and over 90% were <500 nm irrespective of the activation. However, activation pathways differentially regulated the quantity and the quality of EVs, which also formed constitutively. Thrombogenic activation was the most potent physiological EV-generator. LPS was a weak inducer of EVs, which had a selective protein content from the thrombogenic EVs. Ca2+ ionophore generated a large population of protein-poor and unselectively packed EVs. By proteomic analysis, EVs were highly heterogeneous after the different activations and between the vesicle subpopulations.
Conclusions
Although platelets constitutively release EVs, vesiculation can be increased, and the activation pathway determines the number and the cargo of the formed EVs. These activation-dependent variations render the use of protein content in sample normalization invalid. Since most platelet EVs are 100–250 nm, only a fraction has been analyzed by previously used methods, for example, flow cytometry. As the EV subpopulations could not be distinguished and large vesicle populations may be lost by differential centrifugation, novel methods are required for the isolation and the differentiation of all EVs.
To access the supplementary material to this article, please see Supplementary files under Article Tools online.
Platelets have a well-described physiological role in haemostasis and coagulation, but recently, they have also been shown to participate in immunity, tissue repair and development (Citation1–Citation3). Platelet-derived extracellular vesicles (EVs) provide an abundant source of molecules to help orchestrate these diverse functions, reviewed in Aatonen et al. (Citation4). Platelets can generate both plasma membrane–derived microvesicles or microparticles (MPs) and the endosomal route–derived exosomes (EXOs). Although EXOs from nucleated cells have been extensively studied, to date only a few studies have assessed the existence and roles of platelet EXOs (Citation5–Citation8). Platelet-derived EVs constitute the major fraction of EVs in the circulating plasma, previously considered to be up to 70–80% of the microvesicles, but this number has recently been revised to ~25% based on freeze-fixation electron microscopy of CD41-positive vesicles present in plasma (Citation9). It has also been postulated that the majority of CD41-positive EVs in circulation would originate from megakaryocytes rather than platelets (Citation10), whereas the appearance of platelet-derived EVs would manifest enhanced platelet activation, for example, in context with thrombosis or inflammation. However, the formation of platelet-derived MPs has also been shown to occur in the absence of activation (Citation11), especially under high shear stress (Citation12,Citation13). In any case, an increase of circulating platelet marker-bearing EVs in plasma has been associated with various pathologies, while deficiencies in platelet microvesiculation result in bleeding diathesis, reviewed in (Citation4,Citation14). The prevalence of platelet EVs in various disease settings and their multi-faceted roles in physiology encourage us to reanalyze platelet EVs using contemporary technologies, since the majority of the previous studies using, for example, flow cytometry or functional assays may have preselected a vesicle subpopulation. As the recent advances in the EV field suggest, flow cytometry is unable to detect vesicles <300 nm (Citation15,Citation16), the area which harbours the majority of EVs from nucleated cells based on, for example, nanoparticle tracking analysis (NTA) or atomic force microscopy (Citation17,Citation18).
To characterize platelet-derived EVs from the view point of their differential physiological roles, EV formation was stimulated with platelet agonists previously shown to cause extensive microvesiculation, that is, thrombin and collagen (TC) co-stimulus mimicking the onset of haemostatic/thrombotic events, and Ca2+ ionophore, a universal stimulus for EV formation irrespective of the cell type (Citation19,Citation20). Since platelets have been implicated to act as interleukin 1β-producing innate immune cells (Citation21), and to form MPs by lipopolysaccharide (LPS)-stimulation (Citation7,Citation21,Citation22), we also studied LPS-activation. Particular attention was paid to the isolation of EVs free of other blood cells and platelet remnants. The latter present a challenge due to the small size of unactivated platelets (1–2 µm), and their possible shrinkage depending on activator (Citation23,Citation24), which hampers the EV separation from the generating platelet cell bodies. Thus far, the verification of platelet absence in EV samples has often been overlooked, although the importance of the centrifugation conditions and blood handling has been highlighted in recent studies (Citation25,Citation26). The same attention is needed for the analyses of platelet EVs by high-throughput methods, such as proteomics and transcriptomics. Therefore, an isolation technique for obtaining pure platelet EVs was optimized in this study by first purifying platelets from whole blood of healthy donors and then isolating all EV populations by differential centrifugation (the gold standard method), whilst securing platelet removal. The EVs thus generated were characterized by NTA, transmission electron microscopy (TEM), total protein content and proteomics to test our hypothesis that the number and the molecular cargo of the EV subpopulations is modified by the platelet activation pathway.
Materials and methods
Platelet isolation by density gradient
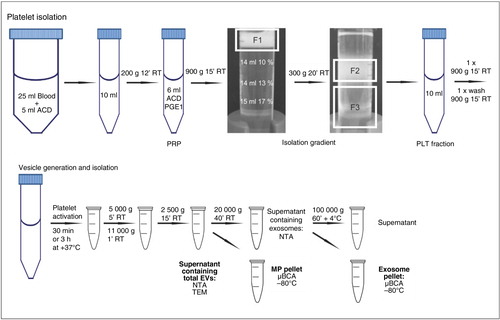
Venous blood was drawn from healthy volunteers who had given their informed consent according to the Declaration of Helsinki and had not taken any medication during the prior 7 days. Blood counts were analyzed with Coulter T-540 (Beckman Coulter, Inc., CA, USA). Blood was collected in the laboratory at the same time in the morning before breakfast, using an 18-gauge needle with a free-flowing technique to prevent platelet activation. The first 3 ml of blood was discarded and the next 25 ml was taken into 5 ml of acidic citrate dextrose (ACD, 39 mM citric acid, 75 mM sodium citrate, 135 mM [D]-glucose, pH 4.5). A detailed flow chart of the isolation procedure, modified from Birschmann et al. (Citation27), is displayed in . Within 20 min of collection, platelet-rich plasma (PRP) was obtained by centrifugation at 200×g for 12 min at room temperature (RT) without a brake (Eppendorf 5810R with A-4-81 rotor, Eppendorf AG, Hamburg, Germany). PRP was transferred into a polypropylene tube and 1/10 volume ACD and 100 ng/ml prostaglandin E1 (PGE1, Sigma-Aldrich, St. Louis, MO, USA) was added to prevent platelet activation during isolation. PRP was centrifuged at 900×g for 15 min at RT and plasma was aspirated. Platelets were suspended in 6 ml of Hepes-NaCl2 buffer (10 mM Hepes, 0.85% NaCl, pH 7.4) and layered on a discontinuous 10–17% iodixanol gradient (OptiPrep, Axis-Shield plc., Dundee, Scotland) in Hepes/NaCl buffer (Citation27). The gradient was centrifuged at 300×g for 20 min at RT without a brake and the platelet fraction was collected (). Platelets were centrifuged at 900×g for 15 min at RT and the resulting pellet was washed once and resuspended with Ca2+-free Tyrode-Hepes buffer (137 mM NaCl, 0.3 mM NaH2PO4, 3.5 mM Hepes, 5.5 mM [D]-glucose, pH 7.35). Platelet concentration was measured with Coulter T-540.
Fig. 1 Flow chart of the isolation of platelets and platelet-free EV subpopulations. Platelets were isolated from whole blood using an iodixanol gradient, as described in the Materials and methods section. After platelet activation to induce vesiculation, platelets and cell remnants were removed by the detailed differential centrifugations and the obtained MP and EXO pellets were stored –80°C for further analyses. Alternatively, the supernatants containing total EVs or EXOs were freshly used for EM- and NTA-analyses. F1, platelet suspension; F2, purified platelets; F3, leukocytes/erythrocytes/granulocytes; PGE1, prostaglandin E1; ACD, acidic citrate dextrose.
Isolation of platelets by washing and gel-filtration
PRP was obtained as described above and transferred into a polypropylene tube following addition of ACD and PGE1 and centrifuged at 650×g for 15 min at RT and plasma was aspirated. Platelets were suspended in 10 ml of Jamieson's buffer (5.5 mM [D]-glucose, 1.28 mM NaCl, 4.26 mM Na2HPO4, 7.46 mM NaH2PO4, 4.77 mM sodium citrate, 2.35 citric acid, 0.35% BSA [Sigma-Aldrich, St. Louis, MO, USA], pH 6.5) and centrifuged at 500×g for 15 min at RT. Supernatant was discarded and pellet was resuspended in Ca2+-free Tyrode-Hepes buffer.
Gel-filtered platelets were prepared from PRP obtained as described above (Citation19) after a single pelleting step (10 min, 1,200×g) in the presence of PGE1 (100 ng/ml). The pellet was suspended in 1–2 ml of Ca2+-free Tyrode-Hepes buffer, which was also used for the pre-equilibration of the 10 ml column of Sepharose CL-2B (GE Healthcare Bio-Sciences AB, Uppsala, Sweden) and for the elution of the platelets in the void volume.
Platelet aggregation
Platelets were adjusted to 300×106 platelets/ml with Ca2+-free Tyrode-Hepes buffer supplemented with 1 mM MgCl2, 2 mM CaCl2 and 3 mM KCl2. Platelet aggregation was assessed via a standard light transmission aggregometer (PACKS-4, Helena Laboratories, Beaumont, TX, USA). Aggregation was determined as the percent change in light transmission after the addition of 60 µM ADP (Sigma-Aldrich), 5 µg/ml collagen (Horm, Nycomed Austria GmbH, Linz, Austria) or 1 U/ml bovine α-thrombin (Enzyme Research Laboratories Ltd., Swansea, UK) during a time period of 360 s.
RT-PCR
Total RNA from 1×10⁹ platelets or 0.5 ml of whole blood was isolated with GeneJET RNA Purification Kit (Fermentas, Thermo Fisher Scientific Inc., Waltham, MA, USA) according to the manufacturer's instructions and measured with BioPhotometer (Eppendorf AG, Hamburg, Germany). cDNA was synthesized from 500 ng of total RNA from platelets or whole blood with RevertAid M-MuLV Reverse Transcriptase and specific PCR with DreamTaq Green DNA Polymerase. The cycling conditions were: initial denaturation for 3 min at +94°C, followed by 40 cycles of 30 sec at +94°C, 30 sec at +60°C or +55°C and 1 min at +72°C, followed by 10 min at +72°C for final extension. PCR products were separated on ethidium bromide stained 1.5% agarose gel and visualized with Bio-Rad Molecular Imager ChemiDoc XRS system (Bio-Rad Laboratories Inc., Hercules, CA, USA) with Quantity One software (v. 4.6.7). All reagents used in the PCR reactions excluding primers (Sigma-Aldrich, described in Supplementary Fig. 2) were purchased from Fermentas. Primers for vWF and CD15 were described by Birschmann et al. (Citation27), whereas primers for HLA-DQβ1 and CD14 were designed with Primer3 software (v. 0.4.0) (Citation28), and tested for possible secondary structures with IDT's OligoAnalyzer 3.1 Self-Dimer and Hetero-Dimer Tools (Integrated DNA Technologies, Inc., Coralville, IA, USA). Gene Ruler 100 bp Plus DNA Ladder (Fermentas) was used as a standard for sizing of PCR products.
Generation of platelet EV populations
Platelets were adjusted to 250×106 platelets/ml with Tyrode-Hepes buffer (1 mM MgCl2, 2 mM CaCl2, 3 mM KCl2) and incubated for 30 min at +37°C with thrombin (1 U/ml) and collagen (10 µg/ml) co-stimulus, Ca2+ ionophore (10 µM, Sigma-Aldrich) or without an agonist, and 3 h at +37°C with or without LPS (100 ng/ml LPS,O111:B4 [Sigma-Aldrich], 100 ng/ml LBP [R&D Systems Inc., Minneapolis, MN, USA], 100 ng/ml CD14 [R&D Systems]). Platelets were also activated with thrombin (1 U/ml), collagen (10 µg/ml), cross-linked CRP-peptide (CRP-XL) (1 µg/ml, a kind gift from Professor Richard Farndale, University of Cambridge, UK), ADP (60 µM, Sigma-Aldrich) and TRAP-6 (10 µM, Bachem AG, Bubendorf, Switzerland) at +37°C for 30 min. The concentrations and time points for the activation were chosen by previous literature to allow maximal platelet vesiculation (Citation7,Citation19,Citation21,Citation29,Citation30). Platelets and cell debris were removed with a centrifugation for 5 min at 5,000×g, followed by 1 min at 11,000×g to obtain a tight pellet followed by transfer into new tubes and a centrifugation for 15 min at 2,500×g at RT (Eppendorf 5415D with F45-24-11 rotor, Eppendorf AG, Hamburg, Germany). The absence of platelets was verified by the Coulter Counter. To obtain the MP pellet, the supernatant was transferred into new tubes (homo-polymer, Axygen, Inc., CA, USA) and centrifuged for 40 min at 20,000×g at RT (Mikro200R with 2424-B rotor, Hettich, Tuttlingen, Germany). The supernatant was transferred into a new tube (polyallomer, Beckman Coulter) followed by a centrifugation of 1 h at 100,000×g at +4°C to collect the EXO pellet (Beckman TL-100 with TLA-55 rotor, k-factor 66, Beckman Coulter). The isolated pellets were stored at −80°C. In addition, platelet vesiculation in the absence of an added agonist was measured after incubation at +37°C for 30 min, 1 h, 2 h, 3 h, 4 h, 6 h and 8 h. A 30-min incubation was undertaken both with and without 2 mM CaCl2. After incubations, the formed EV populations were analyzed with NTA.
Nanoparticle tracking analysis
The number of total EVs (including both MPs and EXOs) or EXOs were analyzed from supernatants after the removal of platelet remnants or MPs, respectively (see ), using NTA instrument LM10 with red laser (638 nm, 40 mW, NanoSight Technology, London, UK) and Merlin F-033B ASG camera (Allied Vision Technologies GmbH, Stadtroda, Germany) to determine vesicle concentrations and size distributions. Samples were injected manually and data acquisition was undertaken at ambient temperature. Settings for data acquisition were: basic, camera level 14, autosettings off, polydispersity and reproducibility high with particles per image 40–100, acquisition time 90 sec. 0.2 µm Fluoresbrite® Multifluorescent Microspheres (Polysciences, Inc., Warrington, PA, USA) beads were run before measurements. Supernatants were measured as they were, or diluted (1:2, 1:10, 1:20 or 1:100) when necessary with 0.1 µm filtered Tyrode-Hepes buffer to obtain optimal concentration for detection (106–109 particles/ml), and measured twice by NTA. Data were analyzed with NTA 2.2 software with settings expert, background extraction/auto blur/auto minimum track length on and minimum expected particle size 50 nm.
Transmission electron microscopy
Supernatants of total EVs were layered onto carbon sputtered glow discharged Piloform-coated 200 mesh copper grids (Agar Scientific, Essex, UK) for 60 s, allowed to dry at RT and negative-stained with 3% (w/v) uranyl acetate (System Biosciences, Mountain View, USA) in water for 20 s. Imaging was performed at 120 kV voltage using a Gatan Multiscan 794 (1×1 k) CCD (charge-coupled device) camera coupled to a Tecnai 12 electron microscope (FEI, Eindhoven, The Netherlands). Vesicle size was manually calculated for ≥400 vesicles/condition.
Protein quantification
Total protein content of the EV pellets was measured with Micro BCA Protein Assay Kit (Pierce, Thermo Scientific, Rockford, IL, USA) according to manufacturer's instructions with BSA as standard. Pellets were resuspended in PBS (50 mM Na2HPO4, 50 mM NaH2PO4, 140 mM NaCl2, pH 7.4) containing 0.25% Triton X-100 (Fluka, Sigma-Aldrich). Samples and standards were mixed with working reagent and incubated 2 h at +37°C. Absorbances were measured at 560 nm with Multiscan EX Microplate Photometer (Labsystems, Thermo Scientific Inc., Waltham, MA, USA).
SDS-PAGE and Western blotting
MP and EXO pellets containing 6 µg of protein were lysed with Laemmli sample buffer and run on 10% gels. Platelet and K562 cell lysates were used as positive controls. Proteins were transferred onto Protran nitrocellulose membrane (Whatman International Ltd., Kent, UK). Membranes were blocked with 5% (w/v) skim milk powder (Valio, Helsinki, Finland) in TBS-T and probed with primary mouse anti-CD41 (Beckman Coulter, Inc.), anti-CD9 (Santa Cruz Biotechnology, Inc., Dallas, TX, USA), anti-TSG101 (BD Transduction Laboratories) and anti-Hsp70 (BD Pharmingen) for 1 h at RT in 3% milk in TBS-T followed by incubation with the secondary antibody anti-mouse-IgG-HRP (GE Healthcare Limited, Buckinghamshire, UK) in 3% milk in TBS-T for 45 min at RT. After extensive washing, the blots were incubated 1 min at RT with Pierce ECL Western Blotting Substrate (Thermo Scientific) and visualized with Amersham HyperfilmTM ECL (GE Healthcare Limited).
Mass spectrometry
In order to avoid donor-dependent bias of proteins, pooled MP and EXO preparations were made from 6 donors (3 female and 3 male) by combining equal amounts of protein from each donor to obtain 14.2 µg protein per condition. Pellets were suspended with AmBic-methanol buffer (0.1% ammonium bicarbonate, 60% methanol, pH >8) for 5 min at RT. Samples were protected from light and reduced with 200 mM dithiothreitol (DTT, USB®Affymetrix, High Wycombe, UK) for 1 h at RT and alkylated for 1 h at RT with 200 mM iodoacetamide (Sigma-Aldrich). DTT was added to consume unreacted iodoacetamide and allowed to react 1 h at RT and the pH was adjusted to >7 with AmBic-methanol buffer. 7.5% (w/w) of sequencing grade modified trypsin (Promega, Madison, USA; 1 µg/µl in 100 mM Tris, pH 7.8) was added and gently mixed to digest the samples overnight at +37°C. The digestion was stopped by 100% acetic acid until pH was <7. The tryptic peptides were dried by centrifugal lyophilization and stored −80°C. Mass spectrometry was performed essentially as previously described (Citation31) with liquid chromatography – mass spectrometry (LC-MS/MS). LC-MS/MS analysis was performed using an Ultimate 3,000 nano-LC (Dionex) and a LTQ Orbitrap XL mass spectrometer (Thermo Fisher Scientific Inc.) with ESI Chip interface (Advion BioSciences Inc., Ithaca, NY, USA) in a positive-ion mode with application of incremental exclusion lists (3 rounds) to increase the number of identified peptides at the Cell Surface Analytics Laboratory (Finnish Red Cross Blood Service, Helsinki, Finland). Peptides were suspended and loaded to a reversed-phase precolumn (ProteCol Guard-C18, 150 µm×10 mm, SGE Analytical Science Pty Ltd, Melbourne, Australia) with 0.1% formic acid and separated in a reversed-phase analytical column (Acclaim PepMap 100, 75 µm×150 mm, Thermo Fisher Scientific Inc.) with a linear 115 min gradient of acetonitrile at +22°C and flow rate of 0.3 µl/min.
Protein identification was performed through Proteome Discoverer software (Thermo Scientific) using an in-house Mascot database search engine version 2.4.0 (Matrix Science). The data were searched against human canonical sequences in the Swiss-Prot database (version 04/2014). The search criteria was as follows: enzyme trypsin; maximum missed cleavages 1; variable modifications carbamidomethyl, oxidation; peptide mass tolerance ± 10 ppm; fragment mass tolerance ± 0.8 Da, instrument type ESI-TRAP and significance threshold p < 0.05. The mass spectrometry proteomics data will be submitted into Vesiclepedia and EVpedia.
Statistical analysis
Statistical significance between 2 groups was analyzed using a paired Student's t-test. Data are presented as means±SD, where n=the number of independent experiments performed. A p-value≤0.05 was considered statistically significant. Correlations between EV concentrations and total protein were analyzed with bivariate correlation analyses by IBM SPSS Statistics (v.22, International Business Machines Corp., New York, USA).
Results
Pure and functional platelets are obtained by an iodixanol density gradient for EV generation
To improve the purity of platelet EVs, we optimized an iodixanol density gradient isolation method to minimize both the contamination by other cell types and platelet pre-activation. The flow chart of the isolation is shown in . To ensure the platelet-specificity of the EVs, platelet preparations were screened for the presence of lymphocytes, monocytes, macrophages and granulocytes by RT-PCR, and compared with platelets isolated by the traditional methods of gel filtration or washing (Supplementary Fig. 1A–C). In RT-PCR, the density-gradient isolated platelets were positive only for mRNA of the platelet marker, von Willebrand factor, whereas the whole blood RNA, used as a positive control, gave a strong signal with all the tested targets (Supplementary Fig. 1C). The other isolation techniques showed the presence of contaminating blood cells (Supplementary Fig. 1A and B).
Isolation procedures may pre-activate platelets and desensitize them for the subsequent activation to induce microvesiculation. Some preactivation of the platelets was induced by the gradient procedure itself (P-Selectin exposure was 18%, Annexin V 2% and PAC-1 4% judged by flow cytometry; data not shown). Therefore, the functionality of the iodixanol gradient–isolated platelets was verified by light transmission aggregometry. When platelets were activated with 1 U/ml thrombin in the absence of exogenous fibrinogen, both the density gradient- and the gel filtration–isolated platelets aggregated, but the density gradient-isolated platelets aggregated more robustly (Supplementary Fig. 1E). Only the density gradient-isolated platelets aggregated, when collagen was used as the agonist. Taken together, these data show that the density gradient isolation method yielded a pure and functional population of platelets for EV generation.
Platelet activation pathway influences the number of formed EVs
Next, EVs were produced from platelets by different agonists, thrombin and collagen co-stimulation (TC), Ca2+ ionophore and LPS, and isolated by differential centrifugations as detailed in . The platelet-derived EV populations were analyzed with NTA and compared with their time-matched controls. NTA-analyses were only performed in the supernatants containing total EVs or the MP-depleted EXOs to avoid pellet suspension-induced aggregate formation of EVs. As expected by the previously published results, Ca2 + ionophore induced the greatest number of platelet EVs, 14.5×of control (142±11×108 EVs/ml, A). Among the physiologically relevant agonists, surprisingly, the thrombotic activation (TC) only induced approx. 1.5×increase of the mean total EV concentration, and the LPS-induced EV generation hardly differed from its control (B). Depending on the agonist 1.5–4 fold more MPs than EXOs were formed under all conditions, as calculated by subtracting the remaining EXO concentrations from the total EVs. NTA analysis of the EXO fraction showed a 2- and a 10-fold increase for TC- and Ca2+ ionophore-activation, respectively, whereas no increase of EXOs was observed by LPS (B).
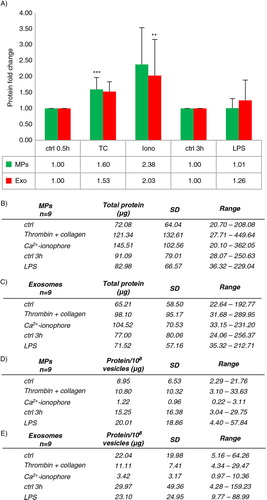
Fig. 2 Concentration of EVs induced by three platelet agonists. Platelets (250×106 platelets/ml) were activated by thrombin and collagen (TC) co-stimulus, LPS or Ca2+ ionophore, and supernatants (total EVs, EXOs) obtained by the differential centrifugations were measured by NTA from 9 donors. Concentrations (108 vesicles/ml) of the formed total EVs and EXOs are shown from 5 different conditions as means with standard deviation and range (A and C). Values for MPs were calculated by subtracting the EXO concentrations from the total EV concentrations (C). Due to the large variability of EV concentrations between donors, fold changes were calculated by comparing each activation to its time-matched control (ctrl 30 min for TC and Ca2+ ionophore, ctrl 3 h for LPS) (B). Statistical significances of the fold changes were determined by t-test (paired two-sample for means, two-way) assuming unequal variances. P-values of less than 0.01 (**) and less than 0.001 (***) were considered significant.
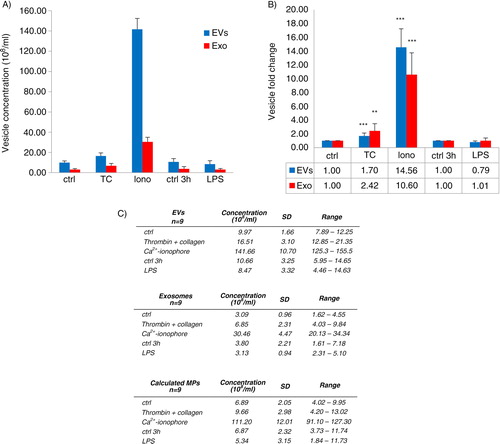
There were large donor-dependent variations of the total EV- and EXO-concentrations measured by NTA (C). Therefore, we chose to calculate and compare fold changes within individual donors which showed statistically significant increases in both the total EV and EXO formation for TC and Ca2+ ionophore activation compared to controls, but not for LPS (B). Interestingly, the TC activation seemed to produce relatively more EXOs than total EVs, whereas Ca2+ ionophore increased the EXO concentration less than the total EVs (B and Supplementary Fig. 2), suggesting that the activation pathways may vary in their efficacy to induce MPs or EXOs.
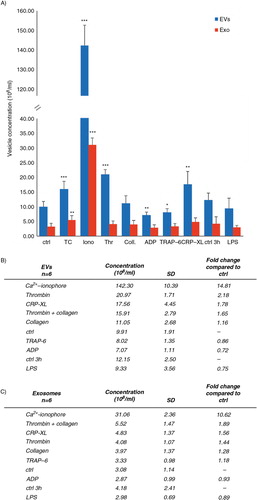
Because of the difference in the number of generated EVs between our NTA-observations and the previous literature, we also measured EV formation by additional platelet activators shown to induce vesiculation. Collagen and the direct glycoprotein VI-activating collagen-related peptide, CRP-XL, have been considered stronger inducers of platelet microvesiculation (Citation32) than thrombin, the thrombin-mimicking hexapeptide TRAP-6 and ADP (Citation29). The order of potency of the agonists in generating total EVs measured by NTA was thrombin > collagen-related peptide (CRP-XL) > TC co-stimulus > collagen, whereas LPS, ADP and TRAP-6 did not differ from the basal level of control samples (A). Also, a slight time-dependent (from 30 min to >3 h) increase in total EVs was observed in the absence of an added agonist (A). To monitor the time-dependent EV formation in the absence of an agonist, a further NTA analysis was undertaken for EV samples from 30 min, 1 h, 3 h, 4 h, 6 h and 8 h incubations, which verified a slight time-dependent increase up to 6 h, followed by a subsequent exponential increase in platelet vesiculation (data not shown). NTA analysis also showed that TC, CRP-XL and thrombin activations increased the number of EXOs, but the results did not reach a statistical difference in the 6 analyzed donors.
Fig. 3 Comparison of the vesicle-inducing capacity of common platelet agonists. The capacity of different activators to induce platelet vesiculation was compared in 6 independent experiments. Platelets (250×106 platelets/ml) were activated and the differential centrifugation–separated supernatants of the isolated vesicle populations (total EVs and EXOs) were measured by NTA. Concentration (108 vesicles/ml) of the formed total EVs (A) and EXOs (B) is shown as mean with standard deviation. Fold changes were calculated by comparing the agonist-induced activation to their time-matched controls. Statistical significances were determined by t-test (paired two-sample for means, two-way) assuming unequal variances. P-values of less than 0.05 (*), less than 0.01 (**) and less than 0.001 (***) were considered significant.
Platelet-derived EV populations are overlapping in size and cannot be separated by differential centrifugation
Next, possible agonist-dependent differences in the size distribution of the EVs were analyzed by NTA, which showed that 94–99% of EVs were <500 nm and 65–82% were <250 nm. When the main peaks of the size distribution profiles from the differentially induced EVs were compared, the EVs from the agonist-treated platelets, excluding Ca2+ ionophore, tended to be slightly bigger than the unstimulated (A), while for the Ca2+ ionophore–induced EVs, the predominant size was <100 nm. The activation-dependent differences diminished at the size range of 100–250 nm. At the 250–500 nm range, most of the EVs were induced by the TC co-stimulus. Although agonist-dependent size differences were observed, they were not statistically significant. Strikingly, the most vesicles were in the 100–250 nm size range from both the total EV pool, 59–65% (A) and the EXO pool, 64–77% (data not shown). The centrifugation step (20,000×g) to obtain the EXO supernatant, free of MPs, reduced the number of vesicles within the 250–500 nm size range and increased the percentage of vesicles <100 nm, but the most of the EVs were still 100–250 nm. This result was independent of the activator used (Supplementary Fig. 2), and shows that a large population of EVs can be dismissed if the commonly used differential centrifugations of MPs (10–20,000×g) and EXOs (100,000×g of a pre-filtrate) are used to harvest the EVs.
Fig. 4 Size distributions of the total EV populations by NTA and TEM. Vesicle size distributions are shown as percentages of the total EV populations analyzed by NTA (A, 9 independent experiments) and TEM (B, 4 independent experiments). Diameters of vesicles in TEM micrographs were measured manually from 53–81 images/activation and proportioned to a scale bar. At least 400 vesicles were calculated for each condition. Representative images of NTA (insert in A) and the uranyl acetate–stained total EVs induced by Ca2+ ionophore (insert in B, original magnification 4800×). Table comparing the conditions showing statistical significances from A (C). Statistical significances were determined by t-test (paired two-sample for means, two-way) assuming unequal variances. P-values of less than 0.05 (*), less than 0.01 (**) and less than 0.001 (***) were considered significant.
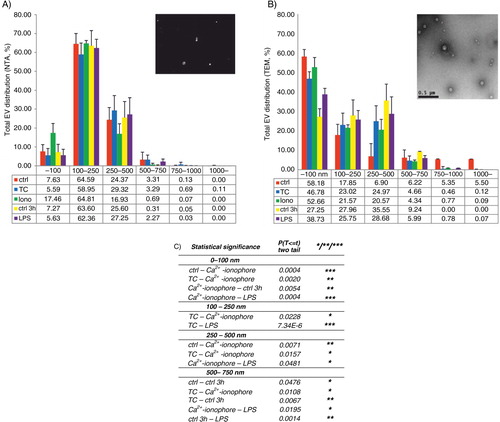
The size distributions of the total EVs induced by TC, Ca2+ ionophore and LPS were also analyzed by TEM. Depending on the agonist, 83–95% of total platelet EVs were <500 nm (B). TEM data supported the NTA results that the EVs from activated platelets tended to be slightly larger than EVs from unactivated platelets or Ca2+ ionophore-induced vesicles, as more than 50% of vesicles <100 nm came from control (30 min) or Ca2+ ionophore (58 and 52%, respectively, B).
Although the removal of MPs from the total EVs reduced the number of vesicles remaining in the EXO-containing supernatant, a parallel reduction in vesicles >100 nm (the theoretical size limit for EXOs) was not seen. In contrast, the size distribution profiles between the total EVs and EXOs were very similar (Supplementary Fig. 2), which suggested that 2 populations either overlap in size, or that they cannot be separated by differential centrifugation. Therefore, we analyzed the presence of CD41, a platelet membrane protein, as well as EXO markers Hsp70, TSG101 and CD9 (Citation33) by Western blotting from the MP and EXO pellets. The presence of CD41 and Hsp70, TSG101 and CD9 was detected in both MPs and EXOs (data for CD41 and Hsp70 comparison is shown in Supplementary Fig. 3). However, the CD41/Hsp70-ratio was different between the 2 vesicle populations as Hsp70 was enriched over CD41 in EXOs compared to MPs independent of the activation, except for Ca2+ ionophore. Hsp70-signal correlated with the equal protein loading in the MP and the EXO samples. In contrast, the CD41 signal was enriched in MPs compared to EXOs, and the CD41 signal intensity from the differentially induced MPs matched the activator potency seen by NTA, shown in .
Protein concentration of an EV population depends on the platelet activation pathway
To confirm the EV-generating potency of the activators measured by NTA, total protein was analyzed from the EV pellets. The protein yields of MPs and EXOs also varied depending on donors, and the variation was even more dramatic than when EV number was measured (A and B). Therefore, fold changes from each respective donor were again calculated by comparing each activation in relation to control. Fold changes of the total protein concentrations of MPs and EXOs induced by TC, Ca2+ ionophore and LPS paralleled the order of potency of the various activators seen by NTA (), but the increase in the Ca2+ ionophore–induced MPs and EXOs was substantially smaller compared to the differences seen by NTA (for the calculated value of MPs, see C). Next, protein/vesicle ratios were calculated to compare the activators for their ability to induce protein-packing into EVs. Despite the smaller number of vesicles formed by TC and LPS, the EVs contained more protein, whereas the MPs and the EXOs induced by Ca2+ ionophore were strikingly protein-poor (D–E). Interestingly, EXOs, but not MPs, of unactivated platelets were also enriched in their protein content compared to the stimulated platelet-derived EXOs (E and Supplementary Fig. 4). Overall, in the 9 analyzed donors, there was either very little (Ca 2 + ionophore MP, R=−0.419, p-value 0.262, Ca 2 + ionophore EXO, R=−0.656, p-value 0.055, LPS MP R=0.678, p-value 0.045) or no correlation between the total protein and the vesicle concentration by NTA. Altogether, protein packaging to EVs differed depending on the inducing agonist, and the Ca2+ ionophore–induced EVs were quantitatively protein-poor in comparison to the platelet EVs formed by either TC or LPS activation, or constitutively in time.
Fig. 5 Protein yields of platelet MPs and EXOs. Platelets (125×106) were activated and MPs and EXOs were pelleted as described in . Protein concentrations were measured with µBCA assay from 9 donors. Total protein yields are shown as means with standard deviation and range (A and B). Since the total protein yields showed a large variation among donors, fold changes normalized to control conditions were calculated as in (C). Statistical significances of the fold changes were determined by t-test (paired two-sample for means, two-way) assuming unequal variances. P-values of less than 0.05 (*), less than 0.01 (**) and less than 0.001 (***) were considered significant.
Protein cargo varies among EV subpopulations and depends on the platelet activating conditions
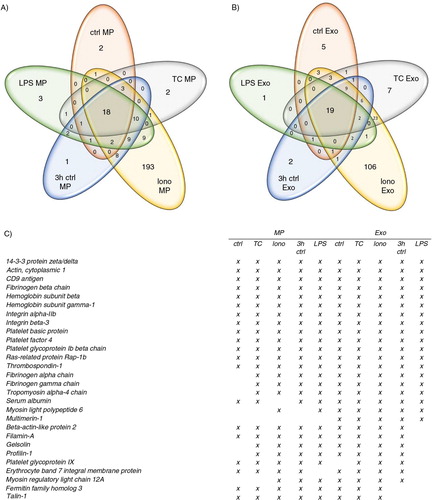
To test a hypothesis that the major differences in platelet EV formation by physiological agonists may be more qualitative and not quantitative, we performed a mass spectrometric analysis of the 10 different vesicle populations. Proteomic analysis showed a total of 267 identified proteins for MPs and 194 proteins for EXOs (Supplementary Table I). From the Ca2+ ionophore–induced EVs, 193 unique proteins were identified for MPs and 106 for EXOs, respectively (), which suggested that these EVs represent more of an unselected molecular compilation of the platelet itself than EVs with a specifically packed content. Venn diagrams of the protein distribution showed that 18 proteins were shared among the different activations within MPs and 19 within the different EXOs, respectively (). From these shared proteins, 13 were common for both MPs and EXOs populations and included common platelet surface proteins such as integrin αIIb and glycoprotein Ib complexes, but also functional proteins such as chemokines (platelet basic protein and platelet factor 4). Multimerin-1 was found exclusively in all the EXO populations. In addition to the agonist-dependent differences, the MP and EXO cargo also changed in the unactivated samples in a time-dependent manner. As a summary, the qualitative protein content of both MPs and EXOs depends on the platelet activating condition inducing the vesicle generation.
Fig. 6 Mass spectrometry analysis of platelet MPs and EXOs. Proteomic comparison of MPs and EXOs from 5 different conditions was performed by LTQ Orbitrap XL mass spectrometry from pooled samples of 6 donors to compare the molecular content of different EV subpopulations. Venn diagrams illustrate the common and the unique proteins in MPs (A) and EXOs (B). Common identified proteins for all conditions are listed in (C).
Discussion
Here, we optimized an isolation protocol to obtain pure platelet EVs and compared the quantity and the protein content of the EV subpopulations induced by different platelet activators. The main finding of this study is that the activation pathway regulates both the quantity and the quality of the subsequently formed EV subpopulations. Regarding the number of EVs, the order of agonist potency in our study (Ca2 + ionophore>thrombin>CRP-XL>TC co-stimulus>collagen>LPS>TRAP-6>ADP) is in line with the previous literature, but the quantitative differences between agonists were much smaller, and LPS, TRAP-6 and ADP showed only a slight effect on vesiculation. In contrast, Ca2+ ionophore–induced increase of EV generation was much higher compared to the physiological activators than previously reported. There are several explanations for these differences. First, we measured the total EV populations by NTA, also <300 nm, the cut-off limit of the first generation flow cytometers now known to dismiss the main EV populations, including EXOs (Citation9,Citation15,Citation16). Second, we measured EV numbers in fresh supernatants not to disclose any EVs by centrifugation, nor did we select for any molecularly or functionally segregated subpopulation, as by flow cytometry or by a thrombin generation test; and finally, the pre-removal of activated platelet remnants was emphasized in our isolation procedure.
Further comparisons of EV formation by the different activators showed that LPS did not increase the number of EVs from control, contrasting previous results (Citation21). Instead, using proteomics, we found a qualitative change in the proteins of the LPS-induced EVs compared to controls. We also confirm that MPs and EXOs are constitutively formed in the absence of an exogenous stimulus with a similar time-course as previously described for the integrin-mediated microvesiculation of unactivated platelets (Citation11). Based on proteomics results, these EVs had distinct protein contents, which changed over time. This opens up interesting roles for EVs for platelet homeostasis and function. Finally, we consider that Ca2+ ionophore as a platelet agonist causes a prolific but an unselective process of membrane vesiculation, or fragmentation, leading to a large pool of protein-poor vesicles reminiscent of necrotic or apoptotic cell fragmentation (Citation24,Citation34). This finding cautions against the use of Ca2+ ionophore as an EV-generating agonist. In all, these results underline the importance of both qualitative and quantitative characterization of the activation-dependent changes in the EV populations.
To our knowledge, this is the first study to compare EXO production by platelet agonists commonly considered to induce microvesiculation. With the exception of Ca2+ ionophore, only TC- and CRP-XL-stimulated platelets generated more EXOs than control, whereas the formation was very similar by the rest of the activators and control (). Since platelets are known to produce more MPs when adherent than in suspension by these agonists (Citation35,Citation36), it would be interesting to study whether adhesion would potentiate EXO production. Similar to the proteomic results of MPs, the proteins of EXOs were variable and the content highly dependent on the generating agonist. We also found that the EXOs of unactivated platelets were more protein-rich (protein quantity/vesicle) when compared to EXOs from stimulated platelets, which may implicate a role also for EXOs in the basal vesicle secretion of platelets. This concept is supported by the discovery of Multimerin-1 in all the EXO samples.
In this study, we could not distinguish MPs and EXOs by differential centrifugation. The 20,000×g MP-pelleting step reduced the number of EVs (measured from the EXO supernatant), and decreased the percentage of EVs from the 250–500 nm size range (~11%) increasing EV number in the 100–250 nm size range (~12%), but the percentage of EVs <100 nm [considered as the main cut-off for EXOs (Citation37)], did not significantly change. We suggest 2 explanations for this: first, MPs and EXOs are more overlapping in size than previously considered, or second, it may be impossible to separate very heterogeneous populations by centrifugation due to the presence of both bigger but lighter vesicles, and smaller but denser vesicles. The latter reason would also explain the presence of the EXO marker Hsp70 in both MPs and EXOs. However, the reduction of CD41 in the EXO pellets indicates that the differential centrifugation is effective for EXO enrichment. The remaining CD41-signal might also originate from α-granules released during platelet activation (Citation5,Citation38). In any case, combined isolations of pellets at 10–20,000×g (MPs) and at 100,000×g (EXOs) from a 0.1 or 0.22 µm pre-filtered supernatant will omit a significant portion of the total EVs, which should be taken into account when assessing the biological effects of all EVs (Citation39). We chose not to ultrapurify the EXOs, since we were interested in analyzing total platelet EVs and a further gradient ultracentrifugation or a filtration step would have lost a large population of platelet EVs. Therefore, we call the 2 fractions thus obtained as “MP- and EXO-enriched populations” and further recommend the use of total liberated EVs in functional studies, after a careful removal of platelets and their remnants.
The size distribution data by NTA and TEM support each other and as a conclusion show that 90% or more of platelet EVs are below 500 nm with the main population within 100–250 nm, in accordance with several recent observations (Citation9,Citation40,Citation41). The differences regarding the main populations in TEM (<100 nm) and NTA (100–250 nm) are likely explained by the artificial shrinkage of EVs when samples are prepared for EM (Citation42), the lack of sensitivity of the LM10 instrumentation in this size range (Citation17) and by the masking effect due to polydisperse samples (Citation43). Also, agonist-dependent clustering of EVs may contribute to the differences seen between the two methods. Such clustering, or alternatively swarm detection (Citation44), may explain why platelet-derived EVs have been detected by the first generation flow cytometers in the past. Alternatively, one reason may also be the remnant platelets.
This is also the first study to detail a procedure for the isolation and characterization of platelet-derived EVs free from contaminating platelet remnants and other blood cells, particularly leukocytes. As platelets were isolated with a combination of washing and density-gradient isolation, platelets free from plasma EVs, liposomes and proteins could be obtained, and ex vivo platelet activation and EV generation avoided (Citation25). Comparison of the methods showed that the iodixanol gradient yielded the most functional platelets without significant contamination of other cells. In many platelet EV studies, the removal of remnant platelets or their effect in the subsequent analyses has not been monitored, which may lead to biased results in both qualitative and quantitative measurements. Lacroix et al. (Citation25) demonstrated that two separate centrifugations (2,500×g for 15 min) were required to obtain platelet-free plasma. Using purified platelet populations, we found that a further centrifugation step was needed to tighten the pellets of unactivated or slightly activated platelets (i.e. LPS) to avoid the transfer of minute platelet amounts. Finally, we do not have any other explanation for the presence of haemoglobin and erythrocyte band 7 integral membrane protein in all our EV samples derived-from purified platelets, except that platelets are known to endocytose proteins, tumour-RNA and even latex particles from circulation (Citation38,Citation45), which would imply the uptake of erythrocyte-derived EVs. Hence, the identified fibrinogen and serum albumin can also be from plasma or date back to the megakaryocyte origin of platelets.
EV quantification is an important consideration for their use in clinical studies and in the comparison of EVs from different sources. Two methods were used in this study. By NTA, a large variability of the total EV concentrations between the donors was observed, but also within the same donor on a different donation time. Although these results, obtained in vitro, may not directly apply to ex vivo EVs in plasma, they do show that the determination of clinical ranges for platelet EVs in circulation will be a challenge since sex, age, physiological conditions such as platelet count, circadian or feeding rhythms and in vitro vesiculation induced by sample preparation all contribute to EV concentration (Citation18,Citation25,Citation46–Citation48). However, the inter-donor variation in the total protein content of EVs was even larger than the variation in the vesicle number. Moreover, the protein/vesicle ratios substantially differed between the activations. For example, the Ca2+ ionophore–induced MPs and EXOs contained significantly less protein than the TC-induced MPs and EXOs. Overall, there was no, or only slight correlation between the EV numbers and the protein amount. These results discourage the use of protein concentration in standardization of EV samples from different sources. However, they do support our conclusion that the platelet signaling not only modulates the number of formed EVs but also what and how much protein is packed into them. The main result of our preliminary mass spectrometry analysis is that while there are some common platelet molecules in all EVs, the overall cargo is differentially packed into both MPs and EXOs and that the activating conditions determine the packaging. Although the concept of EV content change upon various activating conditions is known for vesicles from other cells (Citation31,Citation49–Citation53) very few studies have so far addressed dynamics of protein cargo change in platelets (Citation7,Citation8,Citation54), and a more sophisticated quantitative proteomic study is needed to identify actual biomarker candidates for differential platelet functions.
Taken together, this study shows that the platelets produce highly dynamic and versatile populations of heterogeneous EVs, and offers both a novel method and views of characterization, which reason their future studies.
Conflict of interest and funding
There are no conflicts of interest. This project has been funded by the Magnus Ehrnrooth Foundation, the Medicinska Understödsförening Liv och Hälsa r.f., the Otto Malm Foundation and the Oscar Öflund Foundation.
Supplementary figure 1
Download PDF (1.1 MB)Supplementary figure 2
Download PDF (1 MB)Supplementary figure 3
Download PDF (873.2 KB)Supplementary figure 4
Download PDF (520.5 KB)Supplementary Table 1
Download PDF (803.1 KB)Acknowledgements
The authors thank the Finnish Red Cross Blood Service Cell Surface Analytics Laboratory and Dr. Leena Valmu for the mass spectrometry analysis.
Notes
To access the supplementary material to this article, please see Supplementary files under Article Tools online.
Related Research Data
References
- Elzey BD, Sprague DL, Ratliff TL. The emerging role of platelets in adaptive immunity. Cell Immunol. 2005; 238: 1–9.
- Jenne CN, Urrutia R, Kubes P. Platelets: bridging hemostasis, inflammation, and immunity. Int J Lab Hematol. 2013; 35: 254–61.
- Bertozzi CC, Schmaier AA, Mericko P, Hess PR, Zou Z, Chen M et al. Platelets regulate lymphatic vascular development through CLEC-2-SLP-76 signaling. Blood. 2010; 116: 661–70.
- Aatonen M, Gronholm M, Siljander PR. Platelet-derived microvesicles: multitalented participants in intercellular communication. Semin Thromb Hemost. 2012; 38: 102–13.
- Heijnen HF, Schiel AE, Fijnheer R, Geuze HJ, Sixma JJ. Activated platelets release two types of membrane vesicles: microvesicles by surface shedding and exosomes derived from exocytosis of multivesicular bodies and alpha-granules. Blood. 1999; 94: 3791–9.
- Robertson C, Booth SA, Beniac DR, Coulthart MB, Booth TF, McNicol A. Cellular prion protein is released on exosomes from activated platelets. Blood. 2006; 107: 3907–11.
- Gambim MH, do Carmo Ade O, Marti L, Verissimo-Filho S, Lopes LR, Janiszewski M. Platelet-derived exosomes induce endothelial cell apoptosis through peroxynitrite generation: experimental evidence for a novel mechanism of septic vascular dysfunction. Crit Care. 2007; 11: R107.
- Pook M, Tamming L, Padari K, Tiido T, Maimets T, Patarroyo M et al. Platelets store laminins 411/421 and 511/521 in compartments distinct from alpha- or dense granules and secrete these proteins via microvesicles. J Thromb Haemost. 2014; 12(4): 519–527.
- Arraud N, Linares R, Tan S, Gounou C, Pasquet JM, Mornet S et al. Extracellular vesicles from blood plasma: determination of their morphology, size, phenotype and concentration. J Thromb Haemost. 2014; 12(5): 614–627.
- Flaumenhaft R, Dilks JR, Richardson J, Alden E, Patel-Hett SR, Battinelli E et al. Megakaryocyte-derived microparticles: direct visualization and distinction from platelet-derived microparticles. Blood. 2009; 113: 1112–21.
- Cauwenberghs S, Feijge MA, Harper AG, Sage SO, Curvers J, Heemskerk JW. Shedding of procoagulant microparticles from unstimulated platelets by integrin-mediated destabilization of actin cytoskeleton. FEBS Lett. 2006; 580: 5313–20.
- Holme PA, Orvim U, Hamers MJ, Solum NO, Brosstad FR, Barstad RM et al. Shear-induced platelet activation and platelet microparticle formation at blood flow conditions as in arteries with a severe stenosis. Arterioscler Thromb Vasc Biol. 1997; 17: 646–53.
- Reininger AJ, Heijnen HF, Schumann H, Specht HM, Schramm W, Ruggeri ZM. Mechanism of platelet adhesion to von Willebrand factor and microparticle formation under high shear stress. Blood. 2006; 107: 3537–45.
- Italiano JE Jr, Mairuhu AT, Flaumenhaft R. Clinical relevance of microparticles from platelets and megakaryocytes. Curr Opin Hematol. 2010; 17(6): 578–584.
- Furie B, Furie BC. Cancer-associated thrombosis. Blood Cells Mol Dis. 2006; 36: 177–81.
- van der Pol E, Hoekstra AG, Sturk A, Otto C, van Leeuwen TG, Nieuwland R. Optical and non-optical methods for detection and characterization of microparticles and exosomes. J Thromb Haemost. 2010; 8: 2596–607.
- Dragovic RA, Gardiner C, Brooks AS, Tannetta DS, Ferguson DJ, Hole P et al. Sizing and phenotyping of cellular vesicles using Nanoparticle Tracking Analysis. Nanomedicine. 2011; 7(6): 780–788.
- Yuana Y, Bertina RM, Osanto S. Pre-analytical and analytical issues in the analysis of blood microparticles. Thromb Haemost. 2011; 105: 396–408.
- Siljander P, Carpen O, Lassila R. Platelet-derived microparticles associate with fibrin during thrombosis. Blood. 1996; 87: 4651–63.
- Dale GL. Coated-platelets: an emerging component of the procoagulant response. J Thromb Haemost. 2005; 3: 2185–92.
- Brown GT, McIntyre TM. Lipopolysaccharide signaling without a nucleus: kinase cascades stimulate platelet shedding of proinflammatory IL-1beta-rich microparticles. J Immunol. 2011; 186: 5489–96.
- Soop A, Hallstrom L, Frostell C, Wallen H, Mobarrez F, Pisetsky DS. Effect of lipopolysaccharide administration on the number, phenotype and content of nuclear molecules in blood microparticles of normal human subjects. Scand J Immunol. 2013; 78: 205–13.
- Hess MW, Siljander P. Procoagulant platelet balloons: evidence from cryopreparation and electron microscopy. Histochem Cell Biol. 2001; 115: 439–43.
- Leytin V. Apoptosis in the anucleate platelet. Blood Rev. 2012; 26: 51–63.
- Lacroix R, Judicone C, Poncelet P, Robert S, Arnaud L, Sampol J et al. Impact of pre-analytical parameters on the measurement of circulating microparticles: towards standardization of protocol. J Thromb Haemost. 2012; 10: 437–46.
- Witwer KW, Buzas EI, Bemis LT, Bora A, Lasser C, Lotvall J et al. Standardization of sample collection, isolation and analysis methods in extracellular vesicle research. J Extracell Vesicles. 2013; 2 20360, doi: http://dx.doi.org/10.3402/jev.v2i0.20360.
- Birschmann I, Mietner S, Dittrich M, Pfrang J, Dandekar T, Walter U. Use of functional highly purified human platelets for the identification of new proteins of the IPP signaling pathway. Thromb Res. 2008; 122: 59–68.
- Rozen S, Skaletsky H. Primer3 on the WWW for general users and for biologist programmers. Methods Mol Biol. 2000; 132: 365–86.
- Sims PJ, Wiedmer T, Esmon CT, Weiss HJ, Shattil SJ. Assembly of the platelet prothrombinase complex is linked to vesiculation of the platelet plasma membrane. Studies in Scott syndrome: an isolated defect in platelet procoagulant activity. J Biol Chem. 1989; 264: 17049–57.
- Ray DM, Spinelli SL, Pollock SJ, Murant TI, O'Brien JJ, Blumberg N et al. Peroxisome proliferator-activated receptor gamma and retinoid X receptor transcription factors are released from activated human platelets and shed in microparticles. Thromb Haemost. 2008; 99: 86–95.
- Kilpinen L, Impola U, Sankkila L, Ritamo I, Aatonen M, Kilpinen S et al. Extracellular membrane vesicles from umbilical cord blood-derived MSC protect against ischemic acute kidney injury, a feature that is lost after inflammatory conditioning. J Extracell Vesicles. 2013; 2 21927, doi: http://dx.doi.org/10.3402/jev.v2i0.21927.
- Heemskerk JW, Siljander P, Vuist WM, Breikers G, Reutelingsperger CP, Barnes MJ et al. Function of glycoprotein VI and integrin alpha2beta1 in the procoagulant response of single, collagen-adherent platelets. Thromb Haemost. 1999; 81: 782–92.
- Simpson RJ, Lim JW, Moritz RL, Mathivanan S. Exosomes: proteomic insights and diagnostic potential. Expert Rev Proteomics. 2009; 6: 267–83.
- Jackson SP, Schoenwaelder SM. Procoagulant platelets: are they necrotic?. Blood. 2010; 116: 2011–8.
- Siljander P, Farndale RW, Feijge MA, Comfurius P, Kos S, Bevers EM et al. Platelet adhesion enhances the glycoprotein VI-dependent procoagulant response: involvement of p38 MAP kinase and calpain. Arterioscler Thromb Vasc Biol. 2001; 21: 618–27.
- Zhang Y, Liu X, Liu L, Zaske AM, Zhou Z, Fu Y et al. Contact- and agonist-regulated microvesiculation of human platelets. Thromb Haemost. 2013; 110: 331–39.
- Thery C, Ostrowski M, Segura E. Membrane vesicles as conveyors of immune responses. Nat Rev Immunol. 2009; 9: 581–93.
- Blair P, Flaumenhaft R. Platelet alpha-granules: basic biology and clinical correlates. Blood Rev. 2009; 23: 177–89.
- Dean WL, Lee MJ, Cummins TD, Schultz DJ, Powell DW. Proteomic and functional characterisation of platelet microparticle size classes. Thromb Haemost. 2009; 102: 711–8.
- Yuana Y, Oosterkamp TH, Bahatyrova S, Ashcroft B, Garcia Rodriguez P, Bertina RM et al. Atomic force microscopy: a novel approach to the detection of nanosized blood microparticles. J Thromb Haemost. 2010; 8: 315–23.
- Gabriel DA, Giordano K. Microparticle sizing and counting using light scattering methods. Semin Thromb Hemost. 2010; 36: 824–32.
- Jensen OA, Prause JU, Laursen H. Shrinkage in preparatory steps for SEM. A study on rabbit corneal endothelium. Albrecht Von Graefes Arch Klin Exp Ophthalmol. 1981; 215: 233–42.
- Filipe V, Hawe A, Jiskoot W. Critical evaluation of Nanoparticle Tracking Analysis (NTA) by NanoSight for the measurement of nanoparticles and protein aggregates. Pharm Res. 2010; 27: 796–810.
- van der Pol E, van Gemert MJ, Sturk A, Nieuwland R, van Leeuwen TG. Single vs. swarm detection of microparticles and exosomes by flow cytometry. J Thromb Haemost. 2012; 10: 919–30.
- Zuckerfranklin D. Endocytosis by human-platelets – metabolic and freeze-fracture studies. J Cell Biol. 1981; 91: 706–15.
- Toth B, Nikolajek K, Rank A, Nieuwland R, Lohse P, Pihusch V et al. Gender-specific and menstrual cycle dependent differences in circulating microparticles. Platelets. 2007; 18: 515–21.
- Sossdorf M, Otto GP, Claus RA, Gabriel HH, Losche W. Cell-derived microparticles promote coagulation after moderate exercise. Med Sci Sports Exerc. 2011; 43: 1169–76.
- Madden LA, Vince RV, Sandstrom ME, Taylor L, McNaughton L, Laden G. Microparticle-associated vascular adhesion molecule-1 and tissue factor follow a circadian rhythm in healthy human subjects. Thromb Haemost. 2008; 99: 909–15.
- Jimenez JJ, Jy W, Mauro LM, Soderland C, Horstman LL, Ahn YS. Endothelial cells release phenotypically and quantitatively distinct microparticles in activation and apoptosis. Thromb Res. 2003; 109: 175–80.
- Nolte-‘t Hoen ENM, van der Vlist EJ, de Boer-Brouwer M, Arkesteijn GJA, Stoorvogel W, Wauben MHM. Dynamics of dendritic cell-derived vesicles: high-resolution flow cytometric analysis of extracellular vesicle quantity and quality. J Leukoc Biol. 2013; 93: 395–402.
- Meckes DG Jr, Gunawardena HP, Dekroon RM, Heaton PR, Edwards RH, Ozgur S et al. Modulation of B-cell exosome proteins by gamma herpesvirus infection. Proc Natl Acad Sci U S A. 2013; 110: E2925–33.
- Cypryk W, Ohman T, Eskelinen EL, Matikainen S, Nyman TA. Quantitative proteomics of extracellular vesicles released from human monocyte-derived macrophages upon beta-glucan stimulation. J Proteome Res. 2014; 13(5): 2468–2477.
- Genneback N, Hellman U, Malm L, Larsson G, Ronquist G, Waldenstrom A et al. Growth factor stimulation of cardiomyocytes induces changes in the transcriptional contents of secreted exosomes. J Extracell Vesicles. 2013; 2 20167, doi: http://dx.doi.org/10.3402/jev.v2i0.20167.
- Vasina EM, Cauwenberghs S, Staudt M, Feijge MA, Weber C, Koenen RR et al. Aging- and activation-induced platelet microparticles suppress apoptosis in monocytic cells and differentially signal to proinflammatory mediator release. Am J Blood Res. 2013; 3: 107–23.