
Abstract
Introduction
Optical techniques are routinely used to size and count extracellular vesicles (EV). For comparison of data from different methods and laboratories, suitable calibrators are essential. A suitable calibrator must have a refractive index (RI) as close to that of EV as possible but the RI of EV is currently unknown. To measure EV, RI requires accurate knowledge of size and light scattering. These are difficult to measure as most EVs cannot be resolved by light microscopy and their diameter is smaller than the wavelength of visible light. However, nanoparticle tracking analysis (NTA) provides both size and relative light scattering intensity (rLSI) values. We therefore sought to determine whether it was possible to use NTA to measure the RI of individual EVs.
Methods
NTA was used to measure the rLSI and size of polystyrene and silica microspheres of known size and RI (1.470 and 1.633, respectively) and of EV isolated from a wide range of cells. We developed software, based on Mie scattering code, to calculate particle RI from the rLSI data. This modelled theoretical scattering intensities for polystyrene and silica microspheres of known size (100 and 200 nm) and RI. The model was verified using data from the polystyrene and silica microspheres. Size and rLSI data for each vesicle were processed by the software to generate RI values.
Results
The following modal RI measurements were obtained: fresh urinary EV 1.374, lyophilised urinary EV 1.367, neuroblastoma EV 1.393, blood EV 1.398, EV from activated platelets 1.390, small placental EV 1.364–1.375 and 1.398–1.414 for large placental EV (>200 nm). Large placental EV had a significantly higher RI than small placental EV (p<0.0001). The spread of RI values was narrower for small EV than for the more heterogeneous large EV.
Discussion
Using NTA and Mie scattering theory, we have demonstrated that it is possible to estimate the RI of sub-micron EV using NTA data. EV typically had a modal RI of 1.37–1.39, whereas values of >1.40 were observed for some large (>200 nm) microvesicles.
Conclusion
This method for measuring EV RI will be useful for developing appropriate calibrators for EV measurement.
To access the supplementary material to this article, please see Supplementary files under Article Tools online.
Optical techniques are widely used to size and count extracellular vesicles (EV). Both dynamic light scattering (DLS) and flow cytometry (FCM) use light scattering intensity (LSI) to estimate EV size with the assumption that the refractive index (RI) of the EV is similar to that of the calibration material (Citation1). Although size measurements made by nanoparticle tracking analysis (NTA) are independent of LSI, the lower limit of detection and concentration measurements are not (Citation2). Furthermore, the lower limit of size resolution by FCM also depends on RI (Citation3).
The need to standardise single vesicle detection methods was highlighted at the ISEV Workshop on EV Isolation and Characterization in Budapest during October 2013. The lack of suitable standards was identified as a fundamental obstacle, results from our limited knowledge of individual EV properties. In order to compare data from different methods and laboratories, it is essential to have suitable calibrators. Optical methods depend on LSI and hence the RI. Consequently, a suitable calibrator must have an RI as close to that of the EV as possible.
Polystyrene calibration beads are commonly used to calibrate optical methods of EV detection and to set the “microparticle gate” on flow cytometers (Citation4, Citation5). Many users use the light scattering characteristics of EV relative to that of calibration beads to make assumptions about vesicle size. It has been suggested that silica nanospheres (RI 1.46) are a more appropriate reference material than polystyrene nanospheres (RI 1.59) (Citation3). However, the RI of EV is unknown. Furthermore, it is by no means certain that EV from different cell types, or produced by different mechanisms, have the same RI as different cellular components (e.g. the nucleus), which differ in RI as demonstrated by phase contrast microscopy (Citation6).
It is a challenge to determine the RI of EV as most EV are below the resolution limit of light microscopy with diameters that are smaller than the wavelength of visible light (400–700 nm). Accurate measurements of size and light scattering are needed to determine RI. Until now, this has not been possible for EV of <500 nm. Most EV are too large for the Rayleigh approximation to be applicable; so more complex schemes such as Mie scattering must be used instead. Both the Rayleigh and Mie solutions are based on Maxwell's equations, but the Mie solution makes fewer assumptions and thereby can be applied to particles of any diameter for a review of light scattering measurements refer to van del Pol et al. (Citation1). However, calculating the Mie solution is far more complex.
NTA uses light scattering to enable direct, real-time visualisation and analysis of nanoparticles and uses the rate of Brownian motion to estimate individual particle size independently of RI. NTA is a useful technique for making rapid size and concentration measurements of EV preparations (Citation2) because requirements of sample preparation are simple. In addition to these attributes, the software also provides relative light scattering intensity (rLSI) values for each individual particle. The sum of measured pixel intensities around a particle is transformed to obtain the rLSI which allows scattering intensity to be compared across several camera settings.
The purposes of this study were to determine whether it was possible to use light scattering data from NTA and Mie scattering theory to assess the RI of individual small EV; to determine whether RI values of EV varied depending on the parent cell and size; and to provide information on the RI of EV to aid the development of future standards and calibrators for EV measurement.
To this end, we have developed software which is based on existing Mie code to derive RI measurements for EV from rLSI measurements generated by NTA and report on its application to EV from diverse sources. Neuroblastoma cell lines are known to release large numbers of exosome-like EV, so culture supernatant from a mouse neuroblastoma was selected as a source of small monodisperse EV. Urinary EV are commonly studied, so we tested fresh and lyophilised urinary EV. We hypothesised that the 2 preparations would have similar properties, thus making lyophilised EV a potential candidate calibrator. Blood EV are also commonly studied. Most are derived from platelets, so we studied EV isolated from plasma and from stimulated purified platelets, as these would be expected to have very similar properties. Finally, we studied several preparations of placental syncytiotrophoblast extracellular vesicles (STEV) prepared by perfusion of healthy and pathological placentae, as these EV are heterogeneous in both size (50–600 nm) and composition (Citation7) and were therefore considered an ideal population to study EV heterogeneity.
Materials and methods
Materials and reagents
NIST-traceable polystyrene nanosphere size standards (Thermo Fisher Scientific Inc. Waltham, Massachusetts), silicon dioxide nanosphere size standards (Polysciences, Warrington, PA), lyophilised urinary EV (Hansa Biomed, Tallinn, Estonia), Dulbecco's sterile-filtered phosphate-buffered saline (PBS), prostaglandin E2 and thrombin-receptor-activating peptide (Sigma, St. Louis, MO) and cross-linked collagen-related peptide (provided by Richard Farndale, University of Cambridge).
Samples
The Central Oxford Research Ethics Committee C approved this study, and informed written consent was obtained from all recruited individuals.
Neuroblastoma EV were obtained from a mouse neuroblastoma cell line (N2a provided by ATCC, UK) cultured at 37°C with 5% CO2 in complete media comprising Dulbecco's Modified Eagle Medium (DMEM, Invitrogen), supplemented with 10% foetal bovine serum (FBS, Cellgro) and penicillin/streptomycin (5,000 µg/ml, Cellgro). For EV isolation, media were changed 24 hours after seeding to serum-free OptiMEM supplemented with penicillin/streptomycin. Conditioned media, containing the EV, was then collected 48 hours after incubation. This was centrifuged at 10,000 g for 10 minutes to remove dead cells, large vesicles and apoptotic bodies. Platelet poor plasma (PPP) was prepared from citrated blood by double centrifugation at 2,500 g for 15 minutes. EV were then isolated by centrifuging PPP diluted 1 in 5 in PBS at 30,000 g for 60 minutes. Platelet EV were generated from platelets isolated from blood collected into acidified dextrose citrate containing 65 nM prostaglandin E2. Platelet-rich plasma was prepared by double centrifugation at 200 g, and the platelets pelleted by centrifugation at 400 g for 20 minutes. Platelets were re-suspended in warm (37°C) Tyrode's buffer and activated by 2 µg/ml cross-linked collagen-related peptide and 20 µmol/l thrombin-receptor-activating peptide at 37°C for 10 minutes, followed by centrifugation at 2,500 g for 15 minutes to remove platelets. EV were isolated by centrifuging plasma diluted 1 in 5 in PBS at 30,000 g for 60 minutes.
Placental syncytiotrophoblast microvesicles (STEV) were prepared as previously described (Citation7). Briefly, STEV were isolated from 6-term human placentae using a dual perfusion system. The perfusates were centrifuged at 10,000 g for 15 minutes, and the pellet was resuspended to prepare “large” STEV. The supernatant was filtered at 200 nm and ultracentrifuged at 150,000 g to prepare “small” STEV.
Urinary EVs were prepared by centrifuging fresh urine at 10,000 g to remove cellular debris and then ultracentrifuging it at 125,000 g for 1 hour. The lyophilised urinary EV were reconstituted according to the manufacturer's instructions.
Analysis
All analyses were performed on a Nanosight NS500 NTA instrument (Malvern Instruments, Amesbury, UK) equipped with a 405 nm violet laser and a CMOS camera (Hamamatsu Photonics, Japan), and all videos were processed using NTA 2.3 build 17 software (Nanosight Ltd.). In order to prevent pixel saturation, the least sensitive standard camera setting which enabled visualisation of all tightly focussed particles was used for each analysis. This varied from level 3 for 200 nm polystyrene nanospheres to level 8 for urinary EV. This provided a normal distribution of rLSI, whereas higher camera levels tended to produce a bimodal distribution. Ten consecutive 30-second recordings were made for each sample, using the NS500 script capability. As the rLSI values were highly skewed, the mode and geometric mean of per-frame rLSI for each particle was used for analysis, and particles were excluded if their size was greater than 1,000 nm or if their track length was <10 frames to ensure sizing accuracy. Reference nanospheres (100 and 200 nm silica and polystyrene) were analysed on the same day to compensate for day-to-day variation in instrument performance. This allowed for the calculation of a daily calibration factor based on a linear conversion factor between the 2 arbitrary unit scales, by least-squares fitting of theoretical and observed rLSI of calibration nanospheres. Both polystyrene and silica nanospheres were run shortly before and after sample measurements and the rLSI values used to verify subsequent RI calculations.
Software
We developed 2 software programs to process the rLSI data: Tabulator and RICalculator. Tabulator reads and aggregates the multiple data files produced by NTA 2.3 (thus reducing the amount of labour-intensive data handling) and feeds the data into RICalculator which calculates theoretical rLSI values for particles of given sizes and refractive indices using the Scattnlay Mie scattering code (Citation8). The rLSI data from the Tabulator were fed into RICalculator.
RICalculator uses a Monte Carlo model – computations that depend on repeated random sampling to obtain numerical results; calculations are iterated many times to obtain the distribution of theoretical LSI values for particles observed with the NS500; LSI values for random rays within the cone of light visible to the NS500 are calculated using a Mie code and averaged, accounting for the non-zero aperture of the microscope system. An optimisation algorithm was then used to estimate the RI of observed particles using the Monte Carlo model. A golden section search method (Citation9) was used for optimisation, and it operates by placing upper and lower bounds on the RI required to give the LSI observed for each set of observation. These bounds become closer through successive trials until the bounded space is smaller than a desired convergence value, and the average of the 2 bounds is reported. The RI of the media (1.34) and approximate RI of diamond (2.4) were chosen for initial bounds. The Monte Carlo model was validated by modelling the LSI of polystyrene particles for 0.1 degree pinhole apertures and for apertures that captured all scattered light. As expected, the pinhole aperture model closely matched the LSI calculated by Scattnlay and other Mie codes, while the total scattered light matched the scattering efficiency values calculated by Scattnlay. The optimisation algorithm and other parts of the software were evaluated through review of the code, and the completed software was validated by comparison of modelled and observed rLSI for polystyrene and silica reference beads with nominal sizes of 100 and 200 nm.
Statistics
Statistical analysis was performed using GraphPad Prism version 6 (GraphPad Software, La Jolla, CA) and MATLAB (Mathworks Inc., Natick, MA). Due to the complex skewed nature of the data, non-parametric statistics were used throughout.
Results
RICalculator generated characteristic Mie scattering curves which are a product of increasing light absorbance and a shift from uniform 360° scattering to forward scattering with increasing particle diameter (Citation10). The rLSI of 100 and 200 nm silica and polystyrene nanospheres was measured with each set of analyses to minimise day-to-day variation and to ensure that the observed rLSI measurements agreed with the values predicted by RICalculator, thus verifying the model. Representative data from 1 day are shown in . rLSI values were used to calculate the RI for each vesicle, and these values were plotted against vesicle diameter (). The RI of vesicles of between 100 and 200 nm in diameter was tightly clustered between 1.37 and 1.40 but higher values were observed below 100 nm. Some “smearing” along the lines of constant intensity, particularly for EV of <100 nm, suggests imprecision in sizing and an overestimation of RI. Higher RI values were observed in some larger vesicles, particularly STEVA distribution plot of RI values for vesicles from blood, platelets, urine, lyophilised urinary EV and the small STEV fractions confirmed the relatively narrow spread of RI values for vesicles between 100 and 200 nm, whereas the large STEV (>200 nm) demonstrated a greater degree of heterogeneity (). Modal RI for all vesicles were similar with values ranging from 1.364 to 1.414, but the geometric mean RI were more variable with values ranging from 1.380 to 1.590, reflecting the heterogeneity of the larger vesicles (Table ). Both freshly isolated and lyophilised urinary EV and platelet-derived EV and plasma EV demonstrated very similar RI. Large STEV had significantly higher RI values than small STEV ().
Fig. 1. Projected relative light scattering intensities for silica (blue) and polystyrene (red) nanospheres modelled by RICalculator, based on Mie scattering theory. Overlaid points represent mean size and rLSI for polystyrene and silica nanosphere reference samples. N=4, representative data. AU=arbitrary units.
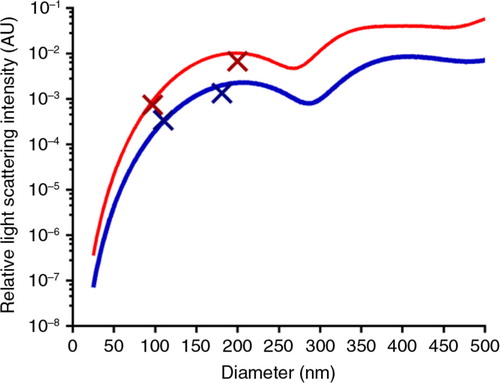
Fig. 2. Vesicle RI versus diameter. Representative data from one of each type of EV studied are shown. Colour of points indicates the density of the distribution. Red denotes dense, and blue sparse, with a rainbow scale between. Lines superimposed on the graphs indicate the projected RI of a particle with an intensity fixed for each line across the range of sizes (0–500 nm).
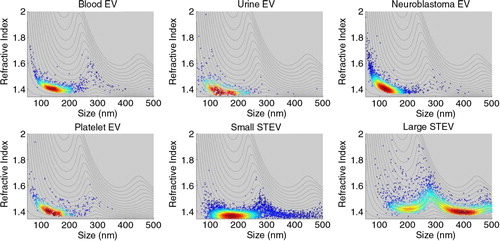
Fig. 3. Distribution plots for vesicle refractive index (A) from blood (n=1), urine (n=1), activated platelets (n=1), neuroblastoma (n=1) and lyophilised urinary vesicles (n=1); (B) small STEV (n=6) and large STEV (n=6). The plots have been adjusted for the number of vesicles counted (normalised density) for illustration purposes.
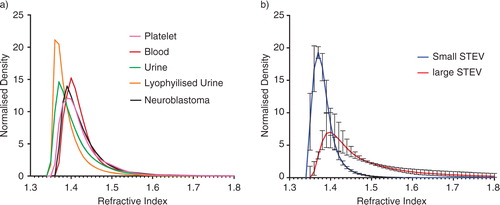
Fig. 4. Refractive indices of small and large STEV.
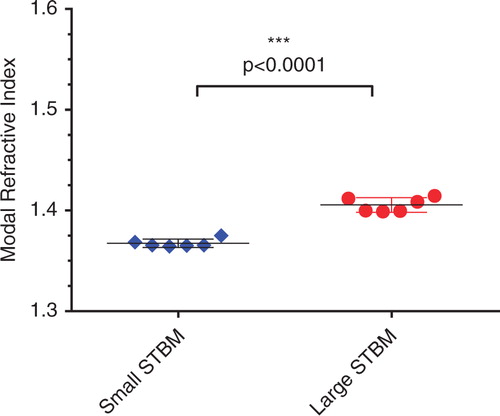
Table I. Refractive index values calculated on the basis of relative light scattering intensities and particle size for different types of extracellular vesicles
Discussion
We report a method for the determination of RI for a wide range of EV types and sizes using Mie scattering theory to analyse light scattering data obtained by NTA. This was achieved by the measurement of LSI for individual vesicles, which hitherto was not possible for EV of <500 nm. The modal RI value for the EV populations studied were similar, and small vesicles of 100–200 nm showed remarkable homogeneity across all EV types. However, larger (>200 nm) EV were more heterogeneous in RI. This perhaps is not surprising, as small EV (exosome-like EV) have very low protein content (Citation11) and lack the protein structures responsible for increased scattering in larger EV. In contrast, larger microvesicles created as a result of cell activation or apoptosis may contain cytoskeletal elements, chromatin and organelles. This is supported by our observation that larger STEV, of which some may be the result of apoptosis, are more refractile (Citation12). Significant differences were observed between RI measurements of small and large STEV. Freshly isolated urinary EV and reconstituted lyophilised urinary EV demonstrated very similar RI distributions, suggesting that lyophilised EV preparations could be useful for calibrating light scattering methods for EV sizing and concentration measurements. A previous report of RI measurement of blood-derived EV, performed by scanning FCM, reported a modal RI value of 1.39 for large blood EV of >500 nm (Citation13), which agrees very closely with our RI data obtained for blood EV. The RI value obtained for urinary EV (1.37) also agrees closely with that obtained in a contemporaneous study which used a similar approach (Citation14).
This study has several limitations. With the exception of the neuroblastoma EV, all of the EV were isolated by centrifugation and consequently we cannot exclude the presence of protein aggregates in our samples. It is known that foetal-calf-serum-containing media and blood plasma contain protein aggregates that may outnumber EV in 100.000 g pellets. However, we have taken reasonable efforts to demonstrate that the particles present in our samples are largely vesicular in nature (detailed in the Supplementary file) (Citation15, Citation16). NTA was not principally designed for quantitative light measurement but we believe that we have optimised the settings to obtain the best quality rLSI data the system can produce. Size measurements made by NTA are known to suffer from broadening, that is, imprecision around the mean, which is exacerbated under measuring conditions optimised for rLSI measurement rather than size accuracy. This is attributable to the uncertainty in the measured diffusion coefficient, resulting from a limited track length, and the uncertainty in the particle position. In our RI measurements, some “smearing” along lines of constant intensity suggests imprecision in sizing. The particle model assumes that EV are homogenous spheres with a single RI; this is a simplification, but a useful one given uncertainty over the true composition of EV. Our software could potentially be modified for more complex EV models, but determining EV structure and composition was beyond the scope of this study. Under such models, multiple solutions may exist for observed size and LSI. For these reasons, it was decided that reporting the “apparent” RI would be a more useful approach than a more physically accurate model.
The apparent high RI of the smallest EV () is probably an artefact produced by imprecision in sizing and the detection limit of the NTA which strongly depends on RI, and it is likely to lead to a bias in measured RI by detecting only the brightest EV, that is, those which are in sharpest focus and those with the highest RI. The relative lipid content of EV increases with decreasing EV size and this too could contribute to the increased RI observed for the smallest vesicles. However, as the RI of phospholipid bilayers have been reported to be around 1.49 (Citation17), higher measured RI values are likely to be artefacts.
Our data have important implications for the characterisation of EV using light scattering methods. LSI is used by DLS and FCM to estimate particle size, so in both methods, an assumption regarding particle RI is necessary. Our data suggest that silica (RI 1.46) is indeed a more appropriate material than polystyrene for calibration and standardisation of EV size and concentration measurements. However, the ideal calibrator would have an RI of approximately 1.37–1.42. Lyophilised EV would appear to be suitable, provided the size and concentration can be accurately determined by non-optical methods, for example, cryo-EM or tunable resistive pulse sensing (Citation1). In addition to providing information useful for the development of calibrators, we believe that vesicle RI may represent a useful additional parameter for the characterisation of EV.
Conflict of interest and funding
This work was supported by a MRC Programme Grant (ref MR/J003360/1) and Wellcome Trust Technology Development Grant (ref GR087730). CG, MS, DT, CWG and ILS have no conflicts of interest to declare. PH and JS are employees of Malvern Instruments.
Supplementary data
Download PDF (1.4 MB)Acknowledgement
The authors thank Dr Rebecca Dragovic for helping with the placental perfusions.
Notes
To access the supplementary material to this article, please see Supplementary files under Article Tools online.
Related Research Data
References
- Van Der Pol E, Hoekstra AG, Sturk A, Otto C, Van Leeuwen TG, Nieuwland R. Optical and non-optical methods for detection and characterization of microparticles and exosomes. J Thromb Haemost. 2010; 8: 2596–607.
- Gardiner C, Ferreira YJ, Dragovic RA, Redman CWG, Sargent IL. Extracellular vesicle sizing and enumeration by nanoparticle tracking analysis. J Extracell Vesicles. 2013; 2 19671, doi: http://dx.doi.org/10.3402/jev.v2i0.19671.
- Chandler WL, Yeung W, Tait JF. A new microparticle size calibration standard for use in measuring smaller microparticles using a new flow cytometer. J Thromb Haemost. 2011; 9: 1216–24.
- Lacroix R, Robert S, Poncelet P, Kasthuri RS, Key NS, Dignat-George F. Standardization of platelet-derived microparticle enumeration by flow cytometry with calibrated beads: results of the International Society on Thrombosis and Haemostasis SSC Collaborative workshop. J Thromb Haemost. 2010; 8: 2571–4.
- Robert S, Poncelet P, Lacroix R, Arnaud L, Giraudo L, Hauchard A et al. Standardization of platelet-derived microparticle counting using calibrated beads and a Cytomics FC500 routine flow cytometer: a first step towards multicenter studies?. J Thromb Haemost. 2009; 7: 190–7.
- Beuthan J, Minet O, Helfmann J, Herrig M, Muller G. The spatial variation of the refractive index in biological cells. Phys Med Biol. 1996; 41: 369–82.
- Tannetta DS, Dragovic RA, Gardiner C, Redman CW, Sargent IL. Characterisation of syncytiotrophoblast vesicles in normal pregnancy and pre-eclampsia: expression of Flt-1 and endoglin. PLoS One. 2013; 8: e56754.
- Pena O, Pal U. Scattering of electromagnetic radiation by a multilayered sphere. Comput Phys Comm. 2009; 180: 2348–54.
- Kiefer J. Sequential minimax search for a maximum. Proc Am Math Soc. 1953; 4: 6.
- Bohren CF, Huffman DR, Bohren CF, Huffman DR. Absorption and scattering by a sphere. Absorption and scattering of light by small particles. 2007; 83–129. Weinheim: Wiley-VCH Verlag GmbH.
- Webber J, Clayton A. How pure are your vesicles?. J Extracell Vesicles. 2013; 2 19861, doi: http://dx.doi.org/10.3402/jev.v2i0.19861.
- Redman CW, Tannetta DS, Dragovic RA, Gardiner C, Southcombe JH, Collett GP et al. Review: does size matter? Placental debris and the pathophysiology of pre-eclampsia. Placenta. 2012; 33(Suppl): S48–54.
- Konokhova AI, Yurkin MA, Moskalensky AE, Chernyshev AV, Tsvetovskaya GA, Chikova ED et al. Light-scattering flow cytometry for identification and characterization of blood microparticles. J Biomed Opt. 2012; 17: 057006.
- van der Pol E, Coumans FA, Sturk A, Nieuwland R, Van Leeuwen TG. Refractive index determination of nanoparticles in suspension using nanoparticle tracking analysis. Nano letters. 2014; 14: 6195–201.
- Aleman MM, Gardiner C, Harrison P, Wolberg AS. Differential contributions of monocyte- and platelet-derived microparticles towards thrombin generation and fibrin formation and stability. J Thromb Haemost. 2011; 9: 2251–61.
- Gardiner C, Dragovic RA, Brooks AS, Tannetta DS, Ferguson DJ, Hole P et al. Sizing and phenotyping of cellular vesicles using nanoparticle tracking analysis. Nanomedicine. 2011; 7: 780–8.
- Huang C, Thompson TE. Properties of lipid bilayer membranes separating two aqueous phases: determination of membrane thickness. J Mol Biol. 1965; 13: 183–93.