
Abstract
Exosomes are small, 40–130 nm secreted extracellular vesicles that recently have become the subject of intense focus as agents of intercellular communication, disease biomarkers and potential vehicles for drug delivery. It is currently unknown whether a cell produces different populations of exosomes with distinct cargo and separable functions. To address this question, high-resolution methods are needed. Using a commercial flow cytometer and directly labelled fluorescent antibodies, we show the feasibility of using fluorescence-activated vesicle sorting (FAVS) to analyse and sort individual exosomes isolated by sequential ultracentrifugation from the conditioned medium of DiFi cells, a human colorectal cancer cell line. EGFR and the exosomal marker, CD9, were detected on individual DiFi exosomes by FAVS; moreover, both markers were identified by high-resolution stochastic optical reconstruction microscopy on individual, approximately 100 nm vesicles from flow-sorted EGFR/CD9 double-positive exosomes. We present evidence that the activation state of EGFR can be assessed in DiFi-derived exosomes using a monoclonal antibody (mAb) that recognizes “conformationally active” EGFR (mAb 806). Using human antigen-specific antibodies, FAVS was able to detect human EGFR and CD9 on exosomes isolated from the plasma of athymic nude mice bearing DiFi tumour xenografts. Multicolour FAVS was used to simultaneously identify CD9, EGFR and an EGFR ligand, amphiregulin (AREG), on human plasma-derived exosomes from 3 normal individuals. These studies demonstrate the feasibility of FAVS to both analyse and sort individual exosomes based on specific cell-surface markers. We propose that FAVS may be a useful tool to monitor EGFR and AREG in circulating exosomes from individuals with colorectal cancer and possibly other solid tumours.
To access the supplementary material to this article, please see Supplementary files under ‘Article Tools’.
Extracellular vesicles (EVs) are cell-derived, lipid-bilayer membrane vesicles with embedded transmembrane proteins (Citation1–Citation3). EVs are reported to contain protein, lipids, RNA and possibly DNA (Citation4, Citation5). EVs are generally distinguished based on route of cellular egress, size and purification strategy. Microvesicles typically range in size from 150 to 1,000 nm in diameter as measured by electron microscopy (EM), and they bud directly from the plasma membrane in a process largely independent of the endosomal compartment (Citation6). In contrast, exosomes are typically 40–130 nm in diameter as determined by EM and are thought to arise from intraluminal budding of the endosomal compartment into multivesicular bodies (MVBs). Upon fusion of MVBs with the plasma membrane, these intraluminal vesicles are released as exosomes. However, vesicles of exosomal size can also be produced by direct budding from the plasma membrane (Citation7, Citation8). Both microvesicles and exosomes maintain plasma membrane topology, displaying the extracellular domains of integral membrane proteins on the outside of the vesicles (Citation9, Citation10).
The constituents of EVs are dependent on the nature of the cells that release them and the specific conditions and environment in which those cells reside (Citation11), making characterization of EVs challenging. Detailed analysis of EVs has been hampered by the heterogeneous nature of secreted vesicles and the paucity of specific markers that distinguish EVs. Analysis is further complicated because exosomes fall below the diffraction limit of light. A number of methods are currently used to study exosomes, including immunoblotting, ELISA and bead capture-based flow cytometry (Citation9, Citation12) (Citation13), along with newer technologies such as nano-plasmonic sensor detection (Citation14). Although each of these techniques can provide qualitative and semi-quantitative data, they largely provide bulk measurements and are unable to precisely sort distinct subsets of vesicles for further characterization. High-resolution imaging modalities such as cryo-EM and atomic force microscopy provide exceptional resolution of exosomes (Citation15–Citation19); however, these modalities have slow throughputs and are capable of analysing only a few parameters simultaneously. Moreover, these specialized imaging techniques do not allow for sorting and purification of exosomes for subsequent analysis.
Using an optimally configured FACSAria IIIu flow cytometer (BD Biosciences, San Jose, CA, USA), we present fluorescence-activated vesicle sorting (FAVS) as a method to analyse and sort exosomes based solely on the presence of endogenous membrane constituents, including EGFR and the exosomal marker, CD9. Applying stochastic optical reconstruction microscopy (STORM) to FAVS-sorted exosomes isolated from a human colorectal cancer (CRC) cell line, DiFi, we identified individual exosome-sized vesicles expressing both EGFR and CD9. We show the ability of FAVS to detect the following: (a) human EGFR in exosomes purified from the plasma of mice bearing DiFi tumour xenografts; (b) activated EGFR in DiFi exosomes using a monoclonal antibody (mAb) that recognizes “conformationally active” EGFR (mAb 806); and (c) EGFR and one of its ligands, AREG, in exosomes isolated from human plasma.
Materials and methods
Cell culture reagents
All cell culture medium was purchased from Cellgro/Mediatech (Manassas, VA, USA) and all cell culture supplements were from Hyclone (Logan, UT, USA) unless stated otherwise. All fluorescent secondary antibodies used for FAVS were purchased from Invitrogen–Molecular Probes (Carlsbad, CA, USA). The AREG ectodomain specific antibody 6R1C2.4 and CTX were obtained from Bristol-Myers Squibb (Seattle, WA, USA). The mouse anti-human CD9 (clone 209306) and CD81 (clone 454720) antibodies were purchased from R&D Systems (Minneapolis, MN, USA). Mouse anti-human, BV421-conjugated CD41b (clone HIP2) was purchased from BD Biosciences (San Jose, CA, USA). Human intravenous immune globulin (IVIG) was purchased from CLS Behring (Kankakee, IL, USA). The anti-human mouse monoclonal antibody, mAb 806, which recognizes EGFR in its active conformation, was provided by the Ludwig Institute of Cancer Research (Melbourne, VIC, Australia; (Citation24),Citation25,Citation47–(Citation51)).
Exosome isolation from cell culture-derived conditioned medium
Cells were cultured in DMEM containing 10% FBS, 2 mM L-glutamine, 50 units/ml penicillin and 50 units/ml streptomycin, until 80% confluent. Cells were washed 3 times with PBS and then cultured for 48 h in serum-free DMEM. The conditioned medium was collected and centrifuged for 10 min at 300× g to remove cellular debris. The supernatant was next centrifuged at 3,000× g for 15 min before being filtered through a 0.22 µm polyether-sulfone filter (Nalgene, Rochester, NY, USA) to remove larger vesicles. The filtrate was concentrated approximately 300-fold with a 100,000 molecular-weight cut-off Centricon Plus-70 concentrator (Millipore, Darmstadt, Germany). The concentrated filtrate was centrifuged at 165,000× g in a SureSpin-630 swinging-bucket rotor (Thermo Fisher, Waltham, MA, USA, 30,000 rpm, effective k factor of 219 with 36 ml ultracentrifugation tubes filled to capacity) for 6 h to pellet exosomes. The exosome-enriched pellet was resuspended in 1 ml of PBS containing 25 mM HEPES pH 7.35 (PBS-H) by successive syringing through 22-, 27- and 30-gauge needles, 7 times each. The pellet was washed by centrifuging at 165,000× g for 6 h. The wash steps were repeated until no trace of phenol red was detectable. The final pellet was resuspended in 750 µl of PBS-H, and the protein concentration was determined with a MicroBCA kit (Pierce, Waltham, MA, USA).
Exosome isolation from mouse and human whole blood
Athymic nude mice were injected subcutaneously into the flank with 5×10⁶ DiFi cells. When tumours reached 800 mm3 in volume, the mice were sacrificed, the blood collected and exosomes purified from plasma. At the time of sacrifice, there was no overt evidence of metastasis. The mouse blood was removed after pooling into the thoracic cavity after cardiac puncture utilizing a 1-ml-wide mouth pipette tip preloaded with 100 µl buffered sodium citrate 3.8% w/v (RICCA, Arlington, TX, USA). All procedures were approved and performed in accordance with the Vanderbilt University Medical Center Animal Care and Use Program. Blood was loaded into a 1.5 ml ultramicrofuge tube on ice containing buffered citrate (1:9 citrate to blood) and centrifuged at 1,500× g for 15 min. The cleared plasma was transferred to a fresh 1.5 ml ultramicrofuge tube and centrifuged again at 3,000× g for 15 min. The resulting supernatant, termed platelet-poor plasma, was diluted ~1:20 in ice-cold PBS and spun at 20,000× g for 30 min to remove larger vesicles and microparticles. The resulting supernatants were collected and centrifuged for 18 h at 165,000× g in a swinging-bucket SureSpin-630 rotor. Exosome-enriched pellets were resuspended by successive passage through 22-, 27- and 30-gauge needles, as described above, and pelleted by centrifugation at 165,000× g for 18 h. The final pellet was resuspended in 1 ml ice-cold PBS containing 50 mM HEPES (pH 7.35) and passed through successively narrower gauge needles, as described above. The protein concentrations of each preparation were determined with a MicroBCA kit (Pierce) using BSA as a standard, and the sample was stored at 4°C. After Meharry Medical College Institutional Review Board committee approval and informed consent from all subjects, blood was collected from 3 normal human donors. The plasma was processed and the exosomes isolated, as described above for the mouse plasma.
FAVS staining and analysis
One hundred micrograms of DiFi exosomes were blocked with 100 µg/ml of human IVIG for 4 h under constant rotation at RT and washed 3 times with PBS-H. All washes, unless stated otherwise, were performed in triplicate with a S100-AT4 fixed angle rotor at 228,000× g (65,000 rpm, effective k factor of 38 with 1.5 ml ultramicrofuge tubes filled to capacity) for 30 min. Samples were suspended and processed as above. DiFi exosomes, processed as above, were then stained simultaneously with CD9 (0.14 µg/ml) directly conjugated to Alexa-488 and CTX (0.25 µg/ml) for 4 h under constant rotation at RT and washed 3 times with PBS-H. All subsequent staining reactions, unless noted otherwise, were performed for 4 h under constant rotation at 4°C in PBS-H with 100 µg/ml of IVIG. For Supplementary Figs. 7 and 8, 100 micrograms of DiFi exosomes were blocked with 100 µg/ml of human IVIG for 2 h under constant rotation at 4°C, washed 3 times with PBS-H and then stained with CD-9 (0.07 µg/ml) with 100 µg/ml of human IVIG for 2 h under constant rotation at 4°C. Samples were then washed 3 times with PBS-H and stained with goat anti-mouse IgG (H+L) specific antibody conjugated to R-PE (0.1 µg/ml). Samples were then washed 3 times, stained with CTX (0.25 µg/ml) directly conjugated to Alexa-647 for 2 h under constant rotation at 4°C, washed 3 times with PBS-H and then analysed by FAVS. Sorting of DiFi exosomes was scaled up to 10 milligrams of exosomes using a simple linear scale-up of the staining reaction outlined above when using only directly conjugated antibodies. For subsequent STORM analysis of FAVS-sorted exosomes, Alexa-488 was used for secondary antibody staining of CD9-labelled exosomes with CTX directly conjugated to Alexa-647.
Mouse plasma-derived exosomes (100 µg) were incubated with anti-human CD9 (0.05 µg/ml), washed 3 times as above and stained with a goat anti-mouse IgG (H+L) conjugated to R-PE (0.1 µg/ml). The mouse plasma exosomes were then washed 3 times and incubated with anti-human EGFR antibody CTX (0.2 µg/µl) directly conjugated to Alexa-647 (0.2 µg/ml). Exosomes were washed 3 times and then analysed by FAVS.
Staining to determine the activation status of A431 and DiFi exosomes began with 100 µg of exosomes for each staining reaction. Exosomes were stained first with mAb 806 (0.2 µg/ml) directly conjugated to Alexa-647 under constant rotation for 4 h at RT and then washed 3 times. Exosomes were then stained with CTX (0.4 µg/ml) directly conjugated to Alexa-488 under constant rotation for 4 h at RT and then washed 3 times and analysed by FAVS. Human plasma-derived exosomes were blocked with 100 µg/ml of human IVIG and stained with anti-human AREG antibody 6R1C2.4 (0.1 µg/ml). Stained exosomes were then washed 3 times, followed by incubation with goat anti-mouse IgG (H+L) conjugated to R-PE (0.08 µg/ml) and washed 3 times. The human plasma-derived exosomes were then simultaneously stained with anti-human CD9 (0.14 µg/ml) directly conjugated to Alexa-488 and CTX directly conjugated to Alexa-647 (0.25 µg/ml) in the presence of 100 µg/ml of human IVIG. Human plasma-derived exosomes were washed 3 times and analysed by FAVS. For each antibody, a range of concentrations was used to stain exosomes to achieve the optimal concentration that maximized the MFI difference between the negative and positive populations.
All FAVS analysis and sorting were performed on a FACSAria IIIu flow cytometer customized with a forward scatter PMT, improved forward-angle light scatter sensitivity, up to 2- to 4-fold depending on the size of the particle being interrogated, and standardized for sensitivity and linearity. To more precisely assess the sizing capability of this instrument, we examined 3 bead preparations: Megamix-Plus SSC (Biocytex, Marseille, France); Gigamix (a 1:1 mixture of Megamix-Plus FSC and Megamix-Plus SSC) (Citation21); and 40 nm fluorescent beads (Duke Scientific, Palo Alto, CA, USA). The 40 nm beads were diluted to a factor of 2.25×10⁻⁷ to achieve a final bead concentration of 1×10⁶/ml.
Flow cytometer specific settings
The FACSAria IIIu sorter has a gel-coupled cuvette with a 1.2 NA objective to collect side scatter and fluorescent light, which is near the theoretical limit for an oil immersion lens of 1.4 NA. Thus, a cuvette-based system allows significantly improved light collection compared to non-cuvette-based sorters. In addition, the decreased use of laser power with the FACSAria IIIu compared to other sorters (which is <50 mW for 405 nm, <20 mW for 488 nm, <50 mW for 561 nm and <18 mW for 633 nm lasers), made possible by the gel-coupled cuvette, leads to decreased noise introduced into the system by stray scattered light originating from the laser and stream interface found in typical jet-in-air sorters. This is distinct from the jet-in-air Influx™ sorter collection system (BD Biosciences), which uses laser powers of <100 mW for 405 nm, <200 mW for 488 nm, <75 or <150 mW for 561 nm and <120 mW for 640 nm.
Additionally, the FACSAria IIIu flow cytometer used in this study was upgraded with a forward scatter PMT for enhanced small particle detection. We decreased the electrical pulse-processing window extension from the normal setting for cells of 2 to 0 so as to increase pulse-processing speed. The typical laser beam dimension for a jet-in-air sorter, for instance, has an elliptical spot of roughly 20 microns high by 60 microns wide that is ideal for sorting of cells. However, this relatively large interrogation zone increases the likelihood of the swarm effect. The specific beam dimensions reported for the BD FACSAria IIIu instrument used in this study are 9±3 microns high by 65±7 microns wide. This relatively short beam height results in a significantly smaller interrogation zone, reducing the likelihood of the swarm effect. Because the BD FACSAria IIIu sorter has these beam dimensions, it was therefore designed as a slit scanning flow cytometer; in other words, the flow sorter has a limited beam height and width with a minimal window extension (the amount of time allowed for recovery of signal in the beam is 0 rather than 2 units). This configuration allows interrogation of particles as close to real time as possible without having multiple particles measured simultaneously. This configuration for the FACSAria IIIu allows efficient light collection by utilizing an objective lens assembly with a 1.2 NA. The sensitivity of the instrument is further enhanced by the slow transit time of particles (~6 m/sec) through the laser intercepts.
Side scatter threshold was minimized by using unstained, concentrated DiFi and A431 exosomes that were disaggregated, diluted ~100-fold to a concentration of 0.1 µg/ml and immediately run on the sorter with 10,000 events measured in all cases, except buffer and antibody-alone controls; it took less than 6 sec to measure 10,000 events for FAVS exosome analysis. For the buffer and antibody-only controls, all events acquired over 1 min were measured at maximum sample pressure. The nozzle size was 100 µm, the sheath pressure set at 17 psi and the sample pressure was run with a setting less than 3. We used a dual trigger comprising side and forward scatter; forward scatter was used to eliminate noise due to vibration that occurs when droplets are generated. In this way, the instrument was configured to maximize sensitivity and minimize noise, with maximum light collection and high analytical speed (i.e. data processing speed). Efficient FAVS requires optimization at each step for each antibody (titration of primary antibody and second step reagents, choice of fluorescent probe). Exosomes were vigorously resuspended, as described above, to prevent aggregation, thus ensuring to analysis of a monodispersed particle mixture. Particles that are properly resuspended and diluted have uniform scatter properties maximizing the peak width and height to be less than 2-fold different from the mean with an approximate Gaussian distribution of fluorescent intensities that include over 80% of the total singlet events.
Immunoblot analysis
Exosomes or serum-starved cells (A431 and DiFi) were lysed in ice-cold RIPA buffer: 50 mM Tris–HCl pH 7.5, 150 mM NaCl, 1% Triton X-100, 1% deoxycholate, 0.1% SDS, 1 mM PMSF containing a complete protease inhibitor tablet and PhosSTOP tablet (Roche). Lysates and exosomes were sonicated 3 times and were cleared by centrifugation at 14,000 rpm for 5 min. Supernatant fractions were quantified using direct Detect™ and used for immunoblotting. Proteins were resolved by SDS-PAGE under reducing conditions, except for CD81 and AREG immunoblots, which were resolved under non-reducing conditions and transferred to nitrocellulose membranes (GE Healthcare, Pittsburgh, PA, USA). Membranes were blocked with 5% (w/v) skim milk powder in Tris-buffered saline for 1 h and incubated with primary antibodies overnight at 4°C. The primary antibodies against the following proteins were used for immunoblotting: anti-EGFR (1:1,000; Millipore), anti-EGFR (mAb 806, 1:1,000; Ludwig Institute of Cancer Research), anti-p-Y1092 EGFR (1:1,000; Abcam), anti-pY1173 EGFR (1:1,000; Abcam), anti-syntenin-1 (1:5,000; Abcam), anti-AREG (6R1C2.4, 1:1,000) and anti-CD81 (1:1,000; R&D Systems). Anti-rabbit IgG, horseradish peroxidase (HRP)-linked antibody (1:1,000; Sigma, St Louis, MO, USA) and anti-mouse IgG, HRP-linked antibody (1:5,000; Jackson Immunoresearch, West Grove, PA, USA) were used as secondary antibodies. After incubation with HRP-coupled secondary antibodies for 1 h, immunoblots were developed using chemiluminescence (Western Lightning Plus-ECL, PerkinElmer, Waltham, MA, USA).
Electron microscopy
Exosomes were fixed with 2.5% glutaraldehyde in 0.1 M sodium cacodylate buffer for 30 min at RT. The exosomes were incubated on formvar carbon-coated grids for 1 min followed by negative staining with 2% uranyl acetate for 30 sec. Imaging was performed on a Philips/FEI T-12 transmission electron microscope.
Primary antibody fluorescent tag modification
CTX, mAb 806 or CD9 antibody (all antibodies at 2 µg/µl with 250 µl labelled) were transferred to a 2 mL Zeba Spin desalting column (Thermo Fischer Scientific, Waltham, MA, USA). PBS (100 µl) was used to rinse out the antibody source vial; it was added to the column, which was then spun at 1,000× g for 5 min. All purified antibody from the column was added to NHS-ester Alexa-647 (Life Technologies, Thermo Fisher Scientific, Waltham, MA, USA) or Alexa-488 (Technologies, Thermo Fisher Scientific, Waltham, MA, USA) where the dye was first dissolved in DMSO. Reactions were performed at RT for 2 h. After the reaction, the mixture was purified through another 2 mL Zeba Spin desalting column to remove unconjugated dye.
Stochastic optical reconstruction microscopy
Final validation of sorting efficiency and accuracy was determined by STORM with a lateral resolution of ~20 nm and an axial resolution of ~50 nm. Samples were prepared using the standard Nikon protocol (www.mvi-inc.com/wp-content/uploads/N-STORM+Protocol.pdf). FAVS-sorted exosomes labelled with Alexa 647-CTX and anti-CD9 antibody with secondary Alexa 488 CD9-directed antibody were centrifuged as in the wash steps above and resuspended in 0.3 ml PBS. Lab-Tek II (Thermo Scientific) chambered cover glass slides were prepared by sonicating in 1 M potassium hydroxide for 15 min, then rinsed with Milli-Q water and exposed to UV light in a biosafety cabinet for 30 min. Chamber slides were poly-L-lysine coated (Sigma-Aldrich, P4707, 0.01% solution), treating slides for 5 min, washing with Milli-Q water and drying in a biosafety cabinet for 2 h. Labelled exosomes were applied to slides and allowed to attach overnight at 4°C. Chambers were aspirated and fresh PBS added. Immediately before imaging, 7 µl of GLOX solution [14 mg glucose oxidase (Sigma-Aldrich), 850 µg catalase (Sigma-Aldrich) in 200 µl 10 µM Tris (pH 8.0), 50 mM NaCl] was added to 690 µl of 50 mM Tris (pH 8.0), 10 mM NaCl, 10% glucose solution. Prior to use, the GLOX solution was spun at 14,000 rpm for 1 min. Finally, 7 µl of β-mercaptoethanol (Sigma-Aldrich) was added to the GLOX solution mixture, the buffer was removed from one well of attached exosomes to be imaged and the entire GLOX solution was added to that well. Particles were visualized within 1 h of processing. This process was repeated for each individual chamber slide well that was imaged. Ten thousand events were analysed in the Alexa-488 and Alexa-647 channels using the Nikon Storm analysis software NIS-Elements. We identified exosomes based on the criteria of multiple positive identifications in the Alexa-488 and Alexa-647 channels in structures of the size and shape of exosomes.
Nanoparticle tracking analysis
Exosome samples were analysed by nanoparticle tracking, using a NanoSight LM10 system (NanoSight Ltd, Amesbury, UK), configured with a 405 nm laser and a high-sensitivity sCMOS camera (OrcaFlash 2.8, Hamamatsu C11440, NanoSight Ltd). Analysis using the NTA-software (version 2.3, build 0006 beta 2) was essentially as previously described (Citation52). In brief, each sample was diluted 1,000-fold in particle-free PBS and introduced manually. The detection threshold was 10, blur and minimum expected particle size were set to “auto” and minimum track length set to 10. The ambient temperature was recorded manually and did not exceed 25°C. Five videos of 60 sec duration were recorded for each sample. Calibrations were performed using polystyrene latex microspheres with sizes of 100, 200 and 400 nm.
Results
Isolation of CD9- and EGFR-containing exosomes from DiFi conditioned medium by FAVS
We initially introduced FAVS as a method to analyse and sort Naked2 (NKD2)-associated exocytic vesicles that transport TGF-α to the basolateral surface of polarized epithelial cells (Citation20). We subsequently used FAVS to analyse exosomes containing TGF-α and 2 additional EGFR ligands, AREG and HB-EGF, in human breast and CRC cell lines (Citation9). In each instance, we were able to detect vesicles that were 40–130 nm in diameter as determined by nanoparticle tracking analysis (NTA), confocal microscopy and EM. These results were achieved by optimal configuration of a commercially available flow cytometer, and this configuration was adhered to in the present study (Materials and Methods and Discussion). FAVS analysis was performed using a FACSAria IIIu flow cytometer (BD Biosciences). For FAVS, we utilized a dual trigger consisting of side and forward scatter followed by sorting based on fluorescent intensity of populations of interest that are gated into discrete subsets, which can then be subjected to further analysis.
To demonstrate the ability of this flow cytometer to detect individual small particles, we examined 3 different bead preparations (Citation21). The instrument is able to discriminate beads 40 nm apart in size (Supplementary Fig. 1) and to detect individual fluorescent beads 40 nm in diameter (Supplementary Fig. 2). Thus, this optimally configured flow cytometer has the sensitivity and resolving power to detect individual particles within the size range of exosomes.
To examine the feasibility of detecting EGFR in exosomes, we chose to study DiFi cells, a human CRC cell line that expresses 5×10⁶ EGFR molecules per cell (Citation22). Exosomes were isolated by sequential ultracentrifugation from the conditioned medium of DiFi cells cultured under serum-free conditions (Materials and Methods). The exosome pellet was resuspended in 1 ml of PBS with HEPES, pH 7.35, and syringed sequentially and repeatedly, at least 7 times, through 22, 27 and 30 gauge needles to achieve a uniformly dispersed solution of individual exosomes based on their light scattering and fluorescent properties (Materials and Methods).
One hundred micrograms of exosomes from DiFi cells were stained with antibodies to CD9 and EGFR directly labelled with fluorescent dyes. The antibody to CD9 was conjugated to Alexa-488 and the antibody to EGFR, cetuximab (CTX), was conjugated to Alexa-647 as described in Materials and Methods. These primary-labelled antibodies were incubated individually or together with purified exosomes for 4 h under constant rotation at room temperature (RT), and then pelleted and washed 3 times before FAVS analysis (Materials and Methods).
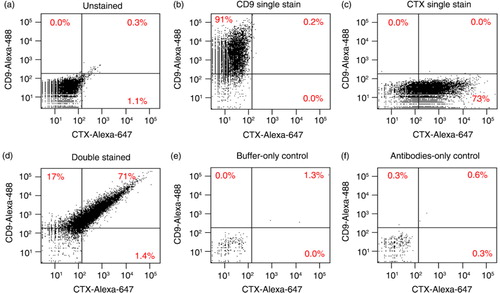
In each case (a–d), the fluorescent intensity of 10,000 particles was measured and displayed as dot plots of fluorescent intensity. Unstained DiFi exosomes had minimal background fluorescence and were used to set the fluorescent gates (a). DiFi exosomes singly stained for CD9 displayed 91% positivity and more than a 127-fold shift of mean fluorescence intensity (MFI) (b). Exosomes stained for EGFR showed 73% positivity and more than a 61-fold increase in MFI (c). Exosomes stained for both CD9 and EGFR were greater than 71% double-positive and exhibited a 111-fold increase in MFI for CD9 and a 58-fold increase in MFI for EGFR (d). The sorting buffer by itself produced negligible background (e), as did the antibodies alone when diluted in buffer solution without exosomes (f). Due to the small number of events detected in these controls, dot plots in e and f represent 1 min of acquisition at maximal sample pressure.
Fig. 1. FAVS identification of DiFi exosomes containing CD9 and EGFR using directly labelled primary antibodies. (a–d) Exosomes purified by sequential ultracentrifugation from DiFi conditioned medium were stained and subjected to FAVS analysis (Materials and Methods). Samples were unstained (a), single stained with an Alexa-488-labelled CD9 antibody (b), single stained with Alexa-647-labelled cetuximab (CTX) for EGFR (c) or simultaneously stained with both primary labelled antibodies (d). In (a)–(d), dot plots show fluorescent intensities of 10,000 events; maximal acquisition time was 6 sec and sample pressure was < 3. In (e) and (f), dot plots represent 1 min of acquisition at maximal sample pressure (set to 11) with buffer only (e) or antibodies only (f). Percentages of gated populations are shown.
To demonstrate our ability to not only analyse but also sort pure populations of vesicles, we scaled up the input material 100-fold to 10 mg of DiFi exosomes. Once again, staining was performed with directly conjugated primary antibodies. In a, the CD9/EGFR double-positive population is bracketed in red and the CD9/EGFR double-negative population is bracketed in blue; these percentages are similar to the results in . Post-sort analysis of the double-positive population showed a slight enrichment from 74 to 94%, but depletion of the double-negative population; the double-negative population was enriched over 4-fold upon post-sort analysis. Dot plots show that aggregated vesicles were gated out (Supplementary Fig. 3) and the staining procedure did not appreciably change the light scattering characteristics or aggregation of the vesicles (Supplementary Fig. 4). Neither the sorting buffer nor the antibodies diluted in sorting buffer produced appreciable levels of background signal (Supplementary Fig. 5), similar to the results in e and f.
Fig. 2. FAVS sorting of DiFi exosomes with subsequent immunoblot and stochastic optical reconstruction microscopy (STORM) analysis. (a) Dot plot of fluorescent intensities from FAVS analysis of DiFi exosomes stained with an Alexa-488-labelled CD9 antibody (y-axis) and Alexa-647-labelled CTX antibody for EGFR (x-axis). Percentages of gated populations from 10,000 total events are shown. Red box marks double-positive exosomes and blue box marks double-negative exosomes. (b) Post-sort analysis of double-positive exosomes. (c) Post-sort analysis of double-negative exosomes. (d) Immunoblot of flow-sorted exosomes. Blot was probed for EGFR and the exosomal markers, syntenin-1 and CD81. Equal quantities of protein were loaded in each lane. (e) Double-positive, flow-sorted exosomes were subjected to STORM (Materials and Methods). A representative image of an approximately 80 nm particle positive for EGFR (red) and CD9 (green) is shown.
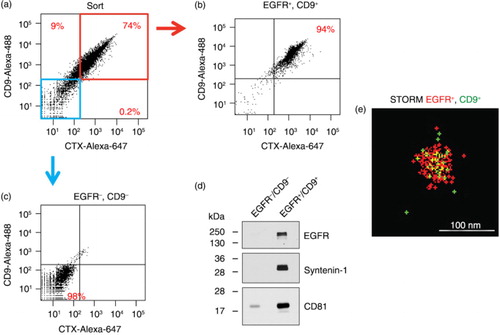
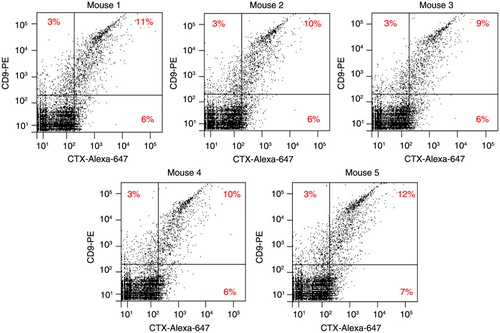
Fig. 3. FAVS analysis of human CD9+/EGFR+ exosomes in plasma from mice bearing DiFi tumour xenografts. Athymic nude mice were injected subcutaneously with 5×10⁶ DiFi cells. When tumours reached 800 mm3 in volume, mice were sacrificed, blood collected and exosomes purified from plasma. Each dot plot represents fluorescent intensities of 10,000 total events from plasma exosomes isolated from individual mice and subjected to FAVS analysis using antibodies specific for human CD9 (y-axis) and EGFR (CTX) (x-axis). Exosomes were stained with anti-CD9 antibody, washed repeatedly and then stained with a secondary antibody labelled with R-PE. Following additional washes, exosomes were stained with CTX directly conjugated with Alexa-647, washed and analysed. Percentages of gated populations are shown.
To assess the purity of these 2 populations, we performed immunoblotting of the EGFR/CD9 double-positive and double-negative sorted populations (d). EGFR, as well as the exosomal markers, syntenin-1 and CD81, were easily detected in the double-positive population, but were absent or barely detected in the double-negative population, demonstrating the purity of these 2 sorted populations.
To document that individual exosomes containing both EGFR and CD9 had been purified, we performed STORM imaging of both double-positive and double-negative exosomal populations (Materials and Methods). EGFR and CD9 were present on the surface of double-positive particles as shown in a representative STORM image of an individual particle approximately 100 nm in diameter (e). The STORM signal in these particles was distinct from occasional intermittent signals observed in each field. Double-positive particles were also evident in larger fields of the CD9+/EGFR+ purified exosomes in Supplementary Fig. 6, where additional examples of labelled particles are also shown. Double-positive particles were not observed in CD9−/EGFR− purified exosomes (Supplementary Fig. 6). Thus, based on post-sort FAVS analysis, immunoblotting for exosomal markers and high-resolution imaging of purified vesicles, FAVS is able to identify and sort individual exosomes expressing different cell-surface markers.
Detection of DiFi-derived exosomes in mouse plasma by FAVS
To examine the sensitivity and specificity of FAVS, we sought to detect human exosomes within a mixed mouse–human exosomal population. DiFi-derived exosomes were added in increasing quantities to a fixed amount of exosomes purified from mouse plasma. FAVS was used to generate a titration curve for the presence of increasing amounts of human exosomes. Staining of exosomes was performed using anti-human CTX and CD9 antibodies. FAVS detected as little as 2.5% wt/wt of DiFi exosomes mixed with mouse plasma-derived exosomes, as determined by EGFR/CD9 double positivity. Addition of increasing amounts of DiFi exosomes to mouse plasma exosomes led to a steady increase in identifiable CD9+ and EGFR+ exosomes (Supplementary Fig. 7). The relationship between the number of human exosomes added to mouse plasma-derived exosomes and the number of positive events detected with FAVS was linear ( Supplementary Fig. 8). We confirmed that these antibodies did not recognize murine EGFR or CD9 (Supplementary Fig. 9).
We next tested whether human EGFR/CD9 double-positive exosomes could be detected by FAVS in the plasma of athymic nude mice in which DiFi cells had been injected subcutaneously and tumour xenografts established. When tumours reached approximately 800 mm3 in 5 mice, blood was collected and exosomes were purified from plasma and then stained for anti-human EGFR and CD9, prior to FAVS analysis. Once again, CTX was directly labelled with Alexa-647 to monitor human EGFR. In this instance, we used a R-phycoerythrin (R-PE)-labelled secondary antibody directed to the anti-human CD9 antibody as a means to increase sensitivity.
In contrast to sham-injected mice, plasma-derived exosomes from DiFi tumour-bearing mice displayed detectable anti-human EGFR and CD9 double-positive exosomes, ranging from 9 to 12% of the total number of exosomes (). The majority of exosomes positive for human CD9 were also positive for human EGFR. These data show that human DiFi tumour xenografts released sufficient quantities of exosomes into the mouse circulation to be detected by FAVS using human antigen-specific antibodies. Due to the use of a secondary antibody to detect CD9 with the attendant potential for antibody bridging, we cannot exclude that some of the signal detected may be due to co-detection of more than 1 vesicle, the so-called “swarm effect.”
Using FAVS to assess exosomal EGFR activation state
Because EGFR is known to traffic to exosomes in a ligand- and kinase-dependent manner (Citation23), we sought to determine whether we could assess the activity state of EGFR in individual exosomes by FAVS. To do this, we utilized 2 EGFR mAbs that recognize distinct epitopes in the EGFR ectodomain. CTX binds to ligand-binding domain 2, whereas mAb 806 recognizes cysteine-rich region 1, which is not exposed when EGFR is in its tethered, inactive state (Citation24, Citation25). However, this domain becomes exposed when EGFR adopts an untethered, conformationally active state that results in activation of the receptor's cytoplasmic tyrosine kinase leading to autophosphorylation of 7 tyrosine (Y) residues, including Y1068 and Y1173. For this analysis, in addition to DiFi-derived exosomes, we also examined exosomes from A431 cells, a human epidermoid cancer cell line that also expresses high levels of EGFR, approximately 2.5×10⁶ EGFR molecules per cell (Citation26). A431 cells previously have been shown to produce microvesicles that contain EGFR (Citation27).
We performed FAVS analysis on A431- and DiFi-derived exosomes stained with directly conjugated antibodies: mAb 806 alone; CTX alone; or mAb 806 followed by CTX (). Single staining of A431-derived exosomes with mAb 806 followed by FAVS analysis revealed that 4% of exosomes were mAb 806-positive, whereas 22% of A431 exosomes were positive when single-stained with CTX prior to FAVS analysis. After serial staining, only 0.6% of A431 exosomes were double-positive by FAVS analysis (a).
Fig. 4. Analysis of EGFR and its activity state in DiFi and A431 exosomes. FAVS analysis for (a) A431 and (b) DiFi exosomes. Shown are dot plots of fluorescent intensity for purified exosomes stained for “conformationally active” EGFR using mAb 806 directly conjugated to Alexa-647 (x-axis) and total EGFR using Alexa-488-conjugated CTX (y-axis). Percentages indicate different gated populations from 10,000 total events. Shown are dot plots for unstained (upper left), single stained for EGFR with CTX-Alexa-488 antibody (upper right), single stained for “conformationally active” EGFR with mAb 806-Alexa-647 antibody (lower left) and double stained with CTX-Alexa-488 and mAb806-Alexa-647 antibodies (bottom right). (c) Buffer-only control (left) and antibodies-only control (right) with no exosomes. Because of low number of events in these cases, events were measured for 1 min at the maximal sample pressure (set to 11) rather than 10,000 total events. (d) Electron micrographic images of A431 (left panels) and DiFi (right panels) exosomes processed for FAVS analysis. Micrographs are shown at low (top panels) and high (bottom panels) magnification. Size bars are shown. (e) Immunoblot comparisons of total EGFR and active, tyrosine-phosphorylated (p-Y) EGFR in A431 and DiFi cell lysates (left) and exosomes (right). Equal quantities of protein were loaded in each lane.
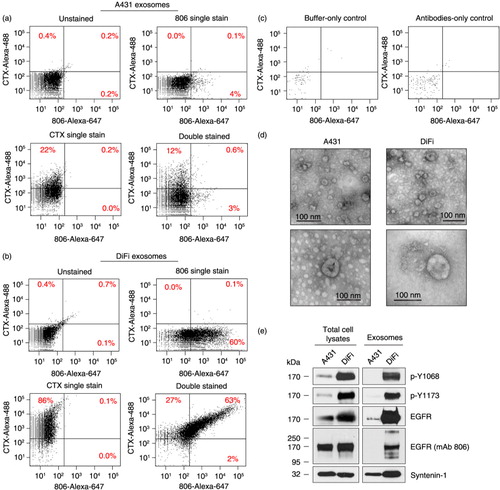
In marked contrast, 60% of DiFi-derived exosomes were positive by FAVS analysis after single staining with mAb 806, a 15-fold increase compared to A431 mAb 806 single-stained exosomes. Single staining with CTX resulted in 86% positivity, a 3.9-fold increase compared to A431 exosomes. The greatest differences were observed by FAVS analysis after serial staining in which there was 63% double positivity with DiFi exosomes compared to 0.6% with A431 exosomes, representing a 105-fold increase in DiFi versus A431 exosomes (b).
There was negligible FAVS signal with buffer-only and antibody-only controls (c), thus reducing the likelihood of antibody aggregates. To assess the structural integrity of exosomes under these experimental conditions, purified exosomal samples that had been processed for FAVS were analysed by EM. d provides evidence that exosomes appeared intact after isolation and staining procedures.
To further support that the increased FAVS signal with the conformationally active mAb 806 staining of DiFi exosomes represented increased EGFR activity, we performed immunoblotting of A431 and DiFi cell lysates and exosomes with p-Y1068 and p-Y1173, 2 tyrosine-phosphorylated residues in the EGFR cytoplasmic tail (e). Notably, both tyrosine-phosphorylated residues were significantly increased in DiFi cell lysates and exosomes compared to their A431 counterparts, providing direct evidence that EGFR is activated in DiFi exosomes.
In cell lysates, using an antibody that recognizes the C-terminus of EGFR, levels of full-length 170 kDa EGFR were approximately 2-fold higher in DiFi compared to A431 cells (e), consistent with their previously reported levels (Citation22, Citation26). It appeared that total EGFR was even more enriched in DiFi exosomes compared to A431 exosomes. There was equivalent intensity of full-length 170 kDa EGFR in A431 and DiFi cell lysates when probed with mAb 806. Under the denaturing conditions of immunoblotting, the untethered conformationally active form of EGFR is lost, and mAb 806 recognizes denatured EGFR (e). DiFi exosomes probed with mAb 806 exhibited 3 less abundant EGFR species – 1 slower and 2 faster migrating forms. The precise nature of these isoforms remains to be determined. Syntenin-1, a known constituent of exosomes (Citation28–Citation30), was used as a control for both cell lysates and exosomes.
Taken together, these results show that FAVS is able to detect total and conformationally active endogenous EGFR on individual exosomes isolated from the conditioned medium of an EGFR-overexpressing cancer cell line. The increased staining with mAb 806 in DiFi exosomes versus A431 exosomes correlates with the greater EGFR activity detected in DiFi exosomes, as determined by p-Y1068 and p-Y1173.
Utilization of multicolour FAVS for detection of CD9, EGFR and AREG in human plasma-derived exosomes
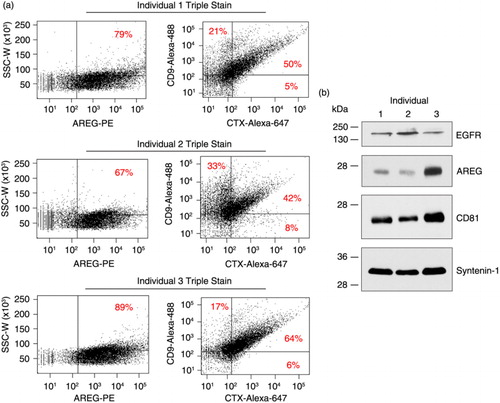
Because we were able to detect exosomes expressing human EGFR in the plasma of mice bearing human colorectal cancer xenografts, we next tested whether we could detect EGFR and AREG in human plasma-derived exosomes. The use of AREG-directed antibodies in FAVS was validated in a previous work (Citation9). To increase sensitivity, we used a 2-step approach in which an R-PE-labelled secondary antibody was added to the AREG primary antibody that was first used to stain exosomes. Blood was collected from 3 normal donors, plasma was prepared and exosomes isolated by sequential ultracentrifugation. Multicolour FAVS was then employed for simultaneous detection of AREG, CD9 and EGFR using specific antibodies. AREG was consistently found in exosomes from normal human plasma with the percentage of exosomes staining for AREG ranging from 67 to 89% (a). Based on the baselines of unstained exosomes from each donor (Supplementary Fig. 10), dot plots of human CD9 and EGFR were subsequently gated into 4 distinct populations (a). For each of the 3 individual samples, the most abundant population of exosomes was CD9/EGFR double-positive, which ranged from 42 to 64%. Immunoblot analysis of the plasma-derived exosomes for EGFR, AREG and the exosomal markers CD81 and syntenin-1 confirmed the FAVS analysis (b). Exosomes from the plasma of these 3 individuals were shown to contain full-length EGFR and the 26 kDa transmembrane form of AREG, the major isoform of this EGFR ligand (Citation31–Citation33).
Fig. 5. Detection of EGFR, AREG and CD9 in exosomes purified from plasma of 3 normal individuals. (a) Exosomes were purified by sequential ultracentrifugation from plasma of three normal donors. Exosomes were first stained with a primary antibody against AREG (6R1C2.4) followed by a PE-conjugated secondary antibody. These were then stained with directly labelled antibodies specific for human CD9 (an Alexa-488-labelled CD9 antibody) and EGFR (Alexa-647-labelled CTX) followed by FAVS analysis. Shown are dot plots of 10,000 ungated events. The left dot plot shows side scatter peak width (y-axis) by AREG fluorescent intensity (x-axis). The right dot plot shows CD9-Alexa-488 (y-axis) by CTX-Alexa-647 (x-axis) fluorescent intensities. (b) Immunoblot analysis of exosomal proteins purified from plasma. Blots were probed for EGFR, AREG and exosomal markers, CD81 and syntenin-1.
Several additional control experiments were performed. To address whether the use of a secondary antibody to AREG might induce bridging between vesicles, we blocked free secondary anti-mouse binding sites with excess mouse IgG prior to staining for CD9 and CTX (Supplementary Fig. 11). Similar results were obtained with or without the blocking step. We also performed a fluorescence-minus-one experiment in which exosomes were stained for CD9 and CTX with and without AREG staining. FAVS analysis of CD9 and CTX levels was similar when comparing double-stained with triple-stained exosomes (Supplementary Fig. 11). These results suggest that vesicle aggregation through secondary antibody bridging is not substantially altering our FAVS results. We additionally considered whether platelet-derived vesicles might influence our results. In Supplementary Fig. 12, we show that these plasma exosomes did not contain platelet contaminants, as determined by the absence of CD41b staining (Citation21).
Taken together, these results demonstrate that multicolour FAVS can simultaneously detect EGFR, AREG and CD9 on human plasma-derived exosomes.
Discussion
Using an optimally configured, commercially available flow cytometer, we showed the ability of FAVS to both analyse and sort exosome-sized particles containing EGFR and CD9 that were isolated by sequential ultracentrifugation from the conditioned medium of a colorectal cancer cell line, DiFi, which overexpresses EGFR. STORM imaging and immunoblotting confirmed that FAVS was able to detect individual exosomes containing EGFR and CD9. We demonstrated the ability of FAVS to detect active and total EGFR on exosomes. FAVS was able to detect conformationally active EGFR on DiFi exosomes. Using FAVS, we present evidence that EGFR and one of its ligands, AREG, can be detected in individual exosomes purified from human plasma.
The major hurdles in analysing and sorting EVs have been their small size, complex composition and low refractive index (Citation34). Flow cytometry has long used polymeric beads for instrument standardization and quality control; however, only the latest generation of beads is optimized for size comparisons with EVs across different instrument platforms. Although the properties of beads differ from small vesicles [e.g. beads scatter more light (Citation35, Citation36)], we showed the ability of FAVS to discriminate beads 40 nm apart in size and to detect individual fluorescent beads 40 nm in diameter (Supplementary Figs. 1 and 2). Thus, the FACSAria IIIu flow cytometer, as configured, has the sensitivity and resolving power to detect individual particles within the size range of exosomes.
To place this work in context, it is useful to consider previous studies using flow cytometry to analyse and sort EVs, both microvesicles and exosomes. To address some of the technical hurdles of flow cytometric analysis and sorting of EVs, several recent publications utilized a fluorescence threshold trigger or light scattering to initiate signal acquisition by the sorter. Arraud et al. (Citation37) used a Beckman Coulter Gallios™ cytometer to analyse plasma-derived EVs. These investigators compared analysis of EVs using a forward scatter trigger to that obtained with a fluorescent trigger. Using Annexin-A5 labelled with Cy-5 or antibodies specific for CD41b or CD235a labelled with R-PE as fluorescent triggers for EVs, their detection was improved from 15- to 75-fold compared to a forward scatter trigger alone. Pospichalova et al. (Citation38) utilized an analytical cytometer (Apogee A50/Micro™) to evaluate EVs. This cytometer was uniquely configured to measure light scattered at multiple angles concurrently and resulted in greatly enhanced resolution of EVs. In this study, careful step-by-step optimization of staining of HEK 293-derived EVs (80–200 nm) was performed using protein (CFSE) and lipid-specific (FM 4-64FX) fluorescent probes. They combined the fluorescent trigger with multiple angle scatter detection to discriminate true EV measurements from background. Ultimately, this allowed development of a simplified protocol that accurately analysed EVs isolated from human ascites. This approach did not require removal of unbound dyes and thus shortened the time to analysis (Citation38). However, in the studies by Arraud et al. and Pospichalova et al., sorting of exosomes was not performed.
In another study, Nolte-'t Hoen et al. (Citation39) demonstrated the utility of a CFSE fluorescent trigger for quantitative and qualitative flow cytometric analysis of exosome-sized particles from dendritic cell-derived exosomes. This group used a customized Influx™ sorter (BD Biosciences) (Citation40) that utilized wide-angle forward scatter with a photomultiplier tube (PMT) rather than a conventional diode detector and density gradient ultracentrifugation to remove unbound soluble and aggregated probe. However, daily optimization and quality control of the Influx™ sorter was required with this methodology. Once again, sorting of the EVs was not performed. In an extension of this work, these investigators (Citation41) again used CFSE as a fluorescent trigger to not only analyse but also sort EVs from marrow-derived mast cells. They probed specifically for CD9 and CD63 to subset these EVs.
Critical to our success were an optimally configured flow cytometer and extreme care in sample collection and processing. We previously introduced FAVS as a method to flow sort biochemically enriched, NKD2-associated exocytic vesicles displaying an input size range of 30–300 nm in diameter and post-sort size range of 40–75 nm, as determined by confocal microscopy and EM (Citation20). We subsequently employed FAVS to characterize AREG, TGF-α and HB-EGF alone, or all 3 EGFR ligands simultaneously, in exosomes isolated from conditioned medium of human breast and CRC cell lines (Citation9).
In these prior studies and the present study, FAVS was performed using a FACSAria IIIu flow cytometer that has a gel-coupled cuvette with highly efficient light collection optics. The cuvette has a 1.2 numerical aperture (NA) objective to collect side scatter and fluorescent light. Non-cuvette-based, jet-in-air sorters typically have an NA of less than 0.7 that results in less efficient light collection; this is compensated for by increasing the laser power, which unfortunately often increases background signal (Citation42). These jet-in-air sorters can be extremely fast, collecting as many as 200,000 events/sec. A potential downside of this increased speed is the increased likelihood of multiparticle detection as one event within the laser intercepts, also known as the “swarm effect” (Citation36). In contrast, we configured the FACSAria IIIu instrument to trigger off simultaneous side scatter and forward scatter followed by sorting based on fluorescent intensity of populations of interest that are gated into discrete subsets.
The instrument is optimized for fluorescence and side scatter, which provides greater sensitivity. The simultaneous measurement of side scatter and forward scatter enables elimination of background noise by the less sensitive forward scatter trigger. To enable longer dwell time within the laser intercept with increased side scatter and fluorescent signals, the nozzle size was increased to 100 microns from 70 microns and the sheath pressure was reduced to 17 psi from 70 psi. The beam height is designed by the manufacturer to be short (9±3 microns), which decreases the probability of detecting more than 1 particle at a time. We also found that reducing the pulse-processing window extension from 2 to 0 units increases the speed of analysis. To further avoid the swarm effect, we utilized a maximum event rate of 3,500 events/sec and never exceeded a sample pressure of 3 on a scale of 11.
For most of the experiments, we used primary antibodies directly conjugated to a fluorescent dye. This step avoids the potential for artefacts like cross reactivity and aggregation of multiple vesicles associated with the use of labelled secondary antibodies. However, in some cases, we attempted to enhance sensitivity by using primary and secondary antibodies, as was done to detect CD9 on human DiFi exosomes present in mouse plasma () and to detect AREG in human plasma-derived exosomes (). In the latter instance, we tested whether secondary antibody bridging was an issue. Free secondary antibody binding sites on fluorescent anti-mouse-PE were blocked with excess mouse IgG before staining for EGFR (CTX) and CD9. The inclusion of this blocking step did not appear to alter FAVS analysis substantially (Supplementary Fig. 11). In addition, fluorescence-minus-one staining with just EGFR (CTX) and CD9, with no AREG staining, did not substantially alter the FAVS analysis. These results suggest that secondary antibody bridging does not appear to be a significant factor in the analysis.
In addition, we attempted to minimize the possibility of bridging of exosomes by antibodies in our staining procedure. Staining of exosomes is detailed in Materials and Methods; extensive washing is required to remove unbound antibodies. Each antibody was titrated to determine the optimal concentration for staining, with the amount of antibody used to stain exosomes in each case titred so that the mean fluorescent intensities between the negative and positive populations were greatest. Finally, we reduced compensation to a minimum by using 1 fluorophore per laser line. By incorporating these steps to a FACSAria IIIu flow cytometer, we can detect individual exosomes down to a size of 80 nm, based on STORM and immunoblotting ( and Supplementary Fig. 6).
In DiFi exosomes, we found a direct correlation between increased FAVs staining for mAb 806 and activated EGFR, as determined by phosphorylation of tyrosine (Y) residues in the EGFR cytoplasmic tail by immunoblotting, an accepted read-out of EGFR activity. This antibody recognizes an epitope that is not exposed when EGFR is in its inactive (tethered) state. This domain is exposed when EGFR adopts an extended (untethered) conformation; this conformation is linked to receptor oligomerization and activation of the receptor's intrinsic tyrosine kinase activity that phosphorylates EGFR tyrosine residues, initiating a complex downstream signalling cascade. mAb 806 is thought to be tumour-specific; it recognizes the EGFRvIII mutant that is frequently found in glioblastomas and tumours that overexpress EGFR (Citation43). We show by FAVS, and confirm by immunoblotting, that DiFi exosomes have greater total and activated EGFR compared to A431 exosomes; these differences appear greater than what is observed in the DiFi and A431 lysates. These findings indicate the power of FAVS to distinguish EGFR receptor status on individual exosomes. Future studies will determine whether exosomes containing the EGFRvIII mutant also exhibit increased mAb 806 staining by FAVS.
The ability to assess AREG and EGFR in circulating exosomes has potential clinical relevance for CRC and possibly other EGFR-responsive tumours. CTX is approved by the US FDA to treat individuals with CRC whose tumours are wild-type KRAS (Citation44, Citation45). CTX is more likely to be effective if AREG mRNA expression is high in the tumour (Citation46). Going forward, it will be of interest to determine if exosomal levels of AREG, and possibly EGFR, in the circulating exosomes of CRC patients can be used to monitor disease status and the likelihood of responding to CTX. It is also possible that EGFR on circulating exosomes may act as a decoy for CTX, thereby reducing the effective dose of the antibody delivered to the tumour. Studies are underway to test this hypothesis.
FAVS represents a major technical advance by allowing analysis and sorting of exosomes based on the expression of candidate cell-surface markers. The analysis and purification of exosomes via FAVS will further our understanding of these EVs and their subpopulations that are altered in disease states and may help uncover the molecular mechanisms underlying their biological functions.
Conflict of interest and funding
The authors have not received any funding or benefits from industry or elsewhere to conduct this study.
Supplementary Material
Download PDF (4.8 MB)Acknowledgements
This work was supported by National Cancer Institute U19 CA179514, RO1 CA163563, R01 CA46413 and GI Special Program of Research Excellence P50 95103 to RJC and by P30 DK058404 to JLF. Flow cytometry experiments were performed in the Vanderbilt University Flow Cytometry Shared Resource, which is supported by the Vanderbilt-Ingram Cancer Center P30 CA68485 and the Vanderbilt Digestive Disease Research Center P30 DK058404. We thank Emily Poulin and Bhuminder Singh for editing the manuscript.
Notes
To access the supplementary material to this article, please see Supplementary files under ‘Article Tools’.
Related Research Data
References
- Colombo M, Raposo G, Thery C. Biogenesis, secretion, and intercellular interactions of exosomes and other extracellular vesicles. Annu Rev Cell Dev Biol. 2014; 30: 255–89.
- Shifrin DA Jr., Demory Beckler M, Coffey RJ, Tyska MJ. Extracellular vesicles: communication, coercion, and conditioning. Mol Biol Cell. 2013; 24: 1253–9.
- Patton JG, Franklin JL, Weaver AM, Vickers K, Zhang B, Coffey RJ, etal. Biogenesis, delivery, and function of extracellular RNA. J Extracell Vesicles. 2015; 4 27494, doi: http://dx.doi.org/10.3402/jev.v4.27494 .
- Mathivanan S, Ji H, Simpson RJ. Exosomes: extracellular organelles important in intercellular communication. J Proteomics. 2010; 73: 1907–20.
- Penfornis P, Vallabhaneni KC, Whitt J, Pochampally R. Extracellular vesicles as carriers of microRNA, proteins and lipids in tumor microenvironment. Int J Cancer. 2016; 138: 14–21.
- EL Andaloussi S, Mager I, Breakefield XO, Wood MJ. Extracellular vesicles: biology and emerging therapeutic opportunities. Nat Rev Drug Discov. 2013; 12: 347–57.
- Booth AM, Fang Y, Fallon JK, Yang JM, Hildreth JE, Gould SJ. Exosomes and HIV Gag bud from endosome-like domains of the T cell plasma membrane. J Cell Biol. 2006; 172: 923–35.
- Nabhan JF, Hu R, Oh RS, Cohen SN, Lu Q. Formation and release of arrestin domain-containing protein 1-mediated microvesicles (ARMMs) at plasma membrane by recruitment of TSG101 protein. Proc Natl Acad Sci USA. 2012; 109: 4146–51.
- Higginbotham JN, Demory Beckler M, Gephart JD, Franklin JL, Bogatcheva G, Kremers GJ, etal. Amphiregulin exosomes increase cancer cell invasion. Curr Biol. 2011; 21: 779–86.
- Thery C, Ostrowski M, Segura E. Membrane vesicles as conveyors of immune responses. Nat Rev Immunol. 2009; 9: 581–93.
- Quesenberry PJ, Aliotta J, Camussi G, Abdel-Mageed AB, Wen S, Goldberg L, etal. Potential functional applications of extracellular vesicles: a report by the NIH Common Fund Extracellular RNA Communication Consortium. J Extracell Vesicles. 2015; 4 27575, doi: http://dx.doi.org/10.3402/jev.v4.27575 [PubMed CentralFull Text].
- Caby MP, Lankar D, Vincendeau-Scherrer C, Raposo G, Bonnerot C. Exosomal-like vesicles are present in human blood plasma. Int Immunol. 2005; 17: 879–87.
- Graner MW, Alzate O, Dechkovskaia AM, Keene JD, Sampson JH, Mitchell DA, etal. Proteomic and immunologic analyses of brain tumor exosomes. FASEB J. 2009; 23: 1541–57.
- Im H, Shao H, Park YI, Peterson VM, Castro CM, Weissleder R, etal. Label-free detection and molecular profiling of exosomes with a nano-plasmonic sensor. Nat Biotechnol. 2014; 32: 490–5.
- Fraser KB, Moehle MS, Daher JP, Webber PJ, Williams JY, Stewart CA, etal. LRRK2 secretion in exosomes is regulated by 14-3-3. Hum Mol Genet. 2013; 22: 4988–5000.
- Hardij J, Cecchet F, Berquand A, Gheldof D, Chatelain C, Mullier F, etal. Characterisation of tissue factor-bearing extracellular vesicles with AFM: comparison of air-tapping-mode AFM and liquid Peak Force AFM. J Extracell Vesicles. 2013; 2 21045, doi: http://dx.doi.org/10.3402/jev.v2i0.21045 .
- van der Pol E, Coumans FA, Grootemaat AE, Gardiner C, Sargent IL, Harrison P, etal. Particle size distribution of exosomes and microvesicles determined by transmission electron microscopy, flow cytometry, nanoparticle tracking analysis, and resistive pulse sensing. J Thromb Haemost. 2014; 12: 1182–92.
- Yuana Y, Koning RI, Kuil ME, Rensen PC, Koster AJ, Bertina RM, etal. Cryo-electron microscopy of extracellular vesicles in fresh plasma. J Extracell Vesicles. 2013; 2 21494, doi: http://dx.doi.org/10.3402/jev.v2i0.21494 .
- Yuana Y, Oosterkamp TH, Bahatyrova S, Ashcroft B, Garcia Rodriguez P, Bertina RM, etal. Atomic force microscopy: a novel approach to the detection of nanosized blood microparticles. J Throm Haemost. 2010; 8: 315–23.
- Cao Z, Li C, Higginbotham JN, Franklin JL, Tabb DL, Graves-Deal R, etal. Use of fluorescence-activated vesicle sorting for isolation of Naked2-associated, basolaterally targeted exocytic vesicles for proteomics analysis. Mol Cell Proteomics. 2008; 7: 1651–67.
- Poncelet P, Robert S, Bouriche T, Bez J, Lacroix R, Dignat-George F. Standardized counting of circulating platelet microparticles using currently available flow cytometers and scatter-based triggering: forward or side scatter?. Cytometry A. 2016; 89: 148–58.
- Gross ME, Zorbas MA, Danels YJ, Garcia R, Gallick GE, Olive M, etal. Cellular growth response to epidermal growth factor in colon carcinoma cells with an amplified epidermal growth factor receptor derived from a familial adenomatous polyposis patient. Cancer Res. 1991; 51: 1452–9. [PubMed Abstract].
- Sanderson MP, Keller S, Alonso A, Riedle S, Dempsey PJ, Altevogt P. Generation of novel, secreted epidermal growth factor receptor (EGFR/ErbB1) isoforms via metalloprotease-dependent ectodomain shedding and exosome secretion. J Cell Biochem. 2008; 103: 1783–97.
- Walker F, Rothacker J, Henderson C, Nice EC, Catimel B, Zhang HH, etal. Ligand binding induces a conformational change in epidermal growth factor receptor dimers. Growth Factors. 2012; 30: 394–409.
- Gan HK, Burgess AW, Clayton AH, Scott AM. Targeting of a conformationally exposed, tumor-specific epitope of EGFR as a strategy for cancer therapy. Cancer Res. 2012; 72: 2924–30.
- Kawamoto T, Sato JD, Le A, Polikoff J, Sato GH, Mendelsohn J. Growth stimulation of A431 cells by epidermal growth factor: identification of high-affinity receptors for epidermal growth factor by an anti-receptor monoclonal antibody. Proc Natl Acad Sci USA. 1983; 80: 1337–41.
- Al-Nedawi K, Meehan B, Kerbel RS, Allison AC, Rak J. Endothelial expression of autocrine VEGF upon the uptake of tumor-derived microvesicles containing oncogenic EGFR. Proc Natl Acad Sci USA. 2009; 106: 3794–9.
- Baietti MF, Zhang Z, Mortier E, Melchior A, Degeest G, Geeraerts A, etal. Syndecan-syntenin-ALIX regulates the biogenesis of exosomes. Nat Cell Biol. 2012; 14: 677–85.
- Ghossoub R, Lembo F, Rubio A, Gaillard CB, Bouchet J, Vitale N, etal. Syntenin-ALIX exosome biogenesis and budding into multivesicular bodies are controlled by ARF6 and PLD2. Nat Commun. 2014; 5: 3477.
- Mathivanan S, Simpson RJ. ExoCarta: a compendium of exosomal proteins and RNA. Proteomics. 2009; 9: 4997–5000.
- Brown CL, Coffey RJ, Dempsey PJ. The proamphiregulin cytoplasmic domain is required for basolateral sorting, but is not essential for constitutive or stimulus-induced processing in polarized Madin-Darby canine kidney cells. J Biol Chem. 2001; 276: 29538–49.
- Brown CL, Meise KS, Plowman GD, Coffey RJ, Dempsey PJ. Cell surface ectodomain cleavage of human amphiregulin precursor is sensitive to a metalloprotease inhibitor. Release of a predominant N-glycosylated 43-kDa soluble form. J Biol Chem. 1998; 273: 17258–68.
- Gephart JD, Singh B, Higginbotham JN, Franklin JL, Gonzalez A, Folsch H, etal. Identification of a novel mono-leucine basolateral sorting motif within the cytoplasmic domain of amphiregulin. Traffic. 2011; 12: 1793–804.
- Erdbrugger U, Lannigan J. Analytical challenges of extracellular vesicle detection: a comparison of different techniques. Cytometry A. 2015; 89: 123–34.
- Chandler WL, Yeung W, Tait JF. A new microparticle size calibration standard for use in measuring smaller microparticles using a new flow cytometer. J Thromb Haemost. 2011; 9: 1216–24.
- van der Pol E, van Gemert MJ, Sturk A, Nieuwland R, van Leeuwen TG. Single vs. swarm detection of microparticles and exosomes by flow cytometry. J Thromb Haemost. 2012; 10: 919–30.
- Arraud N, Gounou C, Turpin D, Brisson AR. Fluorescence triggering: a general strategy for enumerating and phenotyping extracellular vesicles by flow cytometry. Cytometry A. 2015; 89: 184–95.
- Pospichalova V, Svoboda J, Dave Z, Kotrbova A, Kaiser K, Klemova D, etal. Simplified protocol for flow cytometry analysis of fluorescently labeled exosomes and microvesicles using dedicated flow cytometer. J Extracell Vesicles. 2015; 4 25530, doi: http://dx.doi.org/10.3402/jev.v4.25530 [PubMed CentralFull Text].
- Nolte-‘t Hoen EN, van der Vlist EJ, Aalberts M, Mertens HC, Bosch BJ, Bartelink W, etal. Quantitative and qualitative flow cytometric analysis of nanosized cell-derived membrane vesicles. Nanomedicine. 2012; 8: 712–20.
- van der Vlist EJ, Nolte-‘t Hoen EN, Stoorvogel W, Arkesteijn GJ, Wauben MH. Fluorescent labeling of nano-sized vesicles released by cells and subsequent quantitative and qualitative analysis by high-resolution flow cytometry. Nat Protoc. 2012; 7: 1311–26.
- Kormelink TG, Arkesteijn GJ, Nauwelaers FA, van den Engh G, Nolte-‘t Hoen EN, Wauben MH. Prerequisites for the analysis and sorting of extracellular vesicle subpopulations by high-resolution flow cytometry. Cytometry A. 2015; 89: 135–47.
- Shapiro HM. Practical flow cytometry. 2003; New York: Wiley-Liss. 681. 4th ed.
- Reilly EB, Phillips AC, Buchanan FG, Kingsbury G, Zhang Y, Meulbroek JA, etal. Characterization of ABT-806, a humanized tumor-specific anti-EGFR monoclonal antibody. Mol Cancer Ther. 2015; 14: 1141–51.
- Laurent-Puig P, Cayre A, Manceau G, Buc E, Bachet JB, Lecomte T, etal. Analysis of PTEN, BRAF, and EGFR status in determining benefit from cetuximab therapy in wild-type KRAS metastatic colon cancer. J Clin Oncol. 2009; 27: 5924–30.
- Lievre A, Bachet JB, Le Corre D, Boige V, Landi B, Emile JF, etal. KRAS mutation status is predictive of response to cetuximab therapy in colorectal cancer. Cancer Res. 2006; 66: 3992–5.
- Pentheroudakis G, Kotoula V, De Roock W, Kouvatseas G, Papakostas P, Makatsoris T, etal. Biomarkers of benefit from cetuximab-based therapy in metastatic colorectal cancer: interaction of EGFR ligand expression with RAS/RAF, PIK3CA genotypes. BMC Cancer. 2013; 13: 49.
- Garrett TP, Burgess AW, Gan HK, Luwor RB, Cartwright G, Walker F, etal. Antibodies specifically targeting a locally misfolded region of tumor associated EGFR. Proc Natl Acad Sci USA. 2009; 106: 5082–7.
- Kozer N, Kelly MP, Orchard S, Burgess AW, Scott AM, Clayton AH. Differential and synergistic effects of epidermal growth factor receptor antibodies on unliganded ErbB dimers and oligomers. Biochemistry. 2011; 50: 3581–90.
- Lee ST, Ji H, Greening DW, Speirs RW, Rigopoulos A, Pillay V, etal. Global protein profiling reveals anti-EGFR monoclonal antibody 806-modulated proteins in A431 tumor xenografts. Growth Factors. 2013; 31: 154–64.
- Li D, Ji H, Zaghlul S, McNamara K, Liang MC, Shimamura T, etal. Therapeutic anti-EGFR antibody 806 generates responses in murine de novo EGFR mutant-dependent lung carcinomas. J Clin Invest. 2007; 117: 346–52.
- Ymer SI, Greenall SA, Cvrljevic A, Cao DX, Donoghue JF, Epa VC, etal. Glioma specific extracellular missense mutations in the first cysteine rich region of epidermal growth factor receptor (EGFR) initiate ligand independent activation. Cancers (Basel). 2011; 3: 2032–49.
- Jeppesen DK, Hvam ML, Primdahl-Bengtson B, Boysen AT, Whitehead B, Dyrskjot L, etal. Comparative analysis of discrete exosome fractions obtained by differential centrifugation. J Extracell Vesicles. 2014; 3 25011, doi: http://dx.doi.org/10.3402/jev.v3.25011 .