
Abstract
Urine sample analysis is irreplaceable as a non-invasive method for disease diagnosis and follow-up. However, in urine samples, non-degraded protein and RNA may be only found in urinary extracellular vesicles (uEVs). In recent years, various methods of uEV enrichment using low volumes of urine and unsophisticated equipment have been developed, with variable success. We compared the results of the differential ultracentrifugation procedure with 4 of these methods. The methods tested were a lectin-based purification, Exoquick (System Biosciences), Total Exosome Isolation from Invitrogen and an in-house modified procedure employing the Exosomal RNA Kit from Norgen Biotek Corp. The analysis of selected gene transcripts and protein markers of extracellular vesicles (EVs) revealed that each method isolates a different mixture of uEV protein markers. In our conditions, the extraction with Norgen's reagent achieved the best performance in terms of gene transcript and protein detection and reproducibility. By using this method, we were able to detect alterations of EVs protein markers in urine samples from prostate cancer adenoma patients. Taken together, our results show that the isolation of uEVs is feasible from small volumes of urine and avoiding ultracentrifugation, making easier the analysis in a clinical facility. However, caution should be taken in the selection of the enrichment method since they have a differential affinity for protein uEVs markers and by extension for different subpopulation of EVs.
To access the supplementary material to this article, please see Supplementary files under ‘Article Tools’.
Urine is an ideal source of biomarkers, particularly for diseases of the genitourinary system because the samples can be conveniently collected without risk to the patient. Apart from soluble proteins and cell debris, urine samples contain urinary extracellular vesicles (uEVs) (Citation1, Citation2), whose cargo includes lipids, proteins, DNA, mRNA and microRNA. Unlike tissue biopsy, an invasive and expensive procedure that allows only a partial sampling of an organ, uEVs provide a full representation of the entire urinary system (Citation3). Indeed, the analysis of uEVs has revealed markers from different tissues, from the kidney to collecting ducts (Citation4). For this reason, the study of uEVs is attractive in the field of biomarker discovery, and different markers have been proposed for numerous diseases (Citation5, Citation6). However, both the variety and technical complexity of some of the proposed methods make the translation into clinical practice difficult (Citation7). Although there are a growing number of commercial solutions, they add a new variable to the equation; the results often differ from those obtained using traditional isolation techniques (Citation7, Citation8).
The uEVs comprise vesicles released not only from different tissues but also from different cellular compartments. These are mainly exosomes, microvesicles and apoptotic bodies. Their characteristics differ, but no consensus on marker classification has been reached (Citation9, Citation10). Exosomes are 30–150 nm diameter vesicles originating in the endocytic pathway; they accumulate in the cell in the large multivesicular bodies (Citation11, Citation12). Microvesicles, also called ectosomes, are on average larger (100–1,000 nm) and are formed by the direct budding from the plasma membrane (Citation13). Moreover, the different subcellular origins of extracellular vesicles (EVs) determine their specific functions and cargos (Citation14), including variations in their proteins and nucleic acids (Citation15). The origin of the vesicles might be overlooked in the initial steps of the biomarker discovery; the main aim is usually the analysis of as many types of vesicles as possible, keeping in mind that the clinical samples are difficult to obtain.
In this study, we compared 5 techniques: 3 methods using commercial kits, a simplified version of the traditional ultracentrifugation and a lectin-based purification (exploiting affinity for glycosylated proteins usually enriched on the surface of uEVs) (Citation16, Citation17). We compared the recovery of the protein markers associated with uEVs and RNAs associated with these vesicles, using each of the methods to analyse samples obtained from healthy controls. The most efficient and reproducible method was then evaluated in a prostate cancer clinical setting.
Materials and methods
Human samples
The study was approved by the Basque Ethical Committee for Clinical Research (CEIC code 11-12 and 14-14). Samples from 10 healthy volunteers were obtained from the first urine of the morning. An aliquot from each donor was used to determine 13 physicochemical parameters, using reactive strips (Urispec Plus, Henry-Schein, Inc.; Supplementary Fig. 1). Moreover, samples from 28 patients cited for exploratory prostate biopsy were collected. In all cases, the samples were obtained by spontaneous micturition. The donors signed the informed consent form before enrolling. All urine samples were centrifuged at 2,000g for 10 min, filtered through a 0.22-µm pore membrane and immediately frozen at −80°C. Nineteen samples were classified as prostate cancer adenoma (PCA) and 9 as benign prostate hyperplasia (BPH). The diagnosis was based on the results of histological examination performed by a pathologist at the urology clinic of Basurto University Hospital (for details, see Supplementary Table I).
uEV-enrichment methods
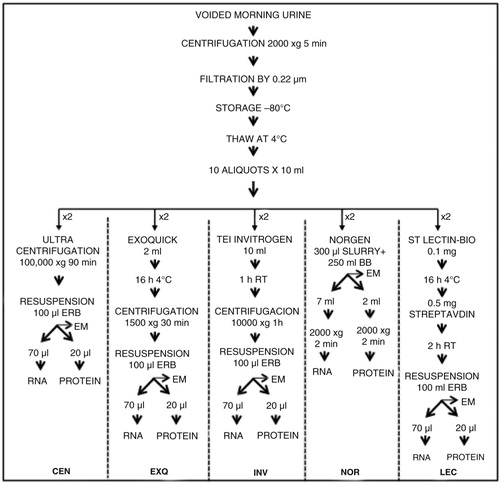
To compare different uEV-enrichment methods, urine samples from 10 healthy donors were collected and analysed independently. A volume of 100 ml of a urine sample from each donor was thawed and vortexed. Afterwards, each sample was split into 10 aliquots of 10 ml each, to perform 5 protocols (each in duplicate). illustrates the main steps of each technique. Ultracentrifugation was carried out in a single step, using a Beckman-Coulter 70Ti rotor. The extraction with ExoQuick-TC Exosome Precipitation Solution (System Biosciences) was performed according to manufacturer's instructions, as was the extraction with Total Exosome Isolation solution (Invitrogen, Life Technologies). To obtain a sample for Western blot analysis, certain modifications were introduced to the protocol for Urine Exosome RNA Isolation Kit (Norgen Biotek Corp.). Once urine was mixed with the slurry component, we divided each 10 ml aliquot into 3 aliquots as shown in . For the extraction of RNA, we used 7 ml of the mix and the final volume used for elution was 35 µl. A second aliquot of 2 ml was centrifuged, and the pellet was mixed with 40 µl of 1×NuPAGE LDS Sample Buffer (Thermo Fisher Scientific). The remaining 1 ml was employed for electron microscopy. The last isolation method involves the extraction with biotinylated Solanum tuberosum (potato) lectin (STL) (Vector Laboratories), and it was performed as described previously (Citation16). Briefly, the pH of each urine sample was adjusted to 7.5 with NaOH, and the sample was incubated overnight at 4°C with 0.1 mg of biotinylated STL. The lectins were recovered by adding 0.5 mg of streptavidin-coupled Dynabeads (Invitrogen) and incubated for 1 h at room temperature. Magnetic beads were recovered with a magnet after washing them twice in PBS. The procedures that required 12-h incubation were started immediately after thawing the sample and completed at the same time as the handling of the samples not requiring incubation. Each method was assigned an abbreviation: CEN for ultracentrifugation, NOR for Norgen, INV for Total Exosome Isolation Solution, EXQ for Exoquick-TC and LEC for STL purification.
Fig. 1. Experimental design for comparing 5 uEVs enrichment methods. Two 10-ml aliquots of urine from 10 healthy individuals were used to test each of the 5 methods (overall, 100 samples were processed). The final pellet obtained in each case was suspended in 100 µl of Exosome Resuspension Buffer (ERB, Life Technologies) and then divided for RNA, protein and EM analysis at the ratio of 70:20:10. The same ratio was used for NOR extraction, before proceeding to the first centrifugation (see Materials and Methods section for more details).
RNA and protein extraction
Norgen-based procedure was performed as described in the previous section. During the remaining 4 procedures, after last centrifugation or magnetic bead recovery, each sample was suspended in 100 µl of exosome resuspension buffer (ERB) from the Total Exosome RNA and Protein Isolation Kit (Invitrogen). A 70-µl aliquot of the suspension was used for RNA extraction according to the manufacturer's protocol, with a final elution volume of 35 µl. After extractions, 1 µl of RNA was analysed using RNA Pico Chips in a Bioanalyzer (Agilent Technologies). For protein analysis, 20 µl of ERB suspension was mixed with 20 µl of 2× loading buffer and incubated for 10 min at 37°C, 10 min at 60°C and 5 min at 95°C. The mixture was then centrifuged at 10,000g. The remaining 10 µl of ERB-suspended material was preserved for electron microscopy analysis.
Western blot analysis
An aliquot of 20 µl of each protein preparation described above was loaded and separated under non-reducing conditions in 4–12% precasted gels (Life Technologies, Inc.). It represents approximately a 10% of the total uEVs resuspended in ERB. For Coomassie protein staining, the gel was fixed in a solution of 30% acetic acid and 10% methanol in water. The gel was stained with SimplyBlue Safe Stain reagent (Invitrogen) and unstained with water according to manufacturer's instructions. For Western blot analysis, the proteins were transferred to nitrocellulose membranes and blocked for 1 h (in 5% milk and 0.05% Tween-20 in PBS). Then, the primary antibody was added and incubated for 12 h, followed by PBS wash and the application of secondary HRP-conjugated antibody. The primary antibodies used in this study were Mo αAIP1 (clone 49) and Mo αFLT1 (clone 18) from BD Biosciences, Mo αTSG101 (clone 4A10) and Rb αCD26 from Abcam (Cambridge, UK), Mo αCD63 (clone H5C6) from Developmental Studies Hybridoma Bank (Iowa, IA), Mo αCD10 (clone F4) and Rb αTHP (H-135) from Santa Cruz Biotechnology, Inc., Mo αCD9 (clone 209306) from R&D Systems and Rb αAQP2 from Sigma–Aldrich. HRP-conjugated antimouse and antirabbit antibodies were purchased from Jackson ImmunoResearch, Inc. Chemiluminescence detection of bands was performed using Clarity Western ECL kit (Bio-Rad). For a relative quantification of proteins, scanned films were quantified by measuring the optical density and processed using the ImageJ 1.48 software (National Institute of Health, USA, www.imagej.nih.gov/ij/index.html). Briefly, the scanned images were converted to 8-bit pictures and calibrated using Uncalibrated OD function. Then, a fixed selection area was used to measure the mean intensity of each band, and the mean intensity of the background (to be later subtracted). Absolute values of duplicates were averaged and used in further calculations as described in each figure legend and in the Statistical Analysis section.
Reverse transcriptase and qPCR
For each sample and extraction method, cDNA was synthesised from 10 µl of RNA using Superscript III (Invitrogen), following the manufacturer's recommendations, in a reaction volume of 20 µl. Primers for TaqMan reactions were designed using the Universal ProbeLibrary Assay Design Center (www.lifescience.roche.com). The list of primers and probes is given in Supplementary Table II. To amplify targeted fragments and perform the relative quantification of transcripts, TaqMan PCR was conducted in duplicate using TaqMan® Fast Advanced Master Mix (Life Technologies). Each reaction contained 0.5 µl of cDNA in a total reaction volume of 6 µl. Ct values of duplicates were averaged and used in further calculations as described in each figure legend and in the Statistical Analysis Section.
Electron microscopy
For cryoelectron microscopy, preparations were directly adsorbed onto glow-discharging holey carbon 200-mesh copper grids (Quantifoil Micro Tools GmbH). Grids were blotted at 95% humidity and rapidly plunged into liquid ethane with the aid of a Vitrobot (Maastricht Instruments BV). Vitrified samples were imaged at liquid nitrogen temperature using a JEM-2200FS/CR transmission cryoelectron microscope (JEOL) equipped with a field emission gun and operated at an acceleration voltage of 200 kV.
Statistical analysis
Correlation matrices and associated p-values were obtained using cor function and plotted using corrplot package of R v3.1.0 programme (2014-04-10). P-values lower than 0.05 were considered significant. Specifically, we assessed each correlation as follows: In , we correlated the Ct values for each gene and sample (n=10).A value of 45 was assigned to non-detected genes to avoid the loss of data. In , we present, for each group of patients (PCA=18, BPH=9), the correlation between the values obtained by the densitometry analysis of the Western blotting for the different proteins in each sample. In Supplementary Fig. 4, we correlate the values obtained by the densitometry analysis of the Western blotting for the different proteins in each sample. We conducted a separate correlation analysis for each isolation method (n=10). In Supplementary Fig. 8b, we correlated the Ct values obtained by qPCR for the different gene transcripts within each sample. We prepared a correlation matrix for each group of patients (PCA=18, BPH=9). The data values for each correlation matrix are provided in Supplementary Tables as indicated in the legend of each figure.
Results
Initial characterisation
In this study, we applied 5 different methodologies to analyse uEVs present in urine samples (): Ultracentrifugation (CEN), Exoquick (EXQ), Invitrogen (INV), Norgen (NOR) and Lectin (LEC). We analysed the preparations using cryoelectron microscopy; we observed the vesicles only in the CEN, INV and LEC preparations (details of uEVs in Supplementary Fig. 2a, and images at lower magnification for each isolation method in Supplementary Fig. 2b); the NOR procedure uses a resin that, in our conditions, is not compatible with cryo-EM analysis. We also analysed the RNA isolated by each method. The Bioanalyzer analysis (Supplementary Fig. 2c) profiles showed the presence of mostly small RNA in all cases. NOR method yielded the highest amount of RNA, with an average of 2.7 ng per ml of urine, followed by CEN and INV methods, each with an average of 0.5 ng per ml of urine. LEC and EXQ procedures had the lowest yields, with an average of 0.2 ng per ml of urine.
Protein characterisation
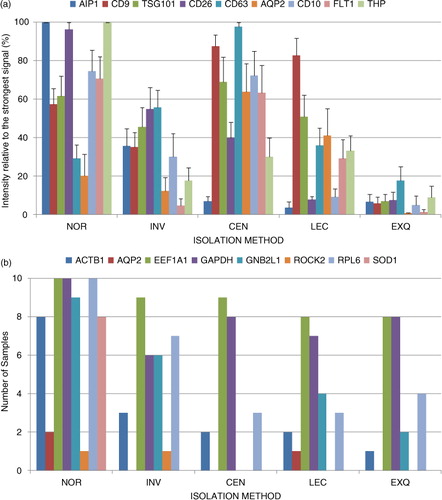
Next, we evaluated several EV protein markers including CD9, CD10, CD63, TSG101, CD10, AIP1/Alix, AQP2 and FLT1. In , we show the WB analysis of these proteins in 2 independent biological samples (each of them in duplicated) isolated by using the 5 different methods. We found that the different methods yielded different amounts of these EV protein markers. We also noted that the electrophoretic protein mobilities obtained using INV methodology differed slightly from the protein mobilities observed for the other methods (). In addition, we observed clear differences between individuals, in accord with the interindividual variability shown in several studies of EVs in human biofluids. For instance, sample M3 had weaker AIP1 and CD9 bands but stronger CD10, AQP2 and CD26 bands than sample F3. To obtain quantitative data, densitometry and background subtraction for the Western blotting bands of the 10 independent samples were performed (see values in Supplementary Table III). The absolute values were transformed into relative values by referring to the highest value obtained for each protein and for each sample (a). For instance, NOR methodology gives a value of 100% for AIP1 in the samples shown in . For CD63, the 100% value was given to the levels obtained using CEN methodology. a shows the average of the quantitative results for all samples. It was clear that NOR method resulted in a mixture enriched in AIP1 and CD26 but with lower levels of AQP2 and CD63. CEN sediments vesicles enriched in CD63, CD9 and AQP2, with lower levels of vesicles containing AIP1 (a). Both methods (NOR and CEN) isolated a mixture containing CD10 and FLT1, with similar efficiency. LEC-based method seemed to be very specific for CD9-positive vesicles and had the lowest efficiency for the isolation of AIP1 and CD26-containing vesicles (a). In contrast, INV-based methodology had high efficiency for obtaining CD26 and CD63 proteins (a). Remarkably, under the conditions used, EXQ method was the least efficient for most of the uEV protein markers (CD63 was detected at a relatively high level, a). To discard for the presence of uEVs markers as soluble proteins, we performed Western blot analysis loading NOR and CEN methodologies along with 15 µl of urine sample directly (Supplementary Fig. 3). The results showed that no detection was observed in urine sample loaded directly and uEVs protein markers were only detected when the isolation procedures were performed.
Fig. 2. Western blot analysis of 2 representative independent biological samples. uEVs were enriched using indicated methodologies, in duplicate. uEV-enriched preparations were analysed by Western blot using antibodies against indicated proteins. Molecular weights are shown.
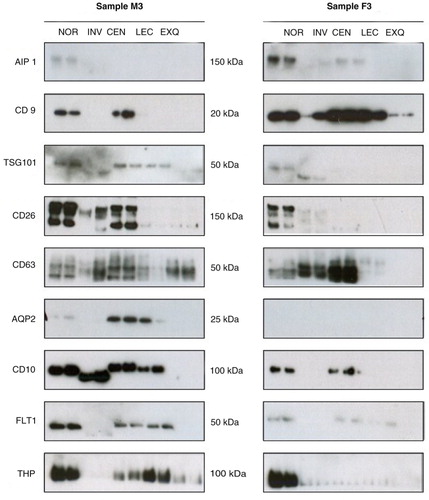
Fig. 3. Analysis of the uEV-enrichment performance of the tested methods. (a) Average of the relative quantification for each protein and method (n = 10). Optical densitometry values were determined using ImageJ software, and the quantities were relative to the strongest band for each protein and sample. (b) Number of samples in which the indicated gene transcript was detected for each of the methods (n = 10).
We examined the groups of proteins isolated together, identifying subpopulation markers for each method. To establish associations between proteins, we calculated the correlation between the absolute intensities obtained by WB densitometry for each sample and each method (Supplementary Fig. 4, and Supplementary Table IV). A positive correlation between uEV markers CD9 and TSG101 was found for NOR, INV and CEN methods. This result indicates that these methods could isolate subpopulations of vesicles that harbour both markers. A significant association between CD9 and CD63 was observed for NOR and INV methods. However, even though CEN had the best efficiency for isolation of CD63-positive vesicles, the correlation between CD9 and CD63 levels for this method was low. In contrast, LEC methodology performed better in pulling down CD9-positive vesicles; no correlation between CD63 and CD9 was observed for this technique (Supplementary Fig. 4). These results suggest that there are subpopulations of uEVs containing CD9 and CD63 proteins and subpopulations containing only one of the 2 markers. Interestingly, these different subpopulations can be discriminated by using different enrichment procedures. Another association was found for CD10 and FLT1; the results of NOR, CEN, LEC and EXQ methods suggested the presence of these 2 proteins in the same subpopulation of uEVs. Remarkably, EXQ-based procedure showed high correlation coefficients between most markers. This result suggested that EXQ method could retrieve a homogeneous population of protein markers; however, it had low efficiency. Overall, these results demonstrated that different methodologies rendered material enriched in distinct EV protein markers and by extension suggesting that each method could enrich in different subpopulations of EVs.
Next, we asked the question whether any of the directly measured physical parameters of the urine samples could predict the uEV isolation performance. By averaging the values obtained for all the proteins for each method and sample, we examined the links between the physicochemical characteristics of the urine samples and the performance of each method (Supplementary Table V). Among the 13 properties directly measured using specific strips, pH, density and presence/absence of ascorbic acid were the only properties that varied between the tested urine samples. These properties were then used in the correlation analysis. However, no significant correlation was found between any of the physical parameters and the uEV isolation performance. We only observed a trend for CEN isolation method, showing better performance for urine samples with higher density (Supplementary Fig. 5a). The small number of samples does not allow us to draw more detailed conclusions.
Gene characterisation
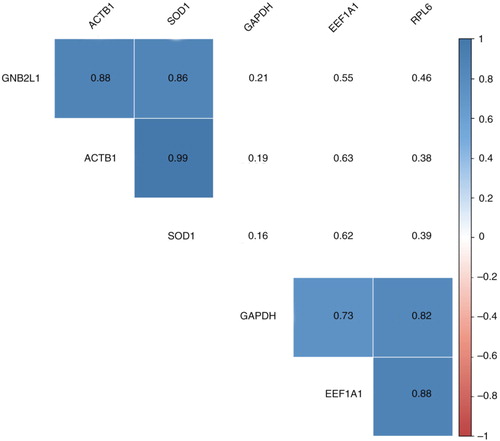
We selected a panel of gene targets (Supplementary Table II) among the transcripts previously detected in uEVs (Citation18), including EEF1A1, RPL6, SOD1 and ROCK2. We included 2 genes commonly employed as housekeeping genes in cells, GAPDH and ACTB1 (also reported in EVs (Citation9)), and the gene coding for GNB2L that is found at high levels in EVs (Citation19). The gene coding for AQP2, described in uEVs secreted by cells associated with urinary collecting ducts (Citation4), was also included in the analysis. We looked for these 8 transcripts in the uEV preparations obtained using the 5 methods (). Only EEF1A1 and GAPDH were detected in almost all samples analysed, while ROCK2 and AQP2 were detected very seldom (b and Supplementary Table VI). However, the NOR technique clearly performed better than the other methods, detecting 6 transcripts in at least 8 of the 10 samples tested (b). This high performance of the NOR method allowed us to analyse the correlations between the gene transcripts, to identify those that could coprecipitate. A significant association was observed between the transcripts ACTB1, SOD1 and GNB2L1 and between GAPDH, EEF1A1 and RPL6 (, and Supplementary Table VII). On the basis of these relationships, we might speculate that each of these sets of transcripts come from a different source, and NOR technique can isolate both subgroups. The other methods did not precipitate the vesicles containing ACTB1, SOD1 and GNB2L1; none of these 3 transcripts was efficiently detected using those methods. Remarkably, NOR purification efficiently depletes those transcripts from urine samples (Supplementary Fig. 6 and Supplementary Table VIII).
Fig. 4. Gene correlation analysis. A correlation matrix was obtained using Ct values for each gene and sample. A value of 45 was assigned to non-detected genes to avoid the loss of data. The numbers correspond to r coefficients, and only significant values (p < 0.05) are coloured using a proportional colour r-scale (n = 10). The values employed to generate the correlation matrix can be found in Supplementary Table VII.
We further analysed the effect of the analytical parameters of urine samples on the RNA isolation performance (Supplementary Table IX). We observed that the performance of the Norgen-based method in the isolation of vesicles containing RPL6/GAPDH/EEF1A1 was inversely proportional to the urine density, although the results were not statistically significant (Supplementary Fig. 5b). However, it is important to keep in mind that other factors, such as sex, may affect this correlation; urine from men was denser in our set of samples.
Analysis of samples obtained from prostate-condition patients
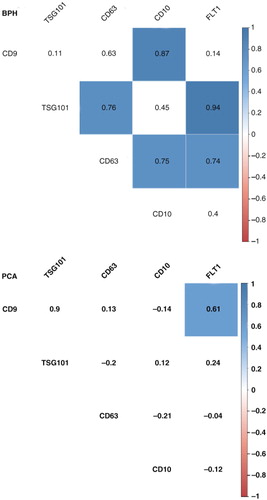
Based on our results, we decided to perform the NOR procedure using a set of clinical samples from patients suffering from BPH or PCA. We conducted the protein and gene analyses similar to those described above. A representative panel of the Western blot analysis is shown in . Densitometry analysis of the protein bands showed no significant differences between the 2 groups, although FLOT1 reaches almost significance level (p=0.07; Supplementary Fig. 7 and Supplementary Table X). We observed a remarkably high heterogeneity of the individual samples. Interestingly, the correlation analysis showed some differences between uEV-enriched preparations from BPH and PCA samples ( and Supplementary Table XI). In BPH samples, the correlation between the proteins CD63 and TSG101 was 0.76 (), similar to the correlation value obtained for samples from healthy individuals (Supplementary Fig. 4). This correlation was not observed in PCA samples () suggesting a change in the cargo of CD63-containing vesicles in PCA patients.
Fig. 5. Western blot analysis of Norgen-enriched uEVs from BPH and PCA urine samples. NOR methodology was employed to enrich uEVs from urine samples of BPH and PCA patients as described in Materials and Method section. Indicated proteins were analysed using Western blotting. Molecular weights are indicated.
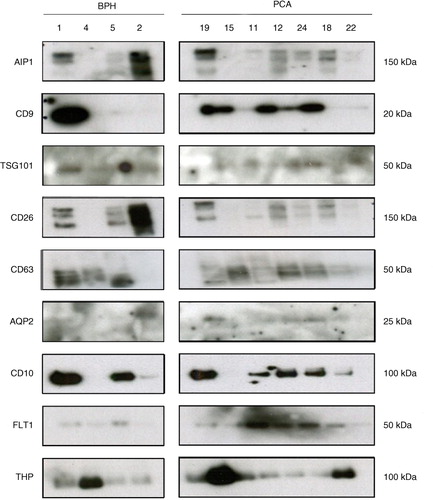
Fig. 6. Correlation analysis for uEV proteins from BPH and PCA patients. A correlation matrix was constructed using absolute densitometry values (background subtracted) for each protein. To avoid the loss of data, a value of 0 was given to non-detected proteins. The numbers correspond to r coefficients, and only significant values (p<0.05) are coloured using a proportional colour r-scale (for PCA, n=18 and for BPH, n=9). The values employed to generate the correlation matrix can be found in Supplementary Table XI.
Finally, we performed the analysis of the 8 selected genes, obtaining amplification profile similar to the profile for samples from healthy volunteers, for both BPH and PCA sufferers (Supplementary Fig. 8a and Supplementary Table XII). We did not see a significant difference between the profiles for BPH and PCA groups. The correlations between EEF1A1, GAPDH and RPL6, and between GNB2L1, ACTB1 and SOD1, found for the samples for healthy individuals, were observed here again (Supplementary Fig. 8b, and Supplementary Table XIII). This result reinforced the idea that these 2 sets of transcripts were loaded in different subpopulations of uEVs.
Discussion
Urinary EVs provide a source of metabolites, lipids, nucleic acids and proteins that can be used as biomarkers for a range of genitourinary pathologies. However, the number and variety of methods developed to improve the isolation of uEVs (Citation7, Citation20) (Citation21) reflect the technical difficulties in the translation of this research to routine diagnostics. We performed a comparative analysis of several uEV isolation methods, keeping in mind the clinical setting where the access to sophisticated equipment and storage facilities might be limited. The differences between the methods were not just on the level of efficacy. We observed qualitative differences between the types of vesicles obtained using different methods, judging by the varying levels of different EV protein markers ( and a) as well as by the differences observed by Coomassie blue-staining (Supplementary Fig. 9). We confirmed previous results showing that the CEN method yields CD9/CD63 vesicle populations. The poor performance of EXQ (Citation7) could be due to the filtration step and might be alleviated by a slight modification of the protocol, as has been suggested previously (Citation8). We found that commercial methods like NOR and INV were better at capturing the ectopeptidases CD10 and CD26, and the NOR method specifically captured the ESCRT component AIP1/Alix. The reason for this specificity remains unclear; this is the first work reporting protein analysis in uEVs obtained using Norgen-based methodology. Moreover, we observed correlations between the levels of some of the uEV markers, for example, CD9 and TSG101 or CD10 and FLT1. These correlations suggested that such groups of markers might originate from the same vesicle type. Such associations between different markers could be used to identify uEV subpopulations in urine samples. Furthermore, we observed associations not only between proteins but also between gene transcripts such as transcripts coding ACTB1/GNB2L1/SOD1 or GADPDH/RPL6/EEF1A1, again indicating that we might be dealing with different subpopulations of EVs. Remarkably, while GAPDH/RPL6/EEF1A1 transcripts were detected using all the examined isolation methods, ACTB1/GNB2L1/SOD1 transcripts were found preferentially using the Norgen-based method. Our results show that NOR technique yields a larger amount of RNA than the other methods. Since this technique does not allow EV visualisation, it is difficult to ascertain whether NOR yields a larger number of EVs or more RNA–protein complexes. Either of these mechanisms would result in the observed increase in ACTB1/GNB2L1/SOD1 transcript levels and further investigation to clarify this is needed.
Given the high heterogeneity of individual urine samples, it is important to establish some criteria to group the samples to be further compared, to help in the detection of significant disease biomarkers in uEVs. We performed a pilot analysis examining the effect of individual physicochemical characteristics of urine sample on the uEVs isolation. We analysed 13 parameters and observed that the density of urine samples might be important for the isolation of uEV-containing EEF1A1/GAPDH/RPL6 gene transcripts using the Norgen-based methodology. These results are in agreement with previous reports showing that viscosity affects the nature of isolated uEVs (Citation22). Although the available data are still limited, it seems that analysing physicochemical properties of urine before the uEV-enrichment procedure could help in the quality control and supply the parameters for comparisons. Such preliminary analysis might increase the effectiveness of uEV-biomarker discovery studies.
Tamm–Horsfall protein (THP) is a typical contaminant in uEV preparations. Although there are some methods to remove it (Citation8, Citation23) (Citation24) before the vesicle isolation, we chose the easiest, most conservative approach of working with THP. Although a negative correlation between THP and the detection of uEV markers was found for some samples (), it was not a general observation (). Importantly, the lowest level of THP contamination was achieved using INV and EXQ methods. This result might be helpful in the analysis of samples with large amounts of THP protein.
Finally, we evaluated the performance of our Norgen-based approach using a set of clinical urine samples from 9 BPH patients and 19 PCA patients. There are some studies reporting differences between the urinary vesicles isolated from PCA patients and healthy individuals (Citation25–Citation28). Although not significant, we observed that the levels of FLT1 were higher in PCA than BHP samples what is in agreement with previously described (Citation26). In addition, our approach detected significant changes in the relationship between the protein markers CD63 and TSG101, altered in patients with PCA. A possible explanation of this result is that CD63-positive uEVs are loaded differently in PCA patients in comparison with BPH patients and healthy individuals. These results showed that the Norgen-based approach could be useful in the analysis of EV protein markers in a clinical setting.
In conclusion, this pilot work showed the highly complex results of the analysis of uEVs seen from the clinical point of view. We compared several available clinically “friendly” methods suitable for uEV isolation. We showed that, depending on the method, we could obtain preparations enriched in different EV protein markers. Different methods yielded subpopulations with different protein and RNA contents. Our study highlights the benefits of establishing quality control parameters before commencing uEV-enrichment procedures. We suggest that the methodologies should be standardised for clinical-setting applications.
Conflict of interest and funding
The authors have not received any funding or benefits from industry or elsewhere to conduct this study.
Supplementary Figures
Download PDF (1.9 MB)Supplementary Table S1
Download MS Excel (10.3 KB)Supplementary Table S2
Download MS Excel (10.1 KB)Supplementary Table S3
Download MS Excel (14.1 KB)Supplementary Table S4
Download MS Excel (13.4 KB)Supplementary Table S5
Download MS Excel (11.6 KB)Supplementary Table S6
Download MS Excel (14 KB)Supplementary Table S7
Download MS Excel (11.8 KB)Supplementary Table S8
Download MS Excel (10.3 KB)Supplementary Table S9
Download MS Excel (11.9 KB)Supplementary Table S10
Download MS Excel (12 KB)Supplementary Table S11
Download MS Excel (12.4 KB)Supplementary Table S12
Download MS Excel (12.7 KB)Supplementary Table S13
Download MS Excel (13.2 KB)Acknowledgements
We thank David Gil of the CIC bioGUNE electron microscopy platform for his technical assistance in the cryo-EM analysis. We are thankful to the Basque Biobank for Research (BIOEF) funded by ISCIII (PT13/0010/0052) for the acquisition, maintenance and distribution of urine samples, and to the patients enrolled in this study. The work was supported by ISCIII (PI12/01604), ISCIII (PI10/01484, PI13/00031), GV Health (2012111086) and Education (PI2012-03), Marie Curie (277043), ERC (336343) and the Movember Foundation (GAP1). Centro de Investigación Biomédica en Red en el Área temática de Enfermedades Hepáticas y Digestivas (CIBERehd) is funded by the Spanish ISCIII-MICINN.
Notes
To access the supplementary material to this article, please see Supplementary files under ‘Article Tools’.
Related Research Data
References
- Hoorn EJ, Pisitkun T, Zietse R, Gross P, Frokiaer J, Wang NS, etal. Prospects for urinary proteomics: exosomes as a source of urinary biomarkers. Nephrology. 2005; 10: 283–90.
- Pisitkun T, Shen RF, Knepper MA. Identification and proteomic profiling of exosomes in human urine. Proc Natl Acad Sci USA. 2004; 101: 13368–73.
- Pisitkun T, Johnstone R, Knepper MA. Discovery of urinary biomarkers. Mol Cell Proteomics. 2006; 5: 1760–71.
- Miranda KC, Bond DT, McKee M, Skog J, Paunescu TG, Da Silva N, etal. Nucleic acids within urinary exosomes/microvesicles are potential biomarkers for renal disease. Kidney Int. 2010; 78: 191–9.
- Gamez-Valero A, Lozano-Ramos SI, Bancu I, Lauzurica-Valdemoros R, Borras FE. Urinary extracellular vesicles as source of biomarkers in kidney diseases. Front Immunol. 2015; 6: 6.
- Gonzalez E, Falcon-Perez JM. Cell-derived extracellular vesicles as a platform to identify low-invasive disease biomarkers. Expert Rev Mol Diagn. 2015; 15: 907–23.
- Saenz-Cuesta M, Arbelaiz A, Oregi A, Irizar H, Osorio-Querejeta I, Munoz-Culla M, etal. Methods for extracellular vesicles isolation in a hospital setting. Front Immunol. 2015; 6: 50. [PubMed Abstract] [PubMed CentralFull Text].
- Alvarez ML, Khosroheidari M, Kanchi Ravi R, DiStefano JK. Comparison of protein, microRNA, and mRNA yields using different methods of urinary exosome isolation for the discovery of kidney disease biomarkers. Kidney Int. 2012; 82: 1024–32.
- Kalra H, Simpson RJ, Ji H, Aikawa E, Altevogt P, Askenase P, etal. Vesiclepedia: a compendium for extracellular vesicles with continuous community annotation. PLoS Biol. 2012; 10: e1001450.
- Gyorgy B, Szabo TG, Pasztoi M, Pal Z, Misjak P, Aradi B, etal. Membrane vesicles, current state-of-the-art: emerging role of extracellular vesicles. Cell Mol Life Sci. 2011; 68: 2667–88.
- Mathivanan S, Ji H, Simpson RJ. Exosomes: extracellular organelles important in intercellular communication. J Proteomics. 2010; 73: 1907–20.
- Kowal J, Tkach M, Thery C. Biogenesis and secretion of exosomes. Curr Opin Cell Biol. 2014; 29: 116–25.
- Ohno S, Ishikawa A, Kuroda M. Roles of exosomes and microvesicles in disease pathogenesis. Adv Drug Deliv Rev. 2013; 65: 398–401.
- Raposo G, Stoorvogel W. Extracellular vesicles: exosomes, microvesicles, and friends. J Cell Biol Genet. 2013; 200: 373–83.
- Crescitelli R, Lasser C, Szabo TG, Kittel A, Eldh M, Dianzani I, etal. Distinct RNA profiles in subpopulations of extracellular vesicles: apoptotic bodies, microvesicles and exosomes. J Extracell Vesicles. 2013; 2: 20677. http://dx.doi.org/10.3402/jev.v2i0.20677.
- Echevarria J, Royo F, Pazos R, Salazar L, Falcon-Perez JM, Reichardt NC. Microarray-based identification of lectins for the purification of human urinary extracellular vesicles directly from urine samples. Chem Bio Chem. 2014; 15: 1621–6.
- Gerlach JQ, Kruger A, Gallogly S, Hanley SA, Hogan MC, Ward CJ, etal. Surface glycosylation profiles of urine extracellular vesicles. PLoS One. 2013; 8: e74801.
- Perez A, Loizaga A, Arceo R, Lacasa I, Rabade A, Zorroza K, etal. A pilot study on the potential of RNA-associated to urinary vesicles as a suitable non-invasive source for diagnostic purposes in bladder cancer. Cancers. 2014; 6: 179–92.
- Royo F, Falcon-Perez JM. Liver extracellular vesicles in health and disease. J Extracell Vesicles. 2012; 1: 18825. http://dx.doi.org/10.3402/jev.v1i0.18825.
- Musante L, Tataruch D, Gu D, Benito-Martin A, Calzaferri G, Aherne S, etal. A simplified method to recover urinary vesicles for clinical applications, and sample banking. Sci Rep. 2014; 4: 7532.
- Cheruvanky A, Zhou H, Pisitkun T, Kopp JB, Knepper MA, Yuen PS, etal. Rapid isolation of urinary exosomal biomarkers using a nanomembrane ultrafiltration concentrator. Am J Physiol Renal Physiol. 2007; 292: F1657–61.
- Momen-Heravi F, Balaj L, Alian S, Trachtenberg AJ, Hochberg FH, Skog J, etal. Impact of biofluid viscosity on size and sedimentation efficiency of the isolated microvesicles. Front Physiol. 2012; 3: 162. [PubMed Abstract] [PubMed CentralFull Text].
- Musante L, Saraswat M, Duriez E, Byrne B, Ravida A, Domon B, etal. Biochemical and physical characterisation of urinary nanovesicles following CHAPS treatment. PLoS One. 2012; 7: e37279.
- Kosanovic M, Jankovic M. Isolation of urinary extracellular vesicles from Tamm-Horsfall protein-depleted urine and their application in the development of a lectin-exosome-binding assay. Biotechniques. 2014; 57: 143–9. [PubMed Abstract].
- Duijvesz D, Versluis CY, van der Fels CA, Vredenbregt-van den Berg MS, Leivo J, Peltola MT, etal. Immuno-based detection of extracellular vesicles in urine as diagnostic marker for prostate cancer. Int J Cancer. 2015; 137: 2869–78.
- Overbye A, Skotland T, Koehler C, Thiede B, Seierstad T, Berge V, etal. Identification of prostate cancer biomarkers in urinary exosomes. Oncotarget. 2015; 6: 30357–76. [PubMed Abstract].
- Isin M, Uysaler E, Ozgur E, Koseoglu H, Sanli O, Yucel OB, etal. Exosomal lncRNA-p21 levels may help to distinguish prostate cancer from benign disease. Front Genet. 2015; 6: 168. [PubMed Abstract] [PubMed CentralFull Text].
- Nilsson J, Skog J, Nordstrand A, Baranov V, Mincheva-Nilsson L, Breakefield XO, etal. Prostate cancer-derived urine exosomes: a novel approach to biomarkers for prostate cancer. Br J Cancer. 2009; 100: 1603–7.