
Abstract
Non-invasive tests to identify age and early disease-associated pathology within the kidney are needed. Specific populations of urinary extracellular vesicles (EVs) could potentially be used for such a diagnostic test. Random urine samples were obtained from age- and sex-stratified living kidney donors before kidney donation. A biopsy of the donor kidney was obtained at the time of transplantation to identify nephron hypertrophy (larger glomerular volume, cortex per glomerulus and mean profile tubular area) and nephrosclerosis (% fibrosis, % glomerulosclerosis and arteriosclerosis). Renal parenchymal-derived EVs in cell-free urine were quantified by digital flow cytometry. The relationship between these EV populations and structural pathology on the kidney biopsy was assessed. Clinical characteristics of the kidney donors (n=138, age range: 20–70 years, 50% women) were within the normative range. Overall, urine from women contained more EVs than that from men. The number of exosomes, juxtaglomerular cells and podocyte marker–positive EVs decreased (p<0.05) with increasing age. There were fewer total EVs as well as EVs positive for mesangial cell, parietal cell, descending limb of Henle's loop (simple squamous epithelium), collecting tubule-intercalated cell and monocyte chemoattractant protein-1 markers (p<0.05) in persons with nephron hypertrophy. The number of EVs positive for intercellular adhesion molecule-1, juxtaglomerular cell, podocyte, parietal cell, proximal tubular epithelial cell, distal tubular epithelial cell and collecting duct cells were fewer (p<0.05) in persons with nephrosclerosis. EVs carrying markers of cells from the renal pelvis epithelium did not associate with any indices of nephron hypertrophy or nephrosclerosis. Therefore, specific populations of EVs derived from cells of the glomerulus and nephron associate with underlying kidney structural changes. Further validation of these findings in other cohorts is needed to determine their clinical utility.
With aging the kidney undergoes structural and functional changes characterized by decreases in renal mass, number of functional nephrons, glomerular filtration rate (GFR), and increases in renal fat, fibrosis and nephrosclerosis (Citation1, Citation2). These age-associated changes are similar to those seen in early chronic kidney disease. Detection of macro- and micro-structural changes that reflect kidney senescence is difficult without a kidney biopsy. Age-associated macro-anatomical structural changes include smaller cortical volume, larger medullary volume (Citation3), increased renal surface roughness (Citation4) and larger and more numerous renal cysts (Citation5). The micro-anatomical changes include a decreased number of functional glomeruli and nephrons, increased nephrosclerosis as indicated by glomerulosclerosis, arteriosclerosis, tubular atrophy, interstitial fibrosis and hypertrophy of the remaining nephrons (Citation2). These age-related changes occur separately from those induced by specific renal disease processes but are often difficult to distinguish, especially if they occur simultaneously. Normal kidney senescence that occurs in tandem with age-dependent renal diseases may accelerate the rate of functional decline and predispose patients to acute kidney injury (Citation6). Because of this, tests are necessary to identify renal cellular pathophysiological processes or mechanisms that underlay age-associated structural changes before the appearance of overt decline in renal function.
Activated cells involved in pathophysiological processes shed 2 major populations of biologically active extracellular vesicles (EVs) into body fluids including urine: exosomes that are ~30–120 nm and originate from multivesicular bodies and microvesicles (MV) that are ~40–1000 nm and arise from the plasma membrane. These EVs remove and exchange excess and unwanted bioactive molecules including RNAs and proteins from renal cells (Citation7, Citation8) and are involved in numerous pathophysiological processes (Citation7, Citation9) (Citation10). Release of vesicles from cells along the nephron may serve as a method of intercellular communication, so a disruption in this signalling could be a useful indicator of cellular damage (Citation11). However, a detailed profile of renal cellular injury, or markers of specific cellular activation, is yet to be developed. If established, this profile could elucidate potential mechanisms for age-associated structural changes without the need for a kidney biopsy, since studies suggest that renal cell-derived vesicles in urine can identify early and late pathophysiological processes (Citation12–Citation14). The concentration and content of bioactive molecules (RNAs, proteins and metabolites) in urinary EVs depends upon their cell of origin and the stimuli that trigger their production. Thus, the absolute and relative population of EVs and their content of bioactive molecules may reflect early or late pathophysiological process within the kidney. The present study was designed to assess whether cell-specific populations of urinary EVs from adult kidney donors with normal kidney function correlate with underlying renal structural features.
Methods
Antibodies, chemicals and reagents
We obtained fluorophores conjugated recombinant proteins/antibodies that were specific to renal cells present in glomerulus and different segments of nephron and to the renal pelvis (Citation10). Recombinant annexin-V and mouse anti-human CD9, CD24, CD54, CD63, CD81 and CD106 antibodies conjugated with fluorescein isothiocyanate (FITC) or R-phycoerythrin (PE), and TruCOUNT™(4.2 µm) beads were purchased from BD Biosciences, San Jose, CA, USA. FITC-conjugated mouse anti-human tissue factor was purchased from American Diagnostica Inc., Stamford, CT, USA. FITC-conjugated rabbit anti-nephrin, anti-aquaporin-1 and anti-aquaporin-2 antibodies were purchased from Biorbyt, Cambridge, United Kingdom. Rabbit anti-NPHS/Podocin, anti-claudin-1, anti-cytokeratin 8, anti-LRP (low-density lipoprotein-related protein 2)/megalin, anti-OAT4L/URAT1, anti-SLC12A3/NKCC (Na-K-Cl co-transporters), anti-prominin 2, anti-ATPVOD2/V-ATPase (vacuolar-type H+- ATPase), anti-cytokeratin 19 and anti-cytokeratin 20 antibodies conjugated with FITC or PE were purchased from Bioss, Boston, MA, USA. PE-conjugated mouse anti-human EGFR (epidermal growth factor receptor) and anti-human monocyte chemotactic protein-1 (MCP-1) antibodies were purchased from BioLegend Inc., San Diego, CA, USA. FITC-conjugated mouse anti-human uromodulin was purchased from LSBio LifeSpan BioSciences, Inc., Seattle, WA, USA. HEPES [4-(2-hydroxyethyl)-1-piperazineethanesulfonic acid], and Hanks’ balanced salts were purchased from Sigma Chemicals Co., St. Louis, MO, USA.
Study participants
This study was approved by the Institutional Review Board at Mayo Clinic, Rochester, MN, USA. All participants gave written informed consent. The study participants were living kidney donors who participated in the Mayo Clinic Aging Kidney Anatomy study and had undergone an intraoperative core-needle biopsy of their donated kidney during the transplant surgery at Mayo Clinic. All kidney donors had a thorough medical evaluation including a range of tests to assess kidney function and risk of kidney disease (Citation2, Citation3) (Citation15, Citation16). Donor characteristics and medical history were obtained from pre-donation medical records. Female and male participants were age-matched to within 3 years of each other (total 138; n=69 women and 69 men) with ages ranging from 20 to 70 years.
Blood and urine biochemistry
All blood and urine clinical biochemistry measurements were performed in the Mayo Clinic Clinical Laboratories, using standard protocols. The serum creatinine based Chronic Kidney Disease Epidemiology Collaboration (CKD-EPI) equation was used to determine estimated glomerular filtration rate (eGFR) (Citation17).
Urine sample collection
The Mayo Clinic Transplant Serum and Tissue Bank provided frozen (−80°C) cell-free urine samples (obtained prior to kidney donation) to the Mayo Clinic Aging Kidney Anatomy study. Cell-free urine was prepared by low-speed centrifugation (3,400 rpm for 10 min) to remove cells and larger debris. Free-floating larger (micro) vesicles and smaller (exosome) vesicles and even urinary exosomes associated with Tamm-Horsfall protein (Citation18) were all retained. Our previous study demonstrated by electron microscopy that cell-free urine contain heterogeneous population of EVs and that up to 2–3 freeze–thaw cycles did not affect the concentration of EVs in cell-free urine measured by digital flow cytometry (Citation10).
Characterization and quantification of urinary EVs by flow cytometer
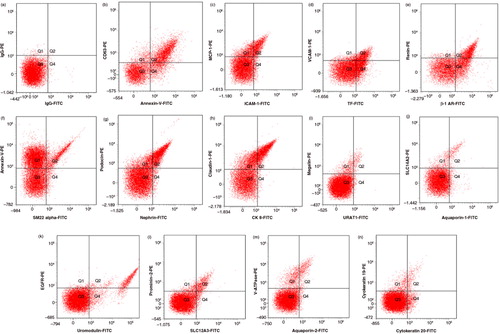
A published and validated method was used to characterize and quantify renal parenchymal-derived EVs in diluted cell-free urine (dilution based on minimum annexin-V positive EVs higher than 2,500 events) by digital flow (FACSCanto™) cytometry (Citation10). All reagents including antibodies were filtered twice through a 0.2-µm size membrane filter to eliminate chemical particles and to reduce instrument noise. Gates to define the size of EVs were set using an internal standard of 0.2 µm, 0.5 µm, 1 µm and 2 µm Fluoresbrite® microparticles. Samples were spiked with a known quantity of 4.2 µm diameter TruCOUNT™ beads for quantification. Acquisition gates for EVs with and without annexin-V or renal cell-specific monoclonal/polyclonal antibodies conjugated with fluorophore and settings of flow cytometer were similar to those previously described (Citation10). To optimize the concentration and flow rate of urinary EVs for flow cytometric analysis, cell-free urine samples (20 µl) diluted with 80 µl of filtered H/H (HEPES/Hanks') buffer pH 7.4 were incubated with 3 µl of annexin-V-fluorescein (FITC) for 30 min. After incubation, 800 µl of H/H buffer pH 7.4 plus 100 µL containing a defined quantity of TruCOUNT™ beads was added to each sample tube prior to analysis by flow cytometer. The flow rate (low, medium or high) was determined based on the threshold rate of events/second from the sample tube (Citation10). For example, the flow rate threshold events higher than 1,000 per second was reduced to maintain less than 1,000. Conversely, for samples with low threshold events (less than 100 events/second), the flow rate was increased to high. Gain settings of the flow cytometer were adjusted to place the TruCOUNT™ beads (4.2 µm) in the upper log for scatter. Unfiltered Isoton® II diluent from Beckman Coulter, Fullerton, CA was used in the cytometer. Compensation for channel spill was calculated using the auto-compensation feature from recorded values of separate and combined unstained and single antibody-stained urinary EVs. Auto-calculated compensation parameters were verified weekly. Urinary EVs were defined as events greater than 0.2 µm and less than 1 µm in diameter that were positive for annexin-V or cell-specific renal markers (Citation10). A considerable number of EVs greater than1 µm in diameter were also observed in urine samples from certain individuals (Citation10). Aggregation of exosomes with Tamm-Horsfall protein has been reported in urine and might account for some of these larger EVs (Citation18, Citation19). There are several markers including CD9 and CD63 that have been used for exosome characterization in previous studies, but none of them are specific to exosomes and instead overlap to a certain extent with plasma membrane–derived microvesicles. In this study, we used a panel of possible exosome markers including CD63, CD24, CD9 and CD81. Since similar results were obtained with each exosome marker, only data with CD63 were presented. In theory, the sizes of exosomes are less than 120 nm and cannot be detected by conventional flow cytometers. The CD63-positive vesicles in this study may represent exosomes associated with Tamm-Horsfall protein or CD63 positive microvesicles. Urinary EVs (>0.2 micron) were defined using previously established gates and guidelines (Citation10, Citation20). The thresholds of fluorescence dot plots were set with isotype controls or irrelevant fluorescent antibodies. Example of fluorescence dot plots (quadrants) using different markers in diluted cells-free urine are presented in . Urinary EVs stained in phosphate-buffered saline or HEPES-buffered saline (HBS; pH 7.4) without calcium served as negative controls for annexin-V positivity. The absolute count of urinary EVs either in the absence or presence of single or dual fluorescent staining was calculated with the following previously established method of calculation (Citation10),Citation20,Citation21. The volume of urine (ranging between 5 µl and 80 µl) was adjusted in the subsequent experiments in order to have at least 2,500 EVs in the vesicles gate that stained positive with annexin-V, since it binds to phosphatidylserine expressed on the surface of EVs and allows their distinction from chemical and protein particles in the urine. The absolute number of urinary EVs was expressed as the number of EVs per µL of urine and also normalized to urine creatinine concentration (Citation10). Specific normalization methods need to be established in future studies using specific common membrane markers of EVs.
Fig. 1. Example of fluorescence dot (quadrant) plots showing fluorophore spectra separate of markers used to identify urinary EVs in this study. (a) Isotype controls (fluorescein (FITC)-conjugated immunoglobulin G (IgG) versus phycoerythrin (PE)-conjugated IgG); (b) annexin-V (phosphatidylserine) versus CD63 (exosome); (c) intercellular adhesion molecule-1 (ICAM-1) versus monocyte chemoattractant protein-1 (MCP-1); (d) tissue factor (TF) versus vascular cell adhesion molecule -1 (VCAM-1); (e) beta-adrenergic receptor-1 (β-1 AR) versus renin; (f) SM22 alpha versus annexin-V-PE; (g) nephrin versus podocin; (h) cytokeratin 8 (CK 8) versus caludin-1; (i) URAT-1 versus megalin; (j) aquaporin-1 versus SLC14A2; (k) uromodulin versus epidermal growth factor receptor (EGFR); (l) SLC12A3 versus prominin; (m) aquaporin-2 versus V-ATPase; (n) cytokeratin 20 versus cytokeratin 19.
Renal biopsy analysis
As per the clinical protocol, biopsies of donated kidneys were obtained at the time of transplantation (time zero). Detailed methods regarding histological analyses of these renal biopsies have been previously described (Citation2, Citation15). Characterized structural changes included indices of nephron size (glomerular volume, cortical volume per glomerulus and mean profile tubular area) and of nephrosclerosis (increased % fibrosis, % glomerulosclerosis and arteriosclerosis).
Data analysis
All data analyses were performed using the SAS statistical software package (version 9.3, SAS Institute, Cary, NC). Data are presented as median with interquartile ranges (25th and 75th percentiles) of the natural log of concentration of urinary EVs/mg creatinine. Sex differences in EVs were analysed by the Kruskal–Wallis test. Given the skewed distributions of ordinal and continuous data, Spearman's correlation was used to associate renal parenchyma–derived EVs with age and renal structural measures.
Results
Clinical characteristics of living kidney donors
Detailed clinical characteristics of these living kidney donors have been published previously (Citation2, Citation15). Of the donors (n=138, age range: 20–70 years) in the present study, hypertension was diagnosed in 15.6% of women and 20.2% of men over the age of 35 years; of these, 14.5% of women and 15.6% of men were taking anti-hypertensive medication. As expected, haemoglobin, serum and urine creatinine, and uric acid were lower whereas high-density lipoprotein was higher in women compared with men (Table ). The non-sclerotic glomeruli volume, cortex per glomerulus and mean profile tubular area were significantly (p<0.05) greater in biopsies from men than women (Table ). There were no differences in the percentage of fibrosis, glomerulosclerosis and arteriosclerosis between men and women (Table ).
Table I. Clinical and renal biopsies characteristics of living kidney donors
Sex differences in the population of urinary EVs
Overall, women had a greater median number of urinary EVs compared with men when evaluated either as EVs/mg creatinine (Table ) or as EVs/µL urine (data not shown, p<0.05). The median number of EVs positive for phosphatidylserine (annexin-V), exosome (CD63), mesangial cell (SM22 alpha) and Bowman's capsule-parietal cell (claudin-1) markers (Table ) was higher in urine from women compared with urine from men. Other populations of EVs did not differ statistically by sex (Table ).
Table II. Sex differences in urinary EVs from living kidney donors
Age-associated changes in specific populations of urinary EVs from women and men
The total number of EVs positive for exosome, juxtaglomerular cell (β-1 adrenergic receptor) and podocyte (nephrin) markers decreased with increasing age (p<0.05; Table ). There were no changes in the concentration of EVs positive for phosphatidylserine (annexin-V), cellular adhesion/inflammatory molecule (ICAM-1, VCAM-1, tissue factor, MCP-1) or other renal tubular/ renal pelvis epithelial cell markers with increasing age (data not shown).
Table III. Changes of urinary EVs with older age
Association of specific populations of urinary EVs with renal morphometry
Examples of morphometric nephron hypertrophy and nephrosclerosis indices of the biopsied donor kidneys are presented in . The total number of EVs positive for phosphatidylserine, exosome and mesangial cell marker decreased with increasing volume of non-sclerotic glomeruli (p<0.05; Table and V ). The number of EVs positive for phosphatidylserine, and markers for exosome, mesangial cells, parietal cells of the Bowman's capsule (cytokeratin 8) and intercalated cells of the collecting tubule (V-ATPase) decreased with increasing volume of cortex/glomerulus (p<0.05; Table and V ). The number of EVs positive for MCP-1 and epithelial cell marker (aquaporin-1) of the descending limb of Henle decreased with increasing mean tubular area (p<0.05; Table and V ). There was no association between the number of EVs positive for other renal cellular markers and indices of nephron hypertrophy (Table ).
Fig. 2. Example of biopsies morphometric observation indices of nephron hypertrophy and nephrosclerosis/glomerulosclerosis. (a) Two functional non-sclerotic glomeruli; (b) 2 globally sclerosed glomeruli; (c) 5 consecutive 0.2 mm2 circles (green) in which full (red) or partial (cyan) tubules are labelled, and their area subsequently quantified after exclusion of all non-tubular structures (yellow); (d) area of cortical fibrosis and tubular atrophy outlined in blue dashed line; (e) the percent intimal thickening (arteriosclerosis) was determined by the area of intima (between yellow and blue boundaries) divided by the area of intima and lumen (within blue boundary). Examples of different degrees of intimal thickening are shown in E1–no thickening, E2–moderate thickening and E3–severe thickening.
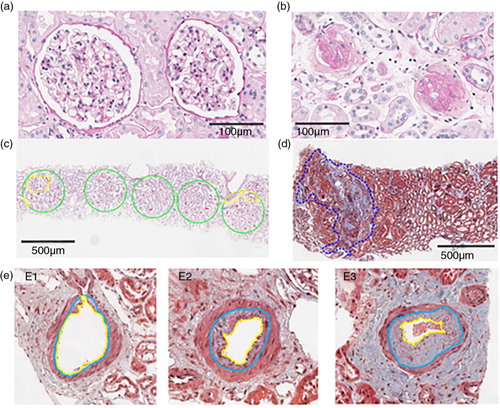
Table IV. Changes of phosphatidylserine, exosome, cellular adhesion and inflammatory markers positive for urinary EVs with nephron hypertrophy
Table V. Changes of urinary EVs–derived from different types of cells surrounded by renal capillaries, nephron and renal pelvis with nephron hypertrophy
The number of EVs positive for phosphatidylserine and MCP-1 increased with increases in cortical fibrosis and the number of fibrosis foci (p<0.05; Table ). The number of EVs positive for ICAM-1; glomerular cells (juxtaglomerular cells, podocytes and parietal cells); and proximal (megalin), distal (prominin-2) and collecting (aquaporin-2 and V-ATPase) tubular cells decreased with increases in the percentage of globally sclerotic glomeruli (p<0.05; Table and VII ). The number of EVs positive for procoagulant or thrombogenic molecules (phosphatidylserine and tissue factor) declined with increased arteriosclerosis (Table ). There were no associations between the number of EVs positive for makers of the renal pelvic epithelium and indices of nephrosclerosis (Table ).
Table VI. Changes of phosphatidylserine, exosome, cellular adhesion and inflammatory markers positive for urinary EVs with nephrosclerosis
Table VII. Changes of urinary EVs–derived from different types of cells surrounded by renal capillaries, nephron and renal pelvis with nephrosclerosis
All together there were 144 correlations tested (24 EV markers and 6 biopsy characteristics; Table –VII ), of which, 24 were statistically significant, which is more than the 5% expected by chance alone.
Discussion
As of yet, there are no non-invasive methods to characterize renal structural pathophysiological changes before the onset of overt clinical disease. The current study addresses this problem by quantifying specific populations of urinary EVs derived from cells of the glomerulus and nephron and their association with underlying renal structural changes (nephron hypertrophy and nephrosclerosis). These results suggest that characterizing EVs with specific renal cell markers may prove useful in monitoring kidney health. Knowing the rate and/or stage of kidney senescence could provide important diagnostic and prognostic information for medication dosing, eligibility of living kidney donors and determining susceptibility for kidney diseases (Citation6).
Nephron hypertrophy and nephrosclerosis are closely related micro-anatomical changes within the kidney (Citation2), but both processes are thought to arise through a separate mechanism (Citation15). Nephron hypertrophy can be a compensatory response of remaining nephrons to nephrosclerosis (Citation16). The concentration of EVs positive for phosphatidylserine, exosomes and mesangial cells decreased with increasing glomerular volume and cortex per glomerulus, suggesting that compensatory nephron hypertrophy occurs as the size of cortex decreases and that of the medulla increases with aging (Citation3). These changes observed in EV populations associated with indices of nephron hypertrophy could be related to the decreased number of functional glomeruli with increased glomerulosclerosis. The numbers of EVs positive for phosphatidylserine and MCP-1 associated with cortical fibrosis, perhaps reflecting ongoing inflammation (Citation22, Citation23). However, decreases in the number of EVs positive for ICAM-1, glomerular cells, and proximal, distal and collecting tubular cells with increases in sclerotic glomeruli may reflect decreased glomerular functionality as the percentage of glomerulosclerosis increases, resulting in fewer active cells shedding vesicles along the nephron. EVs positive for procoagulant/thrombogenic molecules (phosphatidylserine and tissue factor) participate in early and late cardiovascular disease processes (Citation20),Citation21,Citation24–Citation28) and decreases of these EVs may reflect atherosclerosis and thrombosis-related activity in renal capillaries and parenchyma.
Renal size and glomerular count (17%) is greater in men than women, and there is evidence that renal diseases progress differently depending on sex (Citation29). In general, renal diseases affect premenopausal women less severely than age-matched men. Sex differences in the incidence and progression of renal diseases may be influenced by the protective effects of oestrogen (in women) or the accelerative effects of testosterone (in men) (Citation30, Citation31). In turn, these differences might change urinary biomarkers (Citation32–Citation35). For example, we previously reported that the urine of women contains a greater number of EVs derived from the renal parenchyma compared with men (Citation10). In that study, the concentration of urinary EVs was also lower in women with first-time kidney stone compared with age-matched control women, but there were no differences in urinary EVs between men with first-time kidney stone and control men (Citation10). Larger population studies are needed to fully understand the relationship between EVs, sex hormonal status and the progression of renal disease.
Renal structural alterations that occur with aging might associate with GFR, permeability of the glomeruli, susceptibility for podocyte injury and tubular apoptosis (Citation36–Citation39). It remains a challenge to differentiate the decline in renal function associated with normal aging from that caused by specific disease processes. In the current study, the number of exosomes and EVs from juxtaglomerular cells and podocytes declined with age in both sexes. Thus, these cellular biomarkers of key renal structural features could be quite useful to differentiate aging versus disease. In the current study, the association of older age with a lower number of exosomes and EVs positive for juxtaglomerular cells and podocytes could reflect increased podocyte injury, decreased glomerular function and/or increased glomerulosclerosis and arteriosclerosis, since other studies have reported that the number of functional podocytes decreased with age, and the remaining podocytes manifest a decreased ability to regenerate and/or repair themselves (Citation38–Citation40).
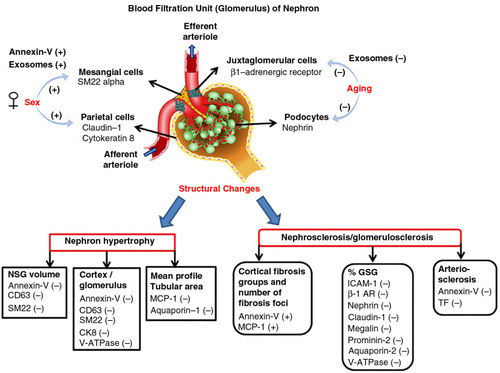
An overall summary of significantly changed EVs is presented in . Specific populations of EVs differ between sexes and reflect the underlying structural pathology of the aging kidney. EV populations from glomerular cells declined with aging, perhaps suggesting an age-associated decrease in functional glomerular cells. The severity of nephron hypertrophy and nephrosclerosis within the kidneys of asymptomatic persons can be non-invasively monitored using specific glomerular cell marker–positive EV populations, since urinary EV populations correlated with increased non-sclerotic glomeruli volume, mean tubular area, fibrosis, globally sclerotic glomeruli and arteriosclerosis. Recent studies suggest that concentration and content of RNAs and proteins of activated renal cell-derived EVs in urine can identify early and late renal pathophysiological processes (Citation12–Citation14). Further validation regarding the populations of urinary EVs in other cohorts and their relationship to kidney senescence and diseases is needed. This information should facilitate discovery of novel renal pathophysiological processes associated with normal aging, tools for risk stratification and identification of early renal disease processes, and to personalized diagnostic and treatment strategies.
Fig. 3. Shows the overall changes of specific populations of urinary EVs between sexes and with older age, nephron hypertrophy and nephrosclerosis. (−) indicates decrease and (+) indicates increase. Abbreviations/renal cell markers: annexin-V, microvesicles; aquaporin-1, simple squamous epithelium of descending limb of Henle's loop; aquaporin-2, principal cells of collecting tubule; β1-AR (beta-1 adrenergic receptor), juxtaglomerular cells; CD63, exosomes; CK8 (cytokeratin 8), parietal cells; claudin-1, parietal cells; GSG, globally sclerotic glomeruli; ICAM-1, intercellular adhesion molecule-1; megalin, simple cuboidal epithelium of proximal tubule; MCP-1, monocyte chemoattractant protein-1; nephrin, podocytes; NSG, non-sclerotic glomeruli; prominin-2, simple cuboidal epithelium of distal tubule; SM22 alpha, mesangial cells; TF, tissue factor; V-ATPase, intercalated cells of collecting tubule.
There are several limitations to this study. The sample size was limited. The population consisted of living kidney donors and thus had a restricted range of renal pathology (due to the donor selection process). Assessment of these urinary EVs in populations with overt kidney disease and more severe underlying pathology are needed. Nonetheless, kidney donors offer a unique opportunity for detection of subclinical pathology not detected by current kidney health assessment tests (such as GFR, urine protein and blood pressure) with aging. Finally, a considerable number of urinary EVs <200 nm were not quantified in this study due to the detection limit of digital flow cytometer.
In summary, urinary EVs can be used as a non-invasive and specific novel cellular biomarker to identify age-associated, clinically relevant structural changes in kidneys. Prior studies demonstrated that nucleic acids within urinary exosomes and microvesicles as potential biomarkers for renal disease (Citation12), Citation41–(Citation44). Further validation and complete characterization of the content of bioactive molecules (mRNA, miRNA, proteins and metabolites) of renal parenchymal–derived EVs in larger and more diverse cohort of patients is needed. The relationship of these EVs to kidney senescence and diseases may provide further insight into clinical utility and the specific renal cellular pathways they detect.
Conflict of interest and funding
None of the authors declare competing financial interest.
Acknowledgements
This study was supported by National Institutes of Health Grant DK090358 and partly by R25-DK101405, Mayo Clinic O'Brien Urology Research Center (U54 DK100227), American Heart Association grant 12GRNT12050147 and the Mayo Clinic NIH Specialized Center of Research (SCOR) on Sex Differences (AG44170). The authors thank the Mayo Clinic technical staff – Samuel N. Edeh, Zejfa Haskic and Timothy M. Halling – for technical assistance and data entry.
Related Research Data
References
- Nyengaard JR, Bendtsen TF. Glomerular number and size in relation to age, kidney weight, and body surface in normal man. Anat Rec. 1992; 232: 194–201. http://dx.doi.org/10.1002/ar.1092320205 [PubMed Abstract].
- Rule AD, Amer H, Cornell LD, Taler SJ, Cosio FG, Kremers WK, etal. The association between age and nephrosclerosis on renal biopsy among healthy adults. Ann Intern Med. 2010; 152: 561–7. http://dx.doi.org/10.7326/0003-4819-152-9-201005040-00006 [PubMed Abstract] [PubMed CentralFull Text].
- Wang X, Vrtiska TJ, Avula RT, Walters LR, Chakkera HA, Kremers WK, etal. Age, kidney function, and risk factors associate differently with cortical and medullary volumes of the kidney. Kidney Int. 2014; 85: 677–85. http://dx.doi.org/10.1038/ki.2013.359 [PubMed Abstract] [PubMed CentralFull Text].
- Duan X, Rule AD, Elsherbiny H, Vrtiska TJ, Avula RT, Alexander MP, etal. Automated assessment of renal cortical surface roughness from computerized tomography images and its association with age. Acad Radiol. 2014; 21: 1441–5. http://dx.doi.org/10.1016/j.acra.2014.05.014 [PubMed Abstract] [PubMed CentralFull Text].
- Al-Said J, Brumback MA, Moghazi S, Baumgarten DA, O'Neill WC. Reduced renal function in patients with simple renal cysts. Kidney Int. 2004; 65: 2303–8. http://dx.doi.org/10.1111/j.1523-1755.2004.00651.x [PubMed Abstract].
- Rodriguez-Castro EM, Cordova HR. Aging and the kidney. Bol Asoc Med P R. 2011; 103: 57–62. [PubMed Abstract].
- Lee TH, D'Asti E, Magnus N, Al-Nedawi K, Meehan B, Rak J. Microvesicles as mediators of intercellular communication in cancer – the emerging science of cellular ‘debris’. Semin Immunopathol. 2011; 33: 455–67. http://dx.doi.org/10.1007/s00281-011-0250-3 [PubMed Abstract].
- Duijvesz D, Burnum-Johnson KE, Gritsenko MA, Hoogland AM. Vredenbregt-van den Berg MS, Willemsen R, et al. Proteomic profiling of exosomes leads to the identification of novel biomarkers for prostate cancer. PLoS One. 2013; 8: 82589. http://dx.doi.org/10.1371/journal.pone.0082589 .
- Heijnen HF, Schiel AE, Fijnheer R, Geuze HJ, Sixma JJ. Activated platelets release two types of membrane vesicles: microvesicles by surface shedding and exosomes derived from exocytosis of multivesicular bodies and alpha-granules. Blood. 1999; 94: 3791–9. [PubMed Abstract].
- Jayachandran M, Lugo G, Heiling H, Miller VM, Rule AD, Lieske JC. Extracellular vesicles in urine of women with but not without kidney stones manifest patterns similar to men: a case control study. Biol Sex Differ. 2015; 6: 2. http://dx.doi.org/10.1186/s13293-015-0021-2 [PubMed Abstract] [PubMed CentralFull Text].
- Knepper MA, Pisitkun T. Exosomes in urine: who would have thought…?. Kidney Int. 2007; 72: 1043–5. http://dx.doi.org/10.1038/sj.ki.5002510 [PubMed Abstract].
- van Balkom BW, Pisitkun T, Verhaar MC, Knepper MA. Exosomes and the kidney: prospects for diagnosis and therapy of renal diseases. Kidney Int. 2011; 80: 1138–45. http://dx.doi.org/10.1038/ki.2011.292 [PubMed Abstract] [PubMed CentralFull Text].
- Gamez-Valero A, Lozano-Ramos SI, Bancu I, Lauzurica-Valdemoros R, Borras FE. Urinary extracellular vesicles as source of biomarkers in kidney diseases. Front Immunol. 2015; 6: 6. http://dx.doi.org/10.3389/fimmu.2015.00006 [PubMed Abstract] [PubMed CentralFull Text].
- Borges FT, Reis LA, Schor N. Extracellular vesicles: structure, function, and potential clinical uses in renal diseases. Braz J Med Biol Res. 2013; 46: 824–30. http://dx.doi.org/10.1590/1414-431X20132964 [PubMed Abstract] [PubMed CentralFull Text].
- Elsherbiny HE, Alexander MP, Kremers WK, Park WD, Poggio ED, Prieto M, etal. Nephron hypertrophy and glomerulosclerosis and their association with kidney function and risk factors among living kidney donors. Clin J Am Soc Nephrol. 2014; 9: 1892–902. http://dx.doi.org/10.2215/CJN.02560314 [PubMed Abstract] [PubMed CentralFull Text].
- Rule AD, Semret MH, Amer H, Cornell LD, Taler SJ, Lieske JC, etal. Association of kidney function and metabolic risk factors with density of glomeruli on renal biopsy samples from living donors. Mayo Clin Proc. 2011; 86: 282–90. http://dx.doi.org/10.4065/mcp.2010.0821 [PubMed Abstract] [PubMed CentralFull Text].
- Levey AS, Stevens LA, Schmid CH, Zhang YL, Castro AF 3rd , Feldman HI, etal. A new equation to estimate glomerular filtration rate. Ann Intern Med. 2009; 150: 604–12. [PubMed Abstract] [PubMed CentralFull Text].
- Fernandez-Llama P, Khositseth S, Gonzales PA, Star RA, Pisitkun T, Knepper MA. Tamm-Horsfall protein and urinary exosome isolation. Kidney Int. 2010; 77: 736–42. http://dx.doi.org/10.1038/ki.2009.550 [PubMed Abstract] [PubMed CentralFull Text].
- Kosanovic M, Jankovic M. Isolation of urinary extracellular vesicles from Tamm–Horsfall protein-depleted urine and their application in the development of a lectin-exosome-binding assay. Biotechniques. 2014; 57: 143–9. http://dx.doi.org/10.2144/000114208 [PubMed Abstract].
- Jayachandran M, Miller VM, Heit JA, Owen WG. Methodology for isolation, identification and characterization of microvesicles in peripheral blood. J Immunol Methods. 2012; 375: 207–14. http://dx.doi.org/10.1016/j.jim.2011.10.012 [PubMed Abstract] [PubMed CentralFull Text].
- Jayachandran M, Litwiller RD, Owen WG, Heit JA, Behrenbeck T, Mulvagh SL, etal. Characterization of blood borne microparticles as markers of premature coronary calcification in newly menopausal women. Am J Physiol Heart Circ Physiol. 2008; 295: 931–H8. http://dx.doi.org/10.1152/ajpheart.00193.2008 .
- Segerer S, Nelson PJ, Schlondorff D. Chemokines, chemokine receptors, and renal disease: from basic science to pathophysiologic and therapeutic studies. J Am Soc Nephrol. 2000; 11: 152–76. [PubMed Abstract].
- Lee SB, Kalluri R. Mechanistic connection between inflammation and fibrosis. Kidney Int Suppl. 2010; 22–6. http://dx.doi.org/10.1038/ki.2010.418 .
- Loyer X, Vion AC, Tedgui A, Boulanger CM. Microvesicles as cell-cell messengers in cardiovascular diseases. Circ Res. 2014; 114: 345–53. http://dx.doi.org/10.1161/CIRCRESAHA.113.300858 [PubMed Abstract].
- Leroyer AS, Isobe H, Leseche G, Castier Y, Wassef M, Mallat Z, etal. Cellular origins and thrombogenic activity of microparticles isolated from human atherosclerotic plaques. J Am Coll Cardiol. 2007; 49: 772–7. http://dx.doi.org/10.1016/j.jacc.2006.10.053 [PubMed Abstract].
- Gustafson CM, Shepherd AJ, Miller VM, Jayachandran M. Age- and sex-specific differences in blood-borne microvesicles from apparently healthy humans. Biol Sex Differ. 2015; 6: 10. http://dx.doi.org/10.1186/s13293-015-0028-8 [PubMed Abstract] [PubMed CentralFull Text].
- Miller VM, Lahr BD, Bailey KR, Heit JA, Harman SM, Jayachandran M. Longitudinal effects of menopausal hormone treatments on platelet characteristics and cell-derived microvesicles. Platelets. 2015; 1–11. http://dx.doi.org/10.3109/09537104.2015.1023273 .
- Tatsumi K, Mackman N. Tissue Factor and Atherothrombosis. J Atheroscler Thromb. 2015; 22: 543–9. http://dx.doi.org/10.5551/jat.30940 [PubMed Abstract].
- Hoy WE, Douglas-Denton RN, Hughson MD, Cass A, Johnson K, Bertram JF. A stereological study of glomerular number and volume: preliminary findings in a multiracial study of kidneys at autopsy. Kidney Int Suppl. 2003; 31–7. http://dx.doi.org/10.1046/j.1523-1755.63.s83.8.x .
- Kwan G, Neugarten J, Sherman M, Ding Q, Fotadar U, Lei J, etal. Effects of sex hormones on mesangial cell proliferation and collagen synthesis. Kidney Int. 1996; 50: 1173–9.
- Verzola D, Gandolfo MT, Salvatore F, Villaggio B, Gianiorio F, Traverso P, etal. Testosterone promotes apoptotic damage in human renal tubular cells. Kidney Int. 2004; 65: 1252–61. http://dx.doi.org/10.1111/j.1523-1755.2004.00497.x [PubMed Abstract].
- Hannedouche T, Chauveau P, Kalou F, Albouze G, Lacour B, Jungers P. Factors affecting progression in advanced chronic renal failure. Clin Nephrol. 1993; 39: 312–20. [PubMed Abstract].
- Stewart JH. End-stage renal failure appears earlier in men than in women with polycystic kidney disease. Am J Kidney Dis. 1994; 24: 181–3.
- Schena FP. A retrospective analysis of the natural history of primary IgA nephropathy worldwide. Am J Med. 1990; 89: 209–15.
- Gabow PA, Johnson AM, Kaehny WD, Kimberling WJ, Lezotte DC, Duley IT, etal. Factors affecting the progression of renal disease in autosomal-dominant polycystic kidney disease. Kidney Int. 1992; 41: 1311–9.
- Wiggins JE, Goyal M, Sanden SK, Wharram BL, Shedden KA, Misek DE, etal. Podocyte hypertrophy, “adaptation,” and “decompensation” associated with glomerular enlargement and glomerulosclerosis in the aging rat: prevention by calorie restriction. J Am Soc Nephrol. 2005; 16: 2953–66. http://dx.doi.org/10.1681/ASN.2005050488 [PubMed Abstract].
- Esposito C, Dal Canton A. Functional changes in the aging kidney. J Nephrol. 2010; 23(Suppl 15): S41–5. [PubMed Abstract].
- Huber TB, Edelstein CL, Hartleben B, Inoki K, Jiang M, Koya D, etal. Emerging role of autophagy in kidney function, diseases and aging. Autophagy. 2012; 8: 1009–31. http://dx.doi.org/10.4161/auto.19821 [PubMed Abstract] [PubMed CentralFull Text].
- Wiggins JE. Aging in the glomerulus. J Gerontol A Biol Sci Med Sci. 2012; 67: 1358–64. http://dx.doi.org/10.1093/gerona/gls157 [PubMed Abstract] [PubMed CentralFull Text].
- Zhang J, Hansen KM, Pippin JW, Chang AM, Taniguchi Y, Krofft RD, etal. De novo expression of podocyte proteins in parietal epithelial cells in experimental aging nephropathy. Am J Physiol Renal Physiol. 2012; 302: 571–80. http://dx.doi.org/10.1152/ajprenal.00516.2011 .
- Miranda KC, Bond DT, McKee M, Skog J, Paunescu TG, Da Silva N, etal. Nucleic acids within urinary exosomes/microvesicles are potential biomarkers for renal disease. Kidney Int. 2010; 78: 191–9. http://dx.doi.org/10.1038/ki.2010.106 [PubMed Abstract] [PubMed CentralFull Text].
- Beltrami C, Clayton A, Newbury LJ, Corish P, Jenkins RH, Phillips AO, etal. Stabilization of urinary microRNAs by association with exosomes and argonaute 2 protein. Non-Coding RNA. 2015; 1: 151–61. http://dx.doi.org/10.3390/ncrna1020151 .
- Lv LL, Cao YH, Pan MM, Liu H, Tang RN, Ma KL, etal. CD2AP mRNA in urinary exosome as biomarker of kidney disease. Clin Chim Acta. 2014; 428: 26–31. http://dx.doi.org/10.1016/j.cca.2013.10.003 [PubMed Abstract].
- Murakami T, Oakes M, Ogura M, Tovar V, Yamamoto C, Mitsuhashi M. Development of glomerulus-, tubule-, and collecting duct-specific mRNA assay in human urinary exosomes and microvesicles. PLoS One. 2014; 9: 109074. http://dx.doi.org/10.1371/journal.pone.0109074 .