
Abstract
Background
Urinary extracellular vesicles (UEVs) represent an ideal platform for biomarker discovery. They carry different types of RNA species, and reported profile discrepancies related to the presence/absence of 18s and 28s rRNA remain controversial. Moreover, sufficient urinary RNA yields and respective quality RNA profiles are still to be fully established.
Methods
UEVs were enriched by hydrostatic filtration dialysis, and RNA content was extracted using 7 different commercially available techniques. RNA quantity was assessed using spectrophotometry and fluorometry, whilst RNA quality was determined by capillary electrophoresis.
Results
The presence of prokaryotic transcriptome was stressed when cellular RNA, as a control, was spiked into the UEVs samples before RNA extraction. The presence of bacteria in hydrostatic filtration dialysis above 1,000 kDa molecular weight cut-off and in crude urine was confirmed with growth media plates. The efficiency in removing urinary bacteria was evaluated by differential centrifugation, filtration (0.22 µm filters) and chemical pretreatment (water purification tablet). For volumes of urine >200 ml, the chemical treatment provides ease of handling without affecting vesicle integrity, protein and RNA profiles. This protocol was selected to enrich RNA with 7 methods, and its respective quality and quantity were assessed. The results were given as follows: (a) Fluorometry gave more repeatability and reproducibility than spectrophotometry to assess the RNA yields, (b) UEVs were enriched with small RNA, (c) Ribosomal RNA peaks were not observed for any RNA extraction method used and (d) RNA yield was higher for column-based method designed for urinary exosome, whilst the highest relative microRNA presence was obtained using TRIzol method.
Conclusion
Our results show that the presence of bacteria can lead to misidentification in the electrophoresis peaks. Fluorometry is more reliable than spectrophotometry. RNA isolation method must be selected in conjunction with appropriate UEV collection procedure. We also suggested that a minimum 250 ml of urine should be processed to gather enough RNA for robust quantification, qualification and downstream analysis.
To access the supplementary material to this article, please see Supplementary files under ‘Article Tools’.
Urinary extracellular vesicles (UEVs) are small (size: 20–1,000 nm) spherical structures released by cells along the entire urogenital tract: from glomerular epithelial cells (podocytes), proximal and distal tubules and collecting ducts as well as from urinary bladder epithelium (Citation1). The term UEVs refers to both plasma membrane-derived (e.g. microvesicles, exosome-like vesicles, ectosomes and retrovirus-like particles) and endosomal-derived vesicles (referred as exosomes). Together, the UEVs appear to mirror faithfully the physiological condition of their cells of origin (Citation2–Citation4). Additionally, secreted vesicles were shown to mediate specific aspects of inter-cellular communication by their miRNA, mRNA and tRNA known as “exosomal shuttle RNA” (Citation5, Citation6). Accordingly, UEVs have shown to carry RNA cargo translating to functional proteins located in strictly defined nephron segments (Citation7).
The microRNAs (miRNA) have gained major interest due to their direct regulatory role in gene expression (Citation8). Accordingly, distinct miRNAs have been associated with key events in kidney development, maintenance of distinct functions and in kidney diseases (Citation9–Citation11).
A variety of small RNA populations including miRNA (Citation12) appear to be particularly enriched in UEVs. However, depending on the collection, UEVs enrichment and RNA extraction methods, remarkable variability has been observed in reported RNA profiles. Interestingly, Miranda et al. showed the presence of 18s and 28s rRNA in UEV RNA (Citation7, Citation13). On the other hand, Lv et al. reported enrichment of small RNAs without characteristic peaks of ribosomal RNA (Citation14), which is in line with our previous findings (Citation15). In fact, both the RNA isolation method and the protocol used for extracellular vesicle isolation appear to have a strong impact on the RNA yield and quality (Citation7, Citation12) (Citation13, Citation16–Citation18). These findings emphasize the importance of using optimized protocols for urine collection as well as for the isolation methods for UEV and RNA extraction.
However, details of RNA quality assessment are often not reported (Citation19, Citation20). Thus, samples of unknown quality and quantity enter sensitive downstream applications, like quantitative real-time PCR or next-generation sequencing, for comparative target miRNA screening. This is in contrast with published guidelines (International Society for Extracellular Vesicle guidelines and Minimum Information for Publication of Quantitative Real-Time PCR Experiments (MIQE)), which strongly recommend RNA quality assessment and reporting in publications (Citation21, Citation22). Any downstream analysis of RNA calls for high-quality starting material for repeatability and reproducibility (Citation21). Furthermore, technical challenges in RNA quantitation due to the low RNA yield need to be considered (Citation23). These challenges are multiplied with urinary samples as, by its very nature, urine can be highly diluted and available in small amounts (10–50 ml), especially in sample biobanks. On the other hand, larger volumes (more than 200–300 ml) are challenging to store and handle with traditional purification methods, which involve differential centrifugations. Moreover, individual parameters like urine viscosity, which depends on temperature, protein concentration and ionic composition can seriously influence UEV recovery during a series of differential centrifugations (Citation24, Citation25).
Recently, we introduced a new approach for UEV enrichment based on hydrostatic filtration dialysis (HFD). This method allows easy handling of large volumes of urine and results in superior yield of total UEV population irrespective of vesicle size or soluble component contamination (Citation15). Additionally, our dialysis step included in the HFD uses a 1,000 kDa molecular weight cut-off (MWCO) to allow standardization of chemical–physical conditions of samples. The HFD method also eliminates elements smaller than MWCO including RNases (Citation26) and DNases (Citation27).
Here we report the RNA quality and yield measures based on comparison among phenol-, lysis buffer- and column-based methods including a detailed description of urine collection and UEV enrichment protocols. A cellular RNA spike has been introduced to establish, detect or exclude potential degradation of RNA during the extraction process and thus, to confirm UEV RNA profile pattern reliably.
Materials and methods
Sample collection and processing
Ethical approval
The protocol for urine collection from healthy volunteers has been approved by Ethical Committee of Dublin City University, Ireland (DCUREC/2014/222). All experiments were performed in accordance with the declaration of Helsinki, and written informed consent was obtained from all study participants.
Urine samples
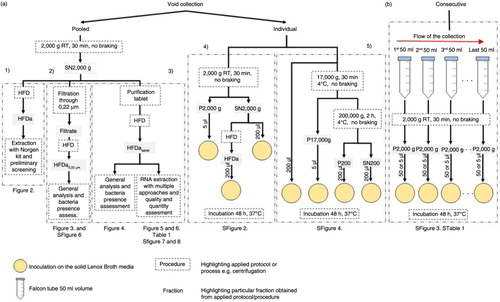
First and second morning urine was collected anonymously from 6 healthy volunteers (3 male and 3 female) aged 25–45 in 2 type of collections: void or consecutive (). The consecutive collection of urine in this study is defined as successive catch of the urinary consecutive sample in 50 ml Falcon tubes starting from the very first catch (b). More collection details are provided in Supplementary File. Urine was collected without adding protease inhibitors (Citation15, Citation28) and tested negative for leucocytes, nitrate, proteins, ketones, bilirubin, blood and normal for glucose and urobilinogen using the Combur 10 Test®D Dipsticks (Roche Diagnostic, Basel, Switzerland). All samples were processed within 4 h from collection.
Fig. 1. Workflow of urine collection. (a) Collection of void urine including individual approach for bacterial assessment and pooled for comprehensive analysis of extracellular vesicle RNA. (b) Consecutive collection from individual donors for bacterial presence assessment. 1) Protocol to obtain HFDa; 2) protocol to obtain HFDa0.22 µm; 3) protocol to obtain HFDatablet; 4) protocol of microbiological analysis with HFDa fractions; and 5) differential centrifugations protocol for microbiological analysis.
Sample processing and UEVs enrichment
Hydrostatic filtration dialysis. Urine was first centrifuged at 2,000 g (4,230 rpm, g-force calculated at top of the 50 ml Falcon tube at minimal radius of 55 mm in a swing bucket rotor, clearance factor k=10,153, adjusted kadj=14,186 on applied speed) (Citation29), using a Benchtop Universal 320 centrifuge (Hettich Zentrifugen, Tuttingen, Germany). Sodium citrate and ethylenediamine tetraacetic acid (EDTA) were added to supernatant (final concentration 50 mM and 8 mM, respectively) to chelate divalent cations and therefore to prevent calcium oxalate crystals formation (Citation30). Moreover, the citrate EDTA helps to resolubilize the cryo-precipitate formation when stored at −80°C until further processed (Supplementary Fig. 1).
Next, pooled supernatant (volume of 2,000–5,000 ml pooled urine depending on the preparation) was thawed at room temperature, mixed and HFD applied (for exact protocol, see ref. 15). Briefly, to each funnel connected with dialysis membrane (Spectra/Por, Spectrum Laboratories Inc, Rancho Dominguez, CA) with 1,000 kDa MWCO, a volume of 500 ml was poured in. After concentration of sample to around 5 ml, 200 ml of milliQ water (EMD Millipore, Billerica, MA) was poured into a funnel to allow removal of possible residual molecules with a molecular weight smaller than the MWCO of the membrane. Then, samples were collected after volume reduction to less than 5 ml and pooled. For simplicity, we refer to this fraction as HFDa (Hydrostatic Filtration Dialysis above 1,000 kDa MWCO). Bradford assay was performed for protein content. Next, sample was divided into 200 µg aliquots.
A modification of the protocol above was introduced after primary examination of RNA quality and microbiological testing. Thus, a tablet of Micropur® water purification (0.1 mg silver chloride, 4.5 mg troclosene sodium per tablet, Boots pharmaceutical, Nottingham, UK) was added to the supernatant 2,000 g after complete thawing (total preparation: 5 tablets in 5,000 ml). In this protocol, the 200 ml milliQ water, used to wash out concentrated solution after HFD, was replaced with the same volume of Micropur® tablet treated water solution (see above). Fraction obtained with this protocol is referred to as HFDtablet and was aliquoted to provide technical replicates. Aliquots (100 µg of protein – equivalent of 230 ml of urine starting volume) of HFDatablet were used for multiple RNA extraction methods. The respective aliquot volumes (290 µl) were processed directly after preparation without a further concentration step.
Urine filtration and HFD. In the alternative approach, supernatant 2,000 g (triplicate of 500 ml) with sodium citrate/EDTA addition was filtered through Steritop vacuum sterile polyethersulfone (PES) membrane (0.22 µm pore size; Millipore) using 700 mbar vacuum pressure by WOB-L Pressure/Vacuum Pump model no. 2522C-02 (Welch, Sheboygan, WI). The filters were cut and placed in 20 ml of 1% (w/v) sodium dodecyl sulphate solution (SDS) in end-over-end agitation to elute remaining material for comparative analysis. The filtrates were then forwarded to HFD to obtain extracellular vesicle-rich fraction (HFDa0.22 µm), which were also analyzed microbiologically. Next SDS-PAGE, western and lectin blots were performed.
Differential centrifugation in UEV enrichment and consecutive collection were performed for systematic microbiological analysis. Details are provided in Supplementary File .
Microbiological analysis included inoculation on Lennox Broth media plates based on expanded quantitative urine culture method (EQUC) (Citation31). Bacterial series of dilutions were prepared in liquid Lennox Broth media. For further details, please see Supplementary File.
Bradford assay, gel electrophoresis, colloidal Coomassie staining, western and lectin blots, transmission electron microscopy
A full description of the methods is provided in supplementary material information (see Supplementary File).
RNA extraction method and analysis
FastRNA PROTM Green Kit (phenol based; cited as FastRNA)
FastRNA PROTM Green Kit with Lysing Matrix D beads in FastPrep-24 device was used for UEV RNA extraction following the manufacturer's instructions (MP, Santa Ana, CA).
Mouse kidney tissue RNA. The kit was also used for RNA isolation from fresh mouse kidney later referred to as cellular RNA. Repeated homogenization rounds of whole kidney tissue were performed using FastPrep-24 device until no large pieces of tissue were noticeable following RNA extraction according to the manufacturer's instructions. Quality and quantity of RNA were analyzed prior use for experimental spike-in.
Urine Exosome RNA Isolation Kit (lysis and column based; cited as Norgen)
Urine Exosome RNA Isolation Kit (Norgen Biotek, Ontario, Canada) procedure was carried out following the manufacturer's instructions with minor modifications. Briefly, 300 µl of resin (Solution A1) was added to each HFDatablet aliquot (triplicate) following 250 µl of binding solution (Solution A2). After vortexing, samples were centrifuged at 2,500 rpm for 2 min to pellet the resin. Remaining resins were incubated with supplied lysis buffer (Solution B) for 15 min at room temperature, mixed with 67% isopropanol (≥99%, molecular grade, I9516, Sigma-Aldrich) and transferred to mini filter spin columns. Next, 3 washes with wash solution (400 µl each) were performed. RNA elution solution (50 µl) was used to recover the RNA from columns.
Preliminary study of RNA isolated from UEVs. Norgen Kit protocol was also used for preliminary investigation on UEV fraction enriched with HFD without purification tablet treatment. The HFDa aliquots of 200 µg of protein were used for RNA extraction. To investigate any sample degradation during the extraction process a spike-in of cellular RNA (total 3 µg) was added into HFDa prior to RNA isolation. For control purposes, cellular RNA was also re-extracted with Norgen Kit following the steps above.
Bacterial RNA extraction. Bacteria isolated from urine were used for RNA extraction with Norgen Kit and assessed for quality and quantity. Next, 5 ng of bacterial RNA was mixed with 5 ng of cellular RNA and analyzed in Bioanalyzer (Agilent Technologies, Santa Clara, CA).
TRIzol solution-based protocol by Chomczyński and Sacchi (Citation32) (phenol based; cited as TRIzol)
TRIzol solution was mixed with 14.3 M β-mercaptoethanol (BME; min. 98%, molecular grade, M3148, Sigma-Aldrich) prior use in ratio 1:100 and 1 ml added per HFDatablet aliquot. Next, samples were incubated for 20 min followed by the addition of 200 µl of chloroform on ice. After additional 10 min incubation, samples were centrifuged at +4°C, 12,000 g for 30 min. Thereafter, the upper phases were collected, mixed with absolute propanol (1:1) and placed in −80°C for 20 h. To pellet the RNA, samples were centrifuged at +4°C, 12,000 g for 20 min, then washed with 75% ethanol followed by a centrifugation step to remove the salt traces. Samples were dried under a fume hood and resuspended in 50 µl of nuclease-free water (which was heated to +65°C).
miRNeasy Micro Kit (phenol and column based; cited as Qiagen)
Minor changes have been introduced to manufacturer's protocol for miRNeasy Micro Kit (Qiagen, Limburg, the Netherlands). Briefly, 7 µl of BME (14.3 M solution) was added to each 700 µl QIAzol solution prior use with HFDtablet samples. Incubation was performed for 20 min at RT, followed by the addition of 140 µl of chloroform (biotech grade, 496189, Sigma-Aldrich). After additional 10 min of incubation, the samples entered the phase separation step with extension of total centrifugation time from 15 to 30 min. The upper phases were collected and mixed with 1.5 volume of pure ethanol (190 proof, molecular biology, E7148, Sigma-Aldrich). Next, samples were placed on column and washed according to original protocol including DNase treatment on column (performed using RNase-free DNase Set (Qiagen)). Thereafter, RNA was eluted with 25 µl of RNase-free water.
Quick RNA Kit (phenol and column based; cited as Quick RNA)
Quick RNA Kit (ZymoResearch, Irvine, CA) manufacturer's instructions were followed in detail including use of TRIzol solution and DNase treatment on column using RNase-free DNase Set (Qiagen). RNA was eluted with 50 µl of RNase-free water.
Nucleo-Spin miRNA Kit (lysis buffer and column based; cited as Nucleo-spin)
Total RNA extraction protocol of Nucleo-Spin® miRNA Kit (Macherey-Nagel, Duren, Germany) was followed, including re-calculation of the volumes according to starting volume of the sample. Briefly, 300 µl of ML buffer (guanidinium thiocyanate) was added into 290 µl of HFDatablet fraction (100 µg; performed in triplicate) and vortexed intensively. After 5 min incubation, samples were placed on the filter columns and centrifuged (11,000 g, 1 min, RT) to remove undissolved debris. The flow-through was mixed with 600 µl of pure ethanol and loaded on RNA columns. After spin (14,000 g, 1 min, RT), the flow-through (small RNA) fractions were saved, the RNA column filters were desalted with MDB buffer (guanidinium thiocyanate and ethanol) and DNase treated using rDNase solution for 15 min (provided by the manufacturer). Meanwhile, the small RNA-containing flow-through was mixed with 600 µl of MP buffer (protein precipitation buffer) and placed on protein removal columns. Another short spin was performed (11,000 g, 1 min, RT) and recovered small RNA flow-through was mixed with 1,600 µl of MX buffer (Dioxan). The fraction of small RNA was loaded on the same as above RNA columns and forwarded to multiple washes step using MW1 (guanidinium thiocyanate and ethanol) and MW2 (ethanol with composition protected by trade mark) buffer according to the manufacturer's protocol. The RNA was recovered with 50 µl of RNase-free water.
mirVana miRNA Isolation Kit (lysis, phenol and column based; cited as mirVana)
Total RNA isolation protocol of miRVana® miRNA Isolation Kit (Life Technologies, Carlsbad, CA) was followed in detail according to the manufacturer's instructions. The RNA was eluted in 50 µl of elution solution (containing 0.1 mM EDTA) provided with the kit.
Quantitative and qualitative analysis
RNA concentrations were determined using NanoDrop ND-1000 (NanoDrop, Wilmington, DE) and in Qubit® Fluorometer using Qubit® RNA HS (Life Technologies). Next, capillary electrophoresis was performed using Agilent Bioanalyzer with Agilent RNA 6,000 Pico Kit and Agilent Small RNA Kit (Agilent Technologies).
Results
RNA extraction – quality control assessment
The HFD method was used to enrich the whole population of extracellular vesicles for comprehensive analysis of RNA independent of their origin in distinct vesicle types. Preparation was carried starting from 2,000 ml of pooled urine and obtained HFDa fraction was aliquoted into 200 µg of protein samples (based on Bradford assay). Urine Exosome RNA Isolation Kit (Norgen) was used because of its eligibility to handle larger sample volume (up to 10 ml) and specifically designed to enrich urinary exosomes. RNA was extracted from the aliquot of HFDa. Quality analysis in capillary electrophoresis demonstrated the enrichment in small RNA fraction (a) along with 18s and 28s rRNA, with a RNA integrity number (RIN) of 2.90, which suggests a potential degradation of sample. Thus, in order to check if sample degradation could have happened during extraction and to enable quality control of the RNA extraction process, cellular RNA from mouse kidney tissue was used. It was extracted by FastRNA Kit (b), then spiked into HFDa sample before the RNA extraction (c). Surprisingly, analysis with Bioanalyzer revealed that 2 characteristic peaks (expected to be 18s and 28s because of previous identification by the Bioanalyzer software) in the RNA profile of UEVs did not amplify after the addition of cellular RNA. Instead, 4 distinct peaks can be observed on the profile (c). Moreover, to exclude influence of RNA isolation protocol itself on RNA integrity, cellular RNA was re-extracted with Norgen Kit and run on the chip (d). No clear signs of cellular RNA degradation because of the use of Norgen Kit were observed, and the RIN values of crude cellular and Norgen re-extracted RNA were 8.0 and 8.4, respectively.
Fig. 2. Profiles of isolated RNA analyzed by Agilent 2100 Bioanalyzer in PicoChip (electropherograms). (a) UEVs RNA enriched via HFD and isolated with Norgen Kit; (b) cellular RNA extracted with FastRNA Kit; (c) UEVs with spike-in of cellular RNA; (d) cellular RNA re-extracted with Norgen Kit; (e) UEVs RNA, cellular RNA and UEVs+cellular RNA electropherograms merged together according to nucleotide size axis; (f) bacterial RNA; (g) cellular RNA and bacterial RNA mixed and run together; (h) cellular RNA and bacterial RNA electropherograms merged together according to nucleotide size axis. Grey arrow – marker dye; blue arrow – UEVs rRNA; red arrow – 18s and 28s rRNA; black arrow – 16s and 23s rRNA.
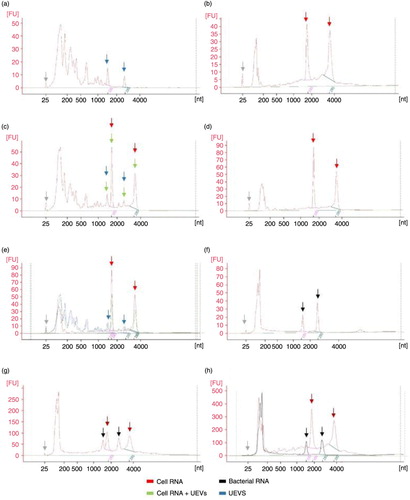
After superimposing the electropherogram profiles of UEVs (a), cellular RNA (b) and UEVs+cellular RNA (c), we noticed that peaks from UEVs (blue arrows) are erroneously identified by software as 18s and 28s (e). Moreover, their position on the electropherogram indirectly suggested that those 2 peaks could be the prokaryotic 16s and 23s rRNA (Citation33). Thus, bacterial RNA was extracted using Norgen Kit (f) and once more Bioanalyzer algorithm for the PicoChip recognized them as 18s and 28s rRNA (black arrows). As further control, bacterial and cell RNA were mixed and run in the Bioanalyzer (g), which experimentally confirmed that bacterial 16s and 23s rRNA (black arrows) can be identified as 18s and 28s (red arrows) by the software without any eukaryotic positive control (h–overlapping of d and f).
Bacteria in urine
Bacterial presence in HFDa was confirmed with a growth plate method (Supplementary Fig. 2a). Further analysis of additional urine preparations confirmed that urine itself is a source of bacteria in HFDa of all samples studied (Supplementary Fig. 2b–d, Supplementary Table 1). To better understand the presence of bacteria in the urine and rationalize the concept of first urine catch versus midstream sample, we designed a method of consecutive urine collection in 50 ml tubes (Supplementary Fig. 1b). Exclusion of the first catch and collection of the midstream was found not sufficient to avoid bacterial presence in the sample (Supplementary Table 1). Moreover, we confirmed that series of differential centrifugations (17,000 g; 200,000 g; a and 5) are not fully efficient for bacterial sedimentation either (for details, see legend of Supplementary Fig. 3). Thus, we established that acceptable limit for bacteria in UEV-enriched samples should not exceed 103 colony forming units per mililitre (CFU/ml) (Supplementary Fig. 4).
For this reason, we investigated different methods to limit the bacterial presence in the HFDa samples prior to the comparative analysis of different RNA extraction methods.
Bacteria removal with filtration
The filtration through 0.22 µm Steritop filter was investigated for bacterial removal from SN2,000 g urine samples since the conventional syringe filters failed to produce a filtrate starting from crude urine as well as SN2,000 g. Negative result for all 3 HFDa0.22 µm (a) confirmed the lack of bacteria in filtered urine (filtrate; Supplementary Fig. 5b) although crude urine was clearly positive (Supplementary Fig. 5a). Microbiological analysis confirmed that bacteria remained on the 0.22 µm filter (Supplementary Fig. 5c).
Fig. 3. Performance of 0.22 µm filtration and its impact on HFDa fraction (referred as HFDa0.22 µm). (a) Microbiological testing of fractions HFDa0.22 µm experiment performed in triplicate; (b) SDS-PAGE stained with colloidal Coomassie; (c) western blots with anti-ALIX, anti-TSGl0l; and (d) anti-DPPlV, anti-CD63; (e) PicoChip, (f) Small Chip electropherograms from HFDa0.22 µm RNA extracted with Norgen Kit; ST-molecular weight marker, 1,2,3 – HFDa0.22 µm fractions (triplicate), 4,5,6 – SDS elution from Steritop filters (triplicate), kDa – kilodalton.
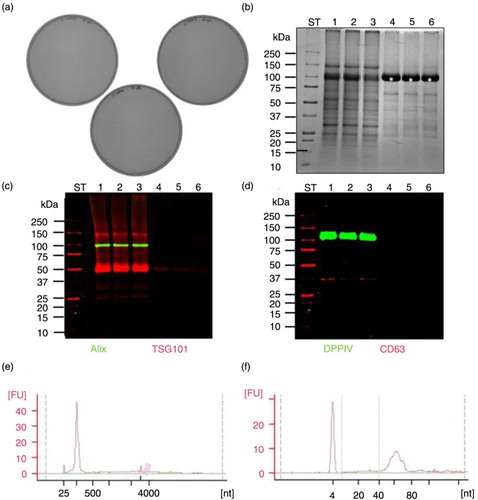
The analysis of sediment composition remained on filter versus HFDa0.22 µm revealed significant advantages of the method. Excess of the most abundant protein in urine, Tamm-Horsfall (THP) glycoprotein, also known as uromodulin (asterisk), remained on the filter as suggested by the colloidal Coomassie stained gel (b). Moreover, western blot analysis showed positive signal for the vesicle markers Alix, dipeptidyl peptidase IV (DPPIV) and CD63 in HFDa0.22 µm fractions and only tumour susceptibility gene 101 (TSG101) remained positive for filter sediment as well (c and d). This shows that while bacteria remain in the filter, UEVs, especially exosomes, mostly pass it to the HFD step. However, it is notable that Steritop filtration method is vacuum pressure dependent. Moreover, filtration of large volumes of urine like 24 h collection can be time-consuming, and the filter may progressively loose its efficiency (often completely clogged after 150–200 ml of urine) depending on the viscosity of the sample.
RNA extracted from filtrate HFDa0.22 µm using Norgen Kit does not present ribosomal RNA peaks, but only small RNA enriched fraction (e). Thus, Small Chip (Agilent Technologies) has been applied for detailed qualitative analysis (f). The profile revealed the presence of microRNA fraction (37% of total small RNA fraction) but also enrichment of 40–80 nucleotide in length species.
Use of purification tablets as a safe antimicrobial agent and comparative analysis with filtration method
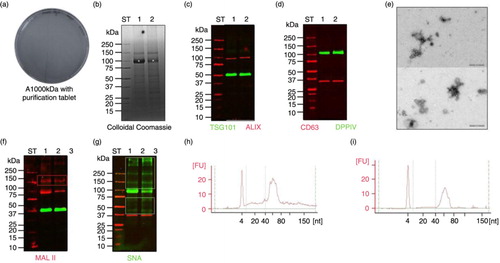
Purification tablets were used as an easy alternative to 0.22 µm filtration in order to efficiently limit bacterial presence in supernatant 2,000 g and limit the interference in EV–enriched fraction HFDatablet. The HFDatablet did not show any growth colonies as the modified cultured-based technique revealed (a). Analysis of protein pattern and western blots with antibodies for vesicle-specific markers (TSG101 and Alix) and antibodies for membrane protein (DPPIV) suggest that purification tablets do not affect the sample properties (no signs of degradation; b and d). Also transmission electron microskopy (TEM) result confirmed preserved vesicle integrity (e). Moreover, as colloidal Coomassie staining revealed, the protein pattern of HFDatablet (b, Lane 1) appears closely identical to the HFDa0.22 µm (b, Lane 2), except for the amounts of uromodulin (white asterisk) recovered in both HFDa's. The difference in uromodulin distribution is most likely due to high amounts of this protein remaining on Steritop filter (f, Lane 4 to 6) and thus removed from final HFDa0.22 µm (f, Lane 2). Lectin blots with Sambucus nigra lectin (SNA) and Maackia amurensis lectin II (MAL II), both specific for sialic acid residues of glycans, revealed similar patterns in both fractions after excluding uromodulin band from analysis because of the different recovery of this protein in both HFDa's (e and f). Interestingly, sialic acids are highly sensitive for oxidative stress (Citation34); therefore, the result suggests that the purification tablets used presumably do not generate oxidative species, which can react with glycoproteins and nucleic acid for example. In fact, small RNA electropherograms of these 2 samples showed no differences in the profile in terms of quality and both revealed the enrichment of nucleotide fractions 40–80 in length. Relative quantities of microRNA in HFDatablet and HFDa0.22 µm were closely similar, 38 and 37% of total small RNA fractions, respectively.
Fig. 4. Performance of HFD with purification tablet treated SN2,000g (HFDatablet). (a) Microbiological testing of HFDatablet fraction; (b) SDS-PAGE stained with colloidal Coomassie; (c) western blots with anti-ALIX, anti-TSG101; and (d) anti-DPPIV, anti-CD63; (e) transmission electron microscopy picture of vesicles in HFDatablet fraction; lectin blots with (f) MAL II and (g) SNA; (h) Small RNA Chip profiles of HFDatablet and (i) HFDa0.22 µm. ST-molecular weight marker, 1 – HFDatablet, 2 – HFDa0.22 µm, kDa – kilodalton; white asterisk – uromodulin (Tamm-Horsfall protein); red rectangle – MAL II recognized glycoproteins; green rectangle – SNA recognized glycoproteins.
Fraction HFDtablet used for RNA extraction using different methods
UEVs (HFDatablet fraction) were enriched from 5,000 ml of pooled urine with modified HFD protocol including colloidal silver treatment of SN2,000 g. The HFDtablet was split into 21 aliquots that were used for RNA extraction using 7 different techniques/kits. Each aliquot used for this study yields 100 µg of protein being an equivalent of 230 ml of starting volume of urine. For each method, a sample triplicate was used.
The 7 used methods have been classified into 5 categories: (a) phenol-based methods: the TRIzol protocol and FastRNA; (b) phenol- and column-based methods: Qiagen and Quick RNA; (c) lysis buffer- and column-based methods: Nucleo-Spin and Norgen; (d) lysis-, phenol- and column-based method: mirVana. Among them, only Norgen is an UEV dedicated extraction kit.
All samples were carefully checked for RNA concentration using Nanodrop ND-1000 spectrophotometer and Qubit fluorometer. The Nanodrop results based on 260 nm wavelength absorbance are reliable for values higher than 0.15 (A260 nm>0.15). Although Nanodrop software calculated RNA concentration values for all measurements, only FastRNA results can be considered reliable under this condition (Table ). Values in Table I expressed in red colour are considered as unreliable. Moreover, optical density (OD) readings vary significantly from the values established for the good purity cellular RNA and thus, suggest the presence of contaminant in the samples (Citation35). Importantly, the variation is repeatable and especially OD 260/230 (less than 0.5) is reproducible for all types of protocols indicating the biological source of the issue. In contrast, FastRNA-based extraction of cellular RNA provided OD 260/280=1.96 and OD 260/230=2.14 and thus excluded the malfunction of Nanodrop device or improper performance of isolation protocols.
Table I. RNA yield results.
Considering that Qubit fluorescence dye is claimed to be selective for RNA, the results from Qubit fluorometer seem to be more reliable and accurate (Table ). Moreover, quantification obtained from Bioanalyzer follows Qubit results and confirms strong error carried in Nanodrop outcome. Among the 7 methods of RNA extraction, only Quick RNA isolated samples failed to assess the RNA concentrations using fluorescent dye. Moreover, Qubit results show lower variation of triple measure of each sample. The lowest results in terms of quantity have been obtained for TRIzol method (65.04±7.98 ng), but the difference is not significant.
Other phenol-based methodologies provided only slightly higher yields (Qiagen, FastRNA and mirVana: 78.95±7.37, 76.72±2.94 and 74.18±12.07 ng, respectively). Both lysis buffer- and column-based protocols (Norgen and Nucleo-Spin, RNA yield: 91.33±3.09 and 82.67±2.97 ng, respectively) have extracted the highest quantities of RNA.
Isolated RNA samples were also analyzed in RNA 6,000 PicoChip (, Supplementary Fig. 6). Profiles do not present high 18s and 28s rRNA peaks characteristic for cell RNA (a–d). The bulk of RNA was concentrated in small RNA region; thus, Small Chip was hired for a detailed analysis (, Supplementary Fig. 7). Among the 7 different extraction methods, 6 present significant enrichment of 40–80 nucleotide in length sequences of small RNA (a–e and g). Phenol-based method (Quick RNA) failed to extract RNAs of UEVs as previously suggested by Qubit results (f).
Fig. 5. Pico 6000 RNA Chip electropherograms run in Agilent 2100 Bioanalyzer for RNA samples coming from UEVs extracted with different methods: (a) FastRNA; (b) Qiagen; (c) TRIzol; (d) Norgen; (e) Nucleo-Spin; (f) Quick RNA; (g) mirVana; nt – nucleotide size, grey arrow – marker peak, FU – fluorescence units.
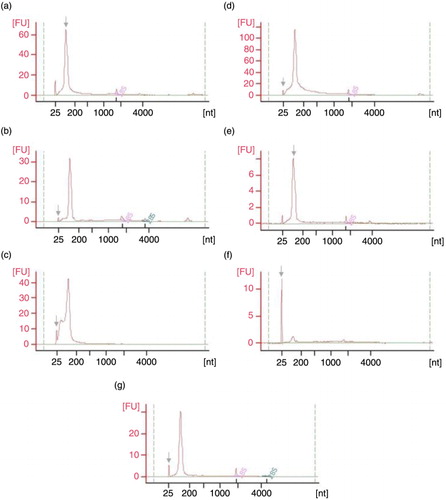
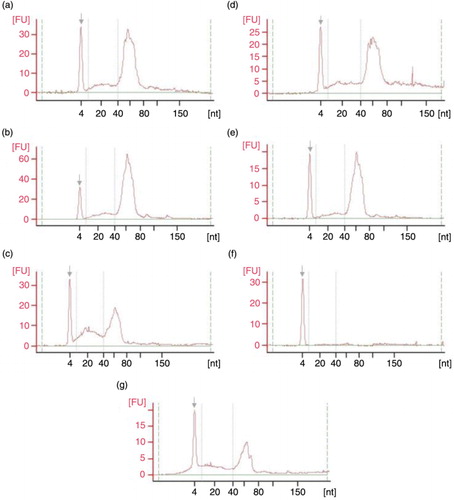
Fig. 6. Small RNA Chip electropherograms run in Agilent 2100 Bioanalyzer for RNA samples coming from UEVs extracted with different methods: (a) FastRNA; (b) Qiagen; (c) TRIzol; (d) Norgen; (e) Nucleo-Spin; (f) Quick RNA; (g) mirVana; nt – nucleotide size, grey arrow – marker peak, FU – fluorescence units.
Discussion
UEVs carry an abundance of proteins and nucleic acids species characteristic for their cells of origin along the kidney and urogenital tract. Thus, many lines of evidence highlight urinary vesicles as an ideal source to discover early stage biomarkers for kidney damage and for systemic disease (Citation36, Citation37).
Recently, the major focus in this field has been shifted on UEV RNA species, especially microRNA due to their defined regulatory role in gene expression (Citation8). A number of publications have compared miRNA expression associated with UEVs among patients with different kidney and urinary tract diseases. For example, Ramezani et al. proposed potential biomarkers for focal segmental glomerulosclerosis (mir-155, mir-1915 and mir-663) (Citation38) and Barutta et al. revealed a novel candidate marker for patients with incipient diabetic nephropathy (mir-145) (Citation12). However, limited attention is paid to UEV RNA quality, drawbacks of extraction methodologies and sample's total UEV composition, which introduce variables affecting reliability of the results (Citation18, Citation19) (Citation39, Citation40).
The guidelines for cellular RNA quality assessment are widely known (e.g. OD on 260/280 and 260/230 nm wavelengths ratio, RIN) and a standard set of devices like Nanodrop and Bioanalyzer are in use for this purpose (Citation21). In consequence, extracellular vesicles (EVs) were expected to follow the characteristic cellular RNA profile (with major peaks of ribosomal RNA (Citation41). However, some recent publications report that cellular RNA profile may be irrelevant to all EVs (Citation42). This variability can possibly be explained by different cellular origin of the vesicles. On the other hand, it is challenging to interpret the discrepancies of results coming from the same origin, UEVs. Miranda et al. showed the presence of 18s and 28s rRNA peaks in RNA profile from UEVs (Citation7, Citation13). In contrast, enrichment of small RNA fraction with no ribosomal RNA in UEVs also has been reported (Citation12, Citation14) (Citation19).
In order to systematically approach these and other issues, we used HFD to enrich the whole population of UEVs. HFD protocol allows harvesting UEVs in efficient, easy and reproducible manner, which standardize the physico-chemical parameters of the vesicle fraction (HFDa) (Citation15). Moreover, HFD can easily process a large volume of urine (300–500 ml per device) in a relatively short time as presented in our previous publication and thus can provide sufficient amounts of UEVs for quantifiable RNA yields (in the range of dozen nanograms of RNA).
In our first set of experiments designed to check potential degradation of RNA during the extraction, we found that ribosomal RNA was identified by software in HFDa (a) abiding in published results (Citation7). However, after spike-in of cellular RNA into HFDa (introduced to analyze possible degradation during the extraction step), we found 4 predominant peaks instead of 2 (c). Considering this result, but also lack of degradation in re-extracted cellular RNA (d) and retention time of 2 additional peaks, we suspected those were of prokaryotic origin (16s and 23s ribosomal RNA). Indeed, it was repeatedly proven that bacterial ribosomal RNA can be mistakenly identified as 18s and 28s if eukaryotic assay is in use (f and h) and that rRNAs from HFDa do not have eukaryotic origin.
Microbial analysis (mEQUC) of HFDa fraction, indeed, confirmed the presence of bacteria (Supplementary Fig. 2a) and raised a question about the origin of these bacteria. Moreover, our further analysis confirmed that urine itself is, invariably, a source of bacteria in the vesicle-enriched fraction (Supplementary Fig. 2). Accordingly, bacteria are easily transferred to the urine sample from skin and distal parts of genital organs but also bladder microbiota should be taken into account (Citation43–Citation46). We found that neither the catch of the midstream sample nor the ultracentrifugation speeds can remove bacteria with up to 100% efficiency (Supplementary Table 1, Supplementary Fig. 3). Consecutive collection study revealed the presence of bacteria in the whole stream of urine samples (Supplementary Table 1). Furthermore, we showed that the classical method of differential centrifugation is also ineffective to remove bacteria that are still present in the ultracentrifugation pellet (Supplementary Fig. 3). We also established the limit of detection (104 CFU/ml) in bacterial contamination for Bioanalyzer and SDS-PAGE stained with colloidal Coomassie method. Although in our experiments the bacteria contamination in pellets 200,000 g were ranging 102–103 CFU/ml starting from 35 ml of urine, the values are dangerously close to the established limit of detection.
Thus, we searched for an efficient method to limit the bacterial presence in the final UEV-enriched samples coming from a large volume of urine and in relation to the HFD method.
Here we chose to study the efficiency of filtration through 0.22 µm membrane for removing bacteria. Indeed, filtration resulted in the prevention of bacterial transfer and growth in the HFDa sample. This procedure also resulted in minor loss of TSG101 positive vesicles (exosomes) that were either too big to pass through the membrane pores or simply entrapped by polymers of THP (uromodulin) (). However, vesicle positive for Alix, CD63 and DPPIV were detected in the pass-through filtrate only. The use of nanofiltering apparently is efficient in removing bacteria; however, it is not sufficient for large volume of urine and leads to the loss of some type of UEVs TSG101 positive. Notably, THP easily clogs the filtration membrane thus slowing down the process remarkably for the starting volumes larger than 150–200 ml.
As an alternative method to filtration, the addition of chemicals to prevent bacterial growth in SN2,000 g was investigated. The colloidal silver and troclosene tablet is used for drinking water purification. This method is safe for sample as the TEM results showed intact vesicles and we found no signs of oxidative stress on sialic acid modification (d–f). Moreover, the RNA profile in the Bioanalyzer was very similar to the 0.22 µm filtration approach. Although this method does not remove bacteria remaining in SN2,000 g or potentially present outer membrane vesicles, it prevents further bacterial growth during HFD performance. Moreover, it is efficiently applicable for large volume of urine, thus was used for our further study. The HFD approach combined with chemical prevention of further growth resulted in UEV yields allowing comprehensive analysis of different RNA extraction methodologies from equal UEV samples.
RNA quality and quantity analysis
Reported OD issue related to Nanodrop measures can be explained with the RNA sample contamination with phenol or guanidine. However, the issue is related to UEV sample only and does not occur in cellular RNA extraction suggesting a biological source of the contaminate (e.g. yellow pigments that still remain in HFDa in minority) or influence of RNA composition enriched with guanine (OD 260/280=1.15). Independently from the nature of the issue, it significantly affects and overestimates the Nanodrop measures for UEV-derived RNA.
The quality results in PicoChip (Agilent Technologies) from all methodologies except Quick RNA confirmed the enrichment of small RNA in UEVs (, Supplementary Fig. 6), as shown by other groups (Citation12, Citation14) (Citation17). The detailed difference between the methods could only be pointed by using the sensitive Small RNA Chip technique (Agilent Technologies; , Supplementary Fig. 7). Although repeatable results (in terms of quality) were obtained within each RNA extraction protocols (n=3), comparison between these methodologies highlighted some minor discrepancies in the extraction performance. Among all methods, RNA profile similarities can be seen and these include high peak in tRNA fraction (40–80 nucleotide size) together with relatively high enrichment in microRNA fraction (18–25 nucleotide size). However, results provided by Small Chip analyses revealed difference in relative content of miRNA referring to total RNA in the sample, ranging from 30% (Nucleo-Spin) up to 65% (TRIzol; Table ).
Referring to our results, the method of choice should provide sufficient RNA yield allowing performance of quality plus quantity assessment and proper downstream analytics together (next-generation sequencing and/or whole profile qPCR arrays) including eventual technical replica. Here, we proved that 230 ml allowed to obtain the maximum of 93.33 ng RNA in Norgen approach. Thus, we strongly emphasize the need to isolate UEVs from larger volume of urine, preferentially higher than 250 ml. Also for this purpose we advocate the HFD method as time-efficient and with highly repeatable performance.
However, we like to highlight that further study of next-generation sequencing should be performed, if possible, on samples coming from all available RNA extraction methodologies. This study allow us to identify the best RNA extraction method for UEVs, which can provide the enrichment of all available RNA species and exclude the false-negative identifications.
The aim of our study was to compare various RNA isolation methods and select the prime RNA profile to allow further studies, for example, to use UEVs as a source for novel disease biomarkers. The results emphasize the need for proper sample handling and treatment including appropriate precautions to limit bacterial presence in the UEV fraction. Bacterial contribution to subsequent UEV results should be carefully considered. Second, the most appropriate RNA extraction method should be chosen with great care because standardized protocols for UEV RNA isolation does not exist as yet. Each extraction method should be supported with RNA quality assessment as we confirmed the presence of characteristic urinary RNA profile that significantly differs from cellular RNA profile pattern. Finally, we also highlight the need to harvest the UEVs from a larger volume of samples and show the superior performance of HFD for this purpose.
Conflict of interest and funding
The authors report no conflict of interests.
Supplementary Figure 1
Download JPEG Image (108.3 KB)
Supplementary Figure 2
Download JPEG Image (177 KB)
Supplementary Figure 3
Download JPEG Image (218.5 KB)
Supplementary Figure 4
Download JPEG Image (147.1 KB)
Supplementary Figure 5
Download JPEG Image (32.5 KB)
Supplementary Figure 6
Download JPEG Image (128.3 KB)
Supplementary Figure 7
Download JPEG Image (138.5 KB)
Supplementary Table 1
Download JPEG Image (119.1 KB)
Supplementary Material and Methods
Download MS Word (19.2 KB)Acknowledgements
The authors thank S. Nestel, G. Calzaferri and S. Aherne for their technical assistance and Clair Gallagher for proofreading and editing the manuscript. This study was supported by a European Union grant UroSense (#286 386).
Notes
To access the supplementary material to this article, please see Supplementary files under ‘Article Tools’.
Related Research Data
References
- Gámez-Valero A, Lozano-Ramos SI, Bancu I, Lauzurica-Valdemoros R, Borràs FE. Urinary extracellular vesicles as source of biomarkers in kidney diseases. Front Immunol. 2015; 6: doi: http://dx.doi.org/10.3389/fimmu.2015.00006.
- Gould SJ, Raposo G. As we wait: coping with an imperfect nomenclature for extracellular vesicles. J Extracell Vesicles. 2013; 2(20389): doi: http://dx.doi.org/10.3402/jev.v2i0.20389.
- Zubiri I, Posada-Ayala M, Sanz-Maroto A, Calvo E, Martin-Lorenzo M, Gonzalez-Calero L, etal. Diabetic nephropathy induces changes in the proteome of human urinary exosomes as revealed by label-free comparative analysis. J Proteomics. 2014; 96: 92–102. doi: http://dx.doi.org/10.1016/j.jprot.2013.10.037 [PubMed Abstract].
- Musante L, Tataruch D, Gu D, Liu X, Forsblom C, Groop PH, etal. Proteases and protease inhibitors of urinary extracellular vesicles in diabetic nephropathy. J Diabetes Res. 2015; 2015: 289734, doi: http://dx.doi.org/10.1155/2015/289734 [PubMed CentralFull Text].
- Valadi H, Ekström K, Bossios A, Sjöstrand M, Lee JJ, Lötvall JO. Exosome-mediated transfer of mRNAs and microRNAs is a novel mechanism of genetic exchange between cells. Nat Cell Biol. 2007; 9: 654–9. [PubMed Abstract].
- Dear JW, Street JM, Bailey MA. Urinary exosomes: a reservoir for biomarker discovery and potential mediators of intrarenal signalling. Proteomics. 2013; 13: 1572–80. doi: http://dx.doi.org/10.1002/pmic.201200285 [PubMed Abstract].
- Miranda KC, Bond DT, McKee M, Skog J, Păunescu TG, Da Silva N, etal. Nucleic acids within urinary exosomes/microvesicles are potential biomarkers for renal disease. Kidney Int. 2010; 78: 191–9. doi: http://dx.doi.org/10.1038/ki.2010.106 [PubMed Abstract] [PubMed CentralFull Text].
- Reinhart BJ, Slack FJ, Basson M, Pasquinelli AE, Bettinger JC, Rougvie AE, etal. The 21-nucleotide let-7 RNA regulates developmental timing in Caenorhabditis elegans. Nature. 2000; 403: 901–6. [PubMed Abstract].
- Patel V, Noureddine L. MicroRNAs and fibrosis. Curr Opin Nephrol Hypertens. 2012; 21: 410–6. doi: http://dx.doi.org/10.1097/MNH.0b013e328354e559 [PubMed Abstract] [PubMed CentralFull Text].
- Noureddine L, Hajarnis S, Patel V. MicroRNAs and polycystic kidney disease. Drug Discov Today Dis Models. 2013; 10: 137–e43.
- Gildea JJ, Seaton JE, Victor KG, Reyes CM, Bigler Wang D, Pettigrew AC, etal. Exosomal transfer from human renal proximal tubule cells to distal tubule and collecting duct cells. Clin Biochem. 2014; 47: 89–94. doi: http://dx.doi.org/10.1016/j.clinbiochem.2014.06.018 [PubMed Abstract].
- Barutta F, Tricarico M, Corbelli A, Annaratone L, Pinach S, Grimaldi S, etal. Urinary exosomal microRNAs in incipient diabetic nephropathy. PLoS One. 2013; 8: e73798. doi: http://dx.doi.org/10.1371/journal.pone.0073798 [PubMed CentralFull Text].
- Miranda KC, Bond DT, Levin JZ, Adiconis X, Sivachenko A, Russ C, etal. Massively parallel sequencing of human urinary exosome/microvesicle RNA reveals a predominance of non-coding RNA. PLoS One. 2014; 9: e96094. doi: http://dx.doi.org/10.1371/journal.pone.0096094 [PubMed CentralFull Text].
- Lv LL, Cao Y, Liu D, Xu M, Liu H, Tang RN, etal. Isolation and quantification of microRNAs from urinary exosomes/microvesicles for biomarker discovery. Int J Biol Sci. 2013; 9: 1021–31. doi: http://dx.doi.org/10.7150/ijbs.6100 [PubMed Abstract] [PubMed CentralFull Text].
- Musante L, Tataruch D, Gu D, Benito-Martin A, Calzaferri G, Aherne S, etal. A simplified method to recover urinary vesicles for clinical applications, and sample banking. Sci Rep. 2014; 4: 7532. doi: http://dx.doi.org/10.1038/srep07532 [PubMed CentralFull Text].
- Eldh M, Lötvall J, Malmhäll C, Ekström K. Importance of RNA isolation methods for analysis of exosomal RNA: evaluation of different methods. Mol Immunol. 2012; 50: 278–86. doi: http://dx.doi.org/10.1016/j.molimm.2012.02.001 [PubMed Abstract].
- Channavajjhala SK, Rossato M, Morandini F, Castagna A, Pizzolo F, Bazzoni F, etal. Optimizing the purification and analysis of miRNAs from urinary exosomes. Clin Chem Lab Med. 2014; 52: 345–54. doi: http://dx.doi.org/10.1515/cclm-2013-0562 [PubMed Abstract].
- Alvarez ML, Khosroheidari M, Kanchi Ravi R, DiStefano JK. Comparison of protein, microRNA, and mRNA yields using different methods of urinary exosome isolation for the discovery of kidney disease biomarkers. Kidney Int. 2012; 82: 1024–32. doi: http://dx.doi.org/10.1038/ki.2012.256 [PubMed Abstract].
- Cheng L, Sun X, Scicluna BJ, Coleman BM, Hill AF. Characterization and deep sequencing analysis of exosomal and non-exosomal miRNA in human urine. Kidney Int. 2014; 86: 433–44. doi: http://dx.doi.org/10.1038/ki.2013.502 [PubMed Abstract].
- Li M, Zeringer E, Barta T, Schageman J, Cheng A, Vlassov AV. Analysis of the RNA content of the exosomes derived from blood serum and urine and its potential as biomarkers. Philos Trans R Soc Lond B Biol Sci. 2014; 369: 20130502. doi: http://dx.doi.org/10.1098/rstb.2013.0502.
- Bustin SA, Benes V, Garson JA, Hellemans J, Huggett J, Kubista M, etal. The MIQE guidelines: minimum information for publication of quantitative real-time PCR experiments. Clin Chem. 2009; 55: 611–22. doi: http://dx.doi.org/10.1373/clinchem.2008.112797 [PubMed Abstract].
- Hill AF, Pegtel DM, Lambertz U, Leonardi T, O'Driscoll L, Pluchino S, etal. ISEV position paper: extracellular vesicle RNA analysis and bioinformatics. J Extracell Vesicles. 2013; 23: 2. doi: http://dx.doi.org/10.3402/jev.v2i0.22859.
- Parikh VN, Chan SY. Analysis of microRNA niches: techniques to measure extracellular microRNA and intracellular microRNA in situ. Methods Mol Biol. 2013; 1024: 157–72. doi: http://dx.doi.org/10.1007/978-1-62703-4531_12 [PubMed Abstract] [PubMed CentralFull Text].
- Inman BA, Etienne W, Rubin R, Owusu RA, Oliveira TR, Rodriques DB, etal. The impact of temperature and urinary constituents on urine viscosity and its relevance to bladder hyperthermia treatment. Int J Hyperthermia. 2013; 29: 206–10. doi: http://dx.doi.org/10.3109/02656736.2013.775355 [PubMed Abstract].
- Momen-Heravi F, Balaj L, Alian S, Trachtenberg AJ, Hochberg FH, Skog J, etal. Impact of biofluid viscosity on size and sedimentation efficiency of the isolated microvesicles. Front Physiol. 2012; 3: 162. doi: http://dx.doi.org/10.3389/fphys.2012.00162 [PubMed Abstract] [PubMed CentralFull Text].
- Reddi KK. Purification and properties of a ribonuclease in human urine that hydrolyses polycytidylic acid. Prep Biochem. 1977; 7: 283–99. [PubMed Abstract].
- Murai K, Yamanaka M, Akagi K, Anai M, Mukai T, Omae T. Purification and properties of deoxyribonuclease from human urine. Biochim Biophys Acta. 1978; 517: 186–94. [PubMed Abstract].
- Mitchell PJ, Welton J, Staffurth J, Court J, Mason MD, Tabi Z, etal. Can urinary exosomes act as treatment response markers in prostate cancer?. J Transl Med. 2009; 7: 4. doi: http://dx.doi.org/10.1186/1479-5876-7-4 [PubMed CentralFull Text].
- Cvjetkovic A, Lötvall J, Lässer C. The influence of rotor type and centrifugation time on the yield and purity of extracellular vesicles. J Extracell Vesicles. 2014; 3: 23111, doi: http://dx.doi.org/10.3402/jev.v3.23111 [PubMed CentralFull Text].
- Verplaetse H, Verbeeck RM, Verbaeys A, Oosterlinck W. Solubility of calcium oxalate monohydrate and hydroxyapatite in EDTA solutions. J Urol. 1986; 135: 608–11. [PubMed Abstract].
- Hilt EE, McKinley L, Pearce MM, Rosenfeld AB, Zilliox MJ, Mueller ER, etal. Urine is not sterile: use of enhanced urine culture techniques to detect resident bacterial flora in the adult female bladder. J Clin Microbiol. 2014; 52: 871–6. doi: http://dx.doi.org/10.1128/JCM.02876-13 [PubMed Abstract] [PubMed CentralFull Text].
- Chomczynski P, Sacchi N. Single-step method of RNA isolation by acid guanidinium thiocyanatephenol-chloroform extraction. Anal Biochem. 1987; 162: 156–9. [PubMed Abstract].
- Kuschel M. Analysis of messenger RNA using the Agilent 2100 Bioanalyzer and the RNA 6000 LabChip® Kit. 04/2000. Application Note. Available from: https://www.genome.duke.edu/sites/default/files/AgilentmRNA.pdf.
- Neyra C, Paladino J, Le Borgne M. Oxidation of sialic acid using hydrogen peroxide as a new method to tune the reducing activity. Carbohydr Res. 2014; 386: 92–8. doi: http://dx.doi.org/10.1016/j.carres.2014.01.007 [PubMed Abstract].
- T009-Technical bulletin Nanodrop 1000 & 8000; 260/280 and 260/230 Ratios. Wilmington, Delaware: Thermo Scientific. Available from: http://www.nanodrop.com/Library/T009-NanoDrop%201000-&-NanoDrop%208000-Nucleic-Acid-Purity-Ratios.pdf.
- Ben-Dov IZ, Whalen VM, Goilav B, Max KE, Tuschl T. ell and microvesicle urine microRNA deep sequencing profiles from healthy individuals: observations with potential impact on biomarkers studies. PLoS One. 2016; 11: e0147249. doi: http://dx.doi.org/10.1371/journal.pone.0147249.
- Gonzalez E, Falcon-Perez JM. Cell-derived extracellular vesicles as a platform to identify low-invasive disease biomarkers. Expert Rev Mol Diagn. 2015; 15: 907–23. doi: http://dx.doi.org/10.1586/14737159.1043272 [PubMed Abstract].
- Ramezani A, Devaney JM, Cohen S, Wing MR, Scott R, Knoblach S, etal. Circulating and urinary microRNA profile in focal segmental glomerulosclerosis: a pilot study. Eur J Clin Invest. 2015; 45: 394404. doi: http://dx.doi.org/10.1111/eci.12420.
- Redshaw N, Wilkes T, Whale A, Cowen S, Huggett J, Foy CA. A comparison of miRNA isolation and RTqPCR technologies and their effects on quantification accuracy and repeatability. Biotechniques. 2013; 54: 155–64. doi: http://dx.doi.org/10.2144/000114002 [PubMed Abstract].
- Rekker K, Saare M, Roost AM, Kubo AL, Zarovni N, Chiesi A, etal. Comparison of serum exosome isolation methods for microRNA profiling. Clin Biochem. 2014; 47: 135–8. doi: http://dx.doi.org/10.1016/j.clinbiochem.2013 [PubMed Abstract].
- Zeringer E, Li M, Barta T, Schageman J, Pedersen KW, Neurauter A, etal. Methods for the extraction and RNA profiling of exosomes. World J Methodol. 2013; 3: 11–18. doi: http://dx.doi.org/10.5662/wjm.v3.i1.11 [PubMed Abstract] [PubMed CentralFull Text].
- Crescitelli R, Lässer C, Szabó TG, Kittel A, Eldh M, Dianzani, etal. Distinct RNA profiles in subpopulations of extracellular vesicles: apoptotic bodies, microvesicles and exosomes. J Extracell Vesicles. 2013; 12: 2. doi: http://dx.doi.org/10.3402/jev.v2i0.20677.
- Lewis DA, Brown R, Williams J, White P, Jacobson SK, Marchesi JR, etal. The human urinary microbiome; bacterial DNA in voided urine of asymptomatic adults. Front Cell Infect Microbiol. 2013; 3: 41. doi: http://dx.doi.org/10.3389/fcimb.2013.00041.
- Fouts DE, Pieper R, Szpakowski S, Pohl H, Knoblach S, Suh MJ, etal. Integrated next-generation sequencing of 16S rDNA and metaproteomics differentiate the healthy urine microbiome from asymptomatic bacteriuria in neuropathic bladder associated with spinal cord injury. J Transl Med. 2012; 10: 174. doi: http://dx.doi.org/10.1186/1479-5876-10-174 [PubMed CentralFull Text].
- Frazee BW, Enriquez K, Ng V, Alter H. Abnormal urinalysis results are common, regardless of specimen collection technique, in women without urinary tract infections. J Emerg Med. 2015; 48: 706–11. doi: http://dx.doi.org/10.1016/j.jemermed.2015.02.020 [PubMed Abstract].
- Wolfe AJ, Toh E, Shibata N, Rong R, Kenton K, Fitzgerald M, etal. Evidence of uncultivated bacteria in the adult female bladder. Clin Microbiol. 2012; 50: 1376–83. doi: http://dx.doi.org/10.1128/JCM.05852-11.