
Abstract
Diagnostic methods that focus on the extracellular vesicles (EVs) present in saliva have been attracting great attention because of their non-invasiveness. EVs contain biomolecules such as proteins, messenger RNA (mRNA) and microRNA (miRNA), which originate from cells that release EVs, making them an ideal source for liquid biopsy. Although there have been many reports on density-based fractionation of EVs from blood and urine, the number of reports on EVs from saliva has been limited, most probably because of the difficulties in separating EVs from viscous saliva using density gradient centrifugation. This article establishes a protocol for the isolation of EVs from human saliva using density gradient centrifugation. The fractionated salivary EVs were characterized by atomic force microscopy, western blot and reverse transcription polymerase chain reaction. The results indicate that salivary EVs have a smaller diameter (47.8±12.3 nm) and higher density (1.11 g/ml) than EVs isolated from conditioned cell media (74.0±23.5 nm and 1.06 g/ml, respectively). Additionally, to improve the throughput of density-based fractionation of EVs, the original protocol was further modified by using a fixed angle rotor instead of a swinging rotor. It was also confirmed that several miRNAs were expressed strongly in the EV-marker-expressing fractions.
To access the supplementary material to this article, please see Supplementary files under ‘Article Tools’.
The development of less invasive and more sensitive diagnostic methods is requisite for the improvement of quality of life in modern society. In this context, saliva is one of the best sources of non-invasive diagnosis because it can be collected without the use of a syringe. Moreover, it is expected that information obtained from saliva can be used for diagnosing not only oral diseases but also systemic diseases (Citation1, Citation2). However, the complex nature of saliva has been hindering the establishment of robust salivary-based diagnostic methods. Whole saliva is composed of a mixture of major and minor salivary gland secretions, gingival crevicular fluids, cell debris and microorganisms (Citation3); it is highly viscous because of mucins produced by epithelial tissues (Citation3). It contains a few highly abundant proteins such as amylase, proline-rich proteins, statherin, histatins, cystatins and mucins (Citation2), which mask the low-abundance salivary biomarkers that have the potential to be useful for diagnoses (Citation4, Citation5).
Recently, extracellular vesicles (EVs) in saliva have been gathering attention as targets of diagnostic analyses (Citation6). EVs are small, membranous vesicles that are secreted from most cell types (Citation7, Citation8) and are involved in intercellular communication through exchange of proteins, nucleic acids and lipids between cells (Citation9). EVs carry information released from host cells and are found in body fluids, including saliva, making them ideal sources for body fluid-based diagnosis (Citation10). By focusing on the EVs in saliva, the “masking problem” by highly abundant proteins may well be avoided, which has already been supported by the comparative analyses of proteomes between whole saliva and abundant protein-depleted saliva (Citation5).
EVs are sometimes classified into subclasses, such as “exosomes,” “microvesicles” and “apoptotic bodies,” among others, based on their sizes, protein markers and other features; this has been proposed to represent presumed biogenetic pathways of these subclasses of vesicles (Citation11). However, the isolation methods and conditions for EVs differ markedly between research groups, and further studies should be conducted to reach a consensus on the subclassification of EVs. Current methods for the isolation of EVs include differential centrifugation (Citation12), density gradient centrifugation (Citation9), immunoaffinity capture (Citation13), size-exclusion chromatography (Citation14), polymer-based precipitation (Citation15) and others (Citation16). Among them, density gradient centrifugation has been considered the “gold standard” for the isolation of EVs (Citation17), in which EVs are separated from other biomolecules based on the differences in their densities. Generally, membranous vesicles have lower densities, whereas supramacromolecular complexes of proteins have higher densities (Citation18). EV fractions prepared by methods other than density gradient centrifugation often contain non-EV molecules, which may complicate the assessment of results (Citation5). In the developmental stage of diagnostic methods, the usage of highly enriched EVs is desirable. However, the current protocols for density gradient centrifugation-based EV isolation have been established for serum (Citation13), plasma (Citation19), urine (Citation20) and conditioned media (Citation18) but are not compatible with the isolation of EVs from other body fluids, such as milk (Citation21), cerebrospinal fluid (Citation22) and saliva (as shown below). As far as is known by the authors, all studies of salivary EVs that have been reported until now have used samples purified by differential centrifugation (Citation23–Citation29), gel filtration (Citation30), immunoaffinity capture (Citation31) and polymer-based precipitation methods (Citation32, Citation33).
In this work, to characterize well-defined salivary EVs, a protocol has been established that allows for the isolation of EVs from human saliva by density gradient centrifugation. By comparing the EVs isolated from saliva and culture cell supernatant, the smaller size and higher density of salivary EVs have been revealed. Additionally, to improve the throughput of sample processing and analysis, a modified isolation protocol has been established that has higher throughput than the conventional density gradient centrifugation method.
Materials and methods
Antibodies and reagents
The following anti-human antibodies and their dilution rates were used for western blot (WB) analyses: mouse anti-CD63 (Abcam, Cambridge, MA, USA; 1:1,000), mouse anti-CD133 (Abnova Corp., Taipei city, Taiwan; 1:1,000), rabbit anti-aquaporin 5 (AQP5) (Abcam; 1:500), mouse anti-β-actin (Sigma–Aldrich, St. Louis, MO, USA; 1:1,000), rabbit anti-CD26 (Abcam; 1:1,000), mouse anti-CD81 (EXBIO, Plaha, Czech; 1:1,000), mouse anti-EpCAM/TROP-1 (R&D Systems, Minneapolis, MN, USA; 1:1,000), rabbit anti-HSP70 (System Biosciences, Mountain View, CA, USA; 1:1,000), mouse anti-TSG101 (BD Transduction Laboratories, San Jose, CA, USA; 1:500), rabbit anti-CD44 (Sigma–Aldrich; 1:1,000), rabbit anti-CD24 (Santa Cruz Biotechnology, Dallas, TX, USA; 1:100) and mouse anti-CD9 (Abcam; 1:500). Secondary antibodies coupled to horseradish peroxidase were as follows: goat anti-rabbit IgG (H+L)-HRP conjugate (Bio-Rad, Hercules, CA, USA; 1:2,000), goat anti-mouse IgG [(H+L)-HRP conjugate (Bio-Rad; 1:2,000)] and rabbit anti-goat IgG (H+L)-HRP conjugate (Bio-Rad; 1:2,000). Iohexol (Nycodenz) and iodixanol (OptiPrep) purchased from Axis-Shield PoC (Oslo, Norway) were used as density gradient media. Each gradient medium was prepared in 0.02 M HEPES [4-(2-hydroxyethyl)-1-piperazine ethanesulfonic acid]/NaOH, pH 7.2 buffer.
Whole saliva collection and pretreatment
The investigations were approved by the medical ethics committee at the Japanese Foundation for Cancer Research (approval number: JFCR 2013-1112). Fifteen millilitres of whole saliva was collected from healthy volunteers for experiments shown in Figs. . In the modified protocol ( and ), 5 ml of whole saliva from 8 healthy volunteers (4 males and 4 females) with a mean age of 39±10 years (range, 28–57 years) was collected under standard conditions. Briefly, subjects were asked not to eat, drink or perform strenuous physical exercise for at least 1 h before saliva collection. Saliva samples were collected between 9:00 and 11:00 a.m. Unstimulated saliva samples were collected in a consistent manner into 50-ml CELLSTAR tubes (#227261, Greiner Bio-One, Kremsmünster, Austria) by spitting and were kept on ice. Immediately after saliva collection, samples were pretreated by filtration or sonication for the experiment shown in Supplementary Fig. 2. For filtration, commercial filters were investigated, including 0.45, 0.22 and 0.1-µm polyvinylidene difluoride (PVDF) membrane; 0.2-µm Posidyne membrane and 0.22-µm mixed cellulose esters membrane. For sonication, the closed-type sonication system (Bioruptor, Diagenode, Inc., Liege, Belgium), open-chip-type sonicator (250 Sonifier, Branson, Danbury, CT, USA) and bath-type sonicator (UC-0515A, Tokyo Choonpa Giken Co. Ltd, Tokyo, Japan) were used. The effectiveness of pretreatments was assessed by comparing silver staining patterns in sodium dodecyl sulphate–polyacrylamide gel electrophoresis (SDS–PAGE). For all other experiments, except the ones shown in Supplementary Figs. 1 and 2, saliva was pretreated by the closed-type sonication system (Bioruptor). The density for each fraction after ultracentrifugation was determined using a refractometer (RX-5000α, Atago Co. Ltd, Tokyo, Japan).
Protocols for EV preparation
Preparation from 15 ml whole saliva
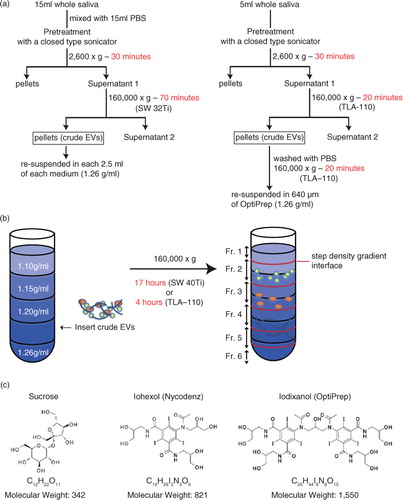
The schematic diagram of the procedures is shown in a (left). Fifteen millilitres of saliva was mixed with 15 ml of PBS (137 mM NaCl, 2.68 mM KCl, 8.10 mM Na2HPO4, 1.47 mM KH2PO4, pH 7.4 buffer), was pretreated as described above and was then centrifuged at 2,600×g for 30 min at 4°C (model 5500, Kubota, Osaka, Japan) to remove cells, bacteria and potential food debris. The supernatants were collected in 38.5-ml ultra-clear tubes (#344058, Beckman Coulter, Brea, CA, USA) and were centrifuged at 160,000×g for 70 min at 4°C (L-90K with SW32Ti rotor, Beckman Coulter) to yield crude EVs as pellets. The crude EVs were resuspended in 2.5 ml of either 2.0 M sucrose, 50% iohexol or 47% iodixanol in 0.02 M HEPES/NaOH, pH 7.2 buffer and inserted into a step gradient that comprised either from 2.5 ml of 2.0, 1.6, 1.18 and 0.8 M sucrose; 50, 40, 30, and 20% iohexol or 47, 37, 28 and 18% iodixanol solutions in 14-ml ultra-clear tubes (#344060, Beckman Coulter), as illustrated in b. Then, within 1 h, the tubes were centrifuged at 160,000×g for 17 h at 4°C (L-90K with SW40Ti rotor, Beckman Coulter). After centrifugation, first, 1.25 ml of top fraction was collected as fraction 1, and then four 2.5 ml fractions flanking the interphase separating 2 neighbouring were collected. Finally, 1.25 ml of bottom fraction was collected as fraction 6 (b). The density of each fraction after centrifugation was measured by a refractometer (RX-5000α, Atago Co. Ltd). The collected fractions were stored at 4°C until analysed.
Fig. 1. (a) Flow charts for the EV isolation procedure based on density gradient centrifugation. The original procedure is shown on the left, in which 15 ml of saliva was fractionated by 17 h of centrifugation through a gradient of iodixanol. The modified protocol (right) uses a fixed angle rotor for centrifugation to reduce the centrifugation time to 4 h. (b) Schema of the method of inserting EV fractions into step density gradient media. After centrifugation, fractions 1 to 6 were collected from the top of the gradient. For fractions 2 to 5, the regions flanking the interphase separating 2 neighbouring density gradient media layers were pooled together. (c) Chemical formula and molecular weight of sucrose, iohexol and iodixanol.
High-throughput preparation from 5 ml saliva
As shown in a (right), 5-ml saliva samples (no dilution) were pretreated with a closed-type sonication system as described above and were then centrifuged at 2,600×g for 30 min at 4°C (model 5500, Kubota). The supernatants were collected in 4.7-ml tubes (OptiSeal tubes, Beckman Coulter) and were centrifuged at 160,000×g for 20 min at 4°C (Optima MAX-TL ultracentrifuge with TLA-110 rotor, Beckman Coulter). The pellets were washed once with 4.7 ml of PBS followed by centrifugation at 160,000×g for 20 min at 4°C. The obtained crude EVs were resuspended in 640 µl of 47% iodixanol solution and inserted between 47 and 37% step gradients composed of 47, 37, 28 and 18% iodixanol in 3.2-ml tubes (#362305, polycarbonate tubes, Beckman Coulter). Then, within 1 h, tubes were centrifuged at 160,000×g for 4 h at 4°C (Optima MAX-TL ultracentrifuge with TLA-110 rotor, Beckman Coulter). After centrifugation, first, 320 µl of the top fraction was collected as fraction 1 and then four 640-µl fractions flanking the interphase separating 2 neighbouring were collected. Finally, 320 µl of bottom fraction was collected as fraction 6.
EV preparation from HT-29 conditioned medium
For the preparation of EVs from cell culture medium, cells were first propagated using the BelloCell cell culture system (CES-BCB01000, CESCO Bioengineering, Taichung, Taiwan). Human colon adenocarcinoma cell line HT-29 (2×10⁸ cells/30 ml) was seeded into 120 ml of McCoy's 5A medium supplemented with 10% foetal bovine serum and penicillin–streptomycin solution (168-23191, Wako Chemicals, Tokyo, Japan) in BelloCell-500p bottle and was incubated for 96 h. When the concentration of the cells reached 1×10⁹ cells/500 ml, the culture medium was replaced with DMEM/F12 (B-27 supplement, 20 ng/ml EGF, 20 ng/ml FGF and PS) and was incubated for an additional 72 h. The collected conditioned medium (500 ml) was centrifuged at 6,000 rpm for 10 min at 4°C (JA-14 rotor, Beckman Coulter) to remove cells, which were further cleared by filtrating through a Stericup-GP (SCGPT02RE 250 ml, 0.22-µm, polyethersulfone) using a full Teflon diaphragm vacuum pump (FTP-18A, Iwaki Co. Ltd, Tokyo, Japan). The filtrates were divided into aliquots (30 or 83 ml) and were sequentially centrifuged at 160,000×g for 70 min at 4°C (L-90K, with SW32Ti rotor, Beckman Coulter) to get crude EV fractions. All pellets were collected and resuspended in 29.5 ml PBS and were again centrifuged at 160,000×g for 70 min at 4°C. The washed pellet was resuspended in 2.5 ml of density gradient media and was fractionated by gradient centrifugation as described above. The resultant samples were stored at 4°C until analysed.
SDS–PAGE, WB and silver staining
For SDS–PAGE, 24-µl samples of each fraction were mixed with 8 µl of 4× reducing sample buffer (1 M Tris–HCl, pH 6.8, 30% glycerol, 6% SDS, 3% 2-mercaptoethanol, 0.005% bromophenol blue) or 4× non-reducing sample buffer (without 2-mercaptoethanol, for anti-CD63 and CD81 antibodies) and incubated at 95°C for 5 min. Proteins were separated through 10 or 15% polyacrylamide gel (Long Life GEL 10 or 15%, Oriental Instruments, Kanagawa, Japan) in SDS running buffer at a constant 1,000 V, 40 mA for 40 min. Separated proteins were electrotransferred onto PVDF membranes using a blotting system (iBlot, Invitrogen, Carlsbad, CA, USA). Non-specific binding sites were blocked by incubating the membrane in Blocking One (03953-95, Nacalai Tesque, Kyoto, Japan) for 1 h, and then were washed 3 times for 5 min in Tris-buffered saline (TBS)-Tween (10 mM Tris–HCl, 150 mM NaCl, 0.02% Tween-20, used for all the washes throughout the WB experiment). Membranes were probed with primary antibody overnight in Can Get Signal Solution 1 (Toyobo Co. Ltd, Osaka, Japan), followed by incubation with horseradish peroxidase-linked secondary antibodies in Can Get Signal Solution 2 (Toyobo Co. Ltd) for 30 min in the dark. All antibody incubations were carried out under gentle orbital shaking. WBs were washed 3 times in TBS-Tween for 5 min after each incubation step. Primary antibodies were probed with horseradish peroxidase-conjugated secondary antibodies, detected using enhanced chemiluminescence (ECL) and then visualized with a ChemiDoc camera system (Bio-Rad). For total protein analyses, gels were fixed in acetic acid and stained using SilverQuest (LC6070, Invitrogen).
Atomic force microscopy
Atomic force microscopy (AFM) images of EV samples were collected using tapping-mode AFM (MFP-3D-SA-J, Asylum Research, Oxford Instruments, CA, USA) under aqueous conditions equipped with silicon probes (OMCL-TR400PSA, Olympus Corporation, Tokyo, Japan). In AFM observations, EVs were immobilized on mica (#50, Ted Pella, Inc., Redding, CA, USA), which was premodified with 3-aminopropyltriethoxysilane (APTES) on its surface. Twenty microlitres of EV sample was placed on the APTES-coated mica and was incubated for 15 h at 4°C, which was followed by washing with 100 µl of PBS. Topographic height and phase images were recorded at 2 × 2 µm2, 512 × 256 pixels, at a scan rate of 0.20 Hz (1 µm/s) in PBS. Images were processed by SPIP 6.3.6 image analysis software.
Nanoparticle tracking analysis
NanoSight NTA (nanoparticle tracking analysis) (NanoSight LM10, Malvern Instruments Ltd, Malvern, UK) was used to estimate the sizes and numbers of particles present in each fraction. Each fraction was first diluted with PBS so that the concentrations of particles would fall into the range between 2 and 10 × 108 particles/ml (corresponding to the preferred measurement concentration for LM10). Data were collected for 30 sec at ambient temperature with the parameters of camera level 14 and threshold 4. Recorded movie data were analysed with the NTA 2.3 program to calculate the sizes and numbers of particles included. The analysed sample solutions contained non-negligible amounts of iohexol or iodixanol even after dilution, which should have increased the viscosities of the samples. Because precise sample viscosity is a prerequisite for NTA analyses, we (a) determined the densities of each of 6 fractions by a refractometer; (b) calculated the densities of the NTA samples after dilution; (c) measured the viscosities of the iohexol and iodixanol solutions, the densities of which corresponded to the calculated values in (b), by using an Ubbelohde viscometer (2613-0003, SIBATA, Tokyo, Japan) at ambient temperature according to the manufacturer's instructions (n=3) and (d) used the values of the observed viscosities for the NTA analyses. For the experiments using iohexol, the densities and viscosities of the samples after dilution were as follows: 1.03 g/ml and 1.01 cP for fractions 1, 2 and 4; 1.06 g/ml and 1.17 cP for fraction 3; 1.13 g/ml and 1.67 cP for fraction 5 and 1.14 g/ml and 1.74 cP for fraction 6. The densities and viscosities of the iodixanol separation were as follows: 1.01 g/ml and 0.93 cP for fraction 1, 1.02 g/ml and 0.96 cP for fraction 2, 1.03 g/ml and 1.02 cP for fraction 3, 1.11 g/ml and 1.52 cP for fraction 4, 1.12 g/ml and 1.64 cP for fraction 5 and 1.15 g/ml and 1.98 cP for fraction 6. (Note that a measurement of 1.98 cP for iodixanol for fraction 6 exceeds the maximum limit of 1.82 cP for the NTA 2.3 program. We therefore used a value of 1.82 cP for the calculation for that sample.) Three independent movies were analysed. For the experiment depicted in c, the NanoSight was calibrated with 100-nm silica microspheres (#24041, Polysciences, Inc., Warrington, PA, USA) prior to analysis.
RNA extraction
RNA was extracted from each fraction using the acid guanidinium thiocyanate–phenol–chloroform extraction method (Trizol, Life Technologies, Carlsbad, CA, USA). The quantity and quality of the extracted RNA were evaluated using capillary electrophoresis (Bioanalyzer 2100, Agilent Technologies, Santa Clara, CA, USA) with RNA 6000 Pico Kit (Agilent Technologies).
MicroRNA expression analysis
Ninety-three miRNAs, which were selected based on their possible involvement in oral disorders or systemic illness, were investigated for their presence in each fraction as follows: first, RNAs contained in each fraction were reverse transcribed into cDNA in 7.5 µl of reaction mixture that contained 2.5 µl of total RNA, 0.075 µl of 100 nM dNTP, 0.095 µl of RNase inhibitor (20 U/µl), 0.5 µl of RT enzyme (50 U/µl), 1.5 µl of 10× Megaplex RT Primers (Human Pool A v2.1), 0.75 µl of 10× RT buffer and 2.08 µl of nuclease-free water, at 16°C for 30 min; this was followed by 42°C for 30 min and 85°C for 5 min. The resultant cDNAs were further amplified (pre-PCR amplification reaction) by PCR before quantification. In this step, we used 18 PCR cycles, a number which has been previously used (Citation34). For this purpose, 1.25 µl of cDNAs was mixed with 2.5 µl of 2× TaqMan PreAmp Master Mix, 1.25 µl of 0.2× Megaplex PreAmp Primer and PCR amplification reaction was carried out at 95°C for 10 min, followed by 18 cycles at 95°C for 15 sec and at 60°C for 4 min. The amounts of cDNA amplified were quantified by the TaqMan method (Citation35) using a BioMark HD system (Fluidigm Corporation, South San Francisco, CA, USA) equipped with 96.96 dynamic array (Fluidigm). The TaqMan primer and probe set used are listed in Supplementary Table I. A 5-µl sample mixture was prepared for each sample, containing TaqMan Universal Master Mix (No AmpErase UNG, ×2), GE Sample Loading Reagent (Fluidigm, PN 85000746, ×20) and each of the diluted preamplified cDNA samples. Five microlitres assay mixes were prepared with each of the TaqMan Gene Expression Assay (20×) and the Assay Loading Reagent (Fluidigm, PN 85000736, 2×). After loading, the chip was placed in the BioMark HD and the conditions of “at 70°C for 30 min, 25°C for 10 min, 95°C for 1 min, 35 cycles at 96°C for 5 sec and then 60°C for 20 sec” were used in this research. Obtained data were processed with real-time PCR analysis software (version 4.1.3) equipped with a BioMark HD system (Fluidigm). A quality threshold of 0.65, a baseline correction of liner (derivative) and a Ct threshold of auto (global) were used. All reagents used were purchased from Applied Biosystems, Inc., (Foster City, CA, USA) unless otherwise specified. Data are available at the NCBI GEO database under submission numbers GSE78763 and GPL21535.
Results
Human whole saliva is not compatible with the EV-isolation method established for other body fluids
The current gold standard for EV isolation uses equilibrium density gradient centrifugation, which fractionates substances based on differences in buoyant densities. By using the reported protocol of the floating-up equilibrium sucrose density gradient centrifugation, this study first tried to isolate EVs from saliva as well as from the conditioned medium of in vitro cultured cells (HT-29, human colon adenocarcinoma cell line). In the case of the conditioned medium, as previously reported, CD63 was detected in the fractions with densities of 1.10–1.17 g/ml (Supplementary Fig. 1b, right). In contrast, from saliva, the signal of CD63 was only detected in the fractions whose densities were 1.24–1.26 g/ml (Supplementary Fig. 1b, left). It was assumed that the apparently higher density of the salivary EVs was because of the unoptimized conditions for equilibrium density gradient centrifugation because the silver staining of proteins from each fraction indicated that whole proteins stayed in the heavy density fractions (Supplementary Fig. 1a, left), whereas the crude EVs were deposited prior to centrifugation. The viscous nature of saliva might not allow the use of a conventional protocol for an equilibrium density gradient centrifugation. A solution to this problem was first approached by optimizing the pretreatment conditions for salivary EV isolation.
The pretreatment of saliva improved the formation of density gradients in ultracentrifugation
The effects of pretreatment of saliva on fractionation were first investigated by sucrose density gradient centrifugation. Without pretreatment, as described above, salivary proteins did not float up adequately through the gradient media and remained near the bottom fractions (Supplementary Fig. 1a, left). At the same time, turbulence was observed in the density gradient that was formed after centrifugation (Supplementary Fig. 2, top) around fractions 5 and 6, which corresponded to the fractions having viscous properties in pipetting compared with other fractions (data not shown). It was thought that certain viscous moieties in saliva stuck around in fractions 5 and 6 while floating through the media; this may have hindered the movements of other molecules, including EVs, in density gradient centrifugation. Therefore, to reduce the viscosity of saliva, it was passed through a filter or disrupted by sonication. Five microfiltration membranes with various pore sizes composed of various materials were tested, and 3 sonication systems, tip type, closed type and bath type, were tried. Results obtained showed that most of these pretreatments for saliva yielded linear formation of densities after centrifugation (Supplementary Fig. 2). However, it was noticed that pretreatment with filters resulted in the loss of particles under the conditions used, based on quantification with nanoparticle tracking analysis (data not shown). With consideration of operability and biosafety, it was decided to adopt a closed-type sonicator (Bioruptor) for pretreatment of saliva in further studies.
After pretreatment with a closed-type sonicator (Bioruptor), 17 h of centrifugation of human saliva in sucrose gradient resulted in the linear formation of a gradient (Supplementary Fig. 2), and no viscous properties in pipetting were observed from any fraction (data not shown). However, proteins that are related to EVs were still recovered from the fractions with densities of 1.22–1.25 g/ml, which are higher than the reported densities of EVs (b) (Citation11). Furthermore, most of the proteins were recovered from the fractions with a density >1.22 g/ml (a, left panel), indicating that pretreatment alone was not sufficient for fractionation of saliva based on density under the conditions used.
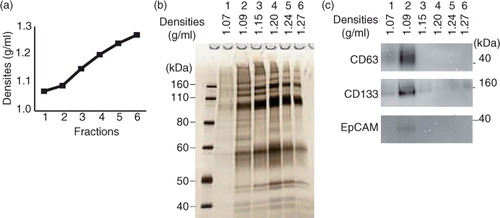
Fig. 2. The effects of gradient media on the fractionation of salivary EVs by density gradient centrifugation [left panel: sucrose; middle panel: iohexol; right panel: iodixanol]. (a) Molecules (mostly proteins) contained in each fraction were visualized by silver staining after electrophoresis in polyacrylamide gel (PAGE). The left panel shows molecular weight (MW) markers with their MW×10−3. Densities (g/ml) of the fractions are shown on the top. (b) Some of the EV markers were visualized by a WB method. The blotted membranes were incubated with antibodies against CD63, CD133, AQP5, β-actin, CD26, CD81, EpCAM, HSP70, TSG101, CD44, CD24 and CD9. Densities (g/ml) of the fractions are shown on the top. Numbers on the right indicate MW×10−3 of the marker.
![Fig. 2. The effects of gradient media on the fractionation of salivary EVs by density gradient centrifugation [left panel: sucrose; middle panel: iohexol; right panel: iodixanol]. (a) Molecules (mostly proteins) contained in each fraction were visualized by silver staining after electrophoresis in polyacrylamide gel (PAGE). The left panel shows molecular weight (MW) markers with their MW×10−3. Densities (g/ml) of the fractions are shown on the top. (b) Some of the EV markers were visualized by a WB method. The blotted membranes were incubated with antibodies against CD63, CD133, AQP5, β-actin, CD26, CD81, EpCAM, HSP70, TSG101, CD44, CD24 and CD9. Densities (g/ml) of the fractions are shown on the top. Numbers on the right indicate MW×10−3 of the marker.](/cms/asset/233fa827-d84d-424d-9faf-dc8dad60b495/zjev_a_11821271_f0002_ob.jpg)
The effects of gradient material on salivary EV isolation
Sucrose has been widely used as a medium for density gradient fractionation experiments. Many groups in the field of EV research have used sucrose as a media for EV separation. In the research field of viruses, which shares many properties with EVs in size, structure and biogenesis routes, in addition to sucrose, other media such as metrizamide, iohexol and iodixanol (c) have been used, because those media may, in certain cases, result in better resolution of viruses (Citation36). Furthermore, the high osmotic pressure of sucrose could damage samples, whereas iohexol or iodixanol have lower osmotic pressures than sucrose (Citation37). Iodixanol has been used for the successful separation of exosomes from HIV, where sucrose could not separate them (Citation36).
We were interested in the effect of media on salivary EV separation and compared 3 different media, namely sucrose, iohexol and iodixanol (). In these experiments, a method was used in which a sample was inserted into a step density gradient material (a and b) (Citation38) in order to shorten the time required for the entire isolation processes. Saliva was pretreated with a closed-type sonicator as described above, and the crude fraction of EVs collected (the pellets after 160,000×g centrifugation) was subjected to step density gradient ultracentrifugation for 17 h, after which each fraction was analysed with silver staining (a), WB (b), NTA () and AFM (). The silver staining and WB revealed that, in sucrose media, proteins did not float up to appropriate fractions, indicating that equilibrium was not reached under the conditions used as described above (a and b, left panels). With iohexol, CD63, CD133, AQP5, β-actin and CD26 were detected from fractions 2 and 3, whose observed densities were 1.12 and 1.17 g/ml, respectively (b, middle panel). With iodixanol, these 5 markers were only abundant in fraction 2 (density of 1.11 g/ml) (b, right panel). With iohexol, CD26, CD81, EpCAM, HSP70, TSG101, CD44 and CD24 were present in the fraction having a density of 1.17 g/ml (b, middle panel), whereas these 7 proteins floated up to the fraction of 1.11 g/ml with iodixanol (b, right panel). From these observations, it was concluded that, among the 3 media tested, iodixanol yielded the best results (in terms of establishment of equilibrium) under the conditions used. Silver staining patterns also indicated that the movement of proteins was most prominent with iodixanol (a). Interestingly, CD9 was recovered from the fraction with higher densities compared with other proteins, both in iohexol and iodixanol, suggesting either that (a) the molecule was not associated with vesicles (or non-vesicular complexes) whose density is higher than canonical EVs or (b) the subclass of EVs expressing CD9 moved more slowly in these media than canonical EVs did. To distinguish these possibilities, the iodixanol density gradient centrifugation was performed with “floating” (from bottom to top) and “sedimentation” (from top to bottom) conditions, and the fractions containing CD63, CD81, β-actin and CD9 (Supplementary Fig. 3). Results indicated that all of CD63, CD81 and β-actin were observed from the fractions having a density of 1.10–1.11 g/ml, irrespective of the direction of movement, confirming that the EVs expressing these proteins had completed their movement and were in a state of equilibrium with iodixanol for 17 h of centrifugation. In contrast, CD9 was located at the fraction of 1.11 g/ml in the “sedimentation” experiment (Supplementary Fig. 3, left) and at the fractions of 1.11–1.24 g/ml in the “floating” direction (, right, and Supplementary Fig. 3, right), indicating that the subpopulation of EVs expressing CD9 did not reach a state of equilibrium under the conditions used. The distributions of the sizes and numbers of particles contained in each fraction were assessed by NTA (NanoSight) for iohexol and iodixanol, and the results are shown in . Size distributions (a) were similar among these 2 media (the modes of fraction 3 of iohexol and fraction 2 of iodixanol are 116.0 and 128.3 nm, respectively). Interestingly, with iohexol, a biphasic distribution of particle numbers was observed (fractions 2 and 4 contained more particles than the other fractions), and with iodixanol, fraction 1 had the most abundant particles (b). These observations were reproduced in the independently isolated sample (c). It is noteworthy that fraction 1 of iodixanol did not express the EVs marker investigated (b) and contained little protein (a), suggesting that “empty” vesicles were concentrated in fraction 1 of the iodixanol centrifugation. As described below, vesicle-like structures were indeed observed in fraction 1 by AFM ().
Fig. 3. (a) The size distribution of each fraction analysed by nanoparticle tracking analysis (NTA). The left shows the results from iohexol and the right shows the results from iodixanol. (b and c) The numbers of particles included in each fraction was calculated using NTA.
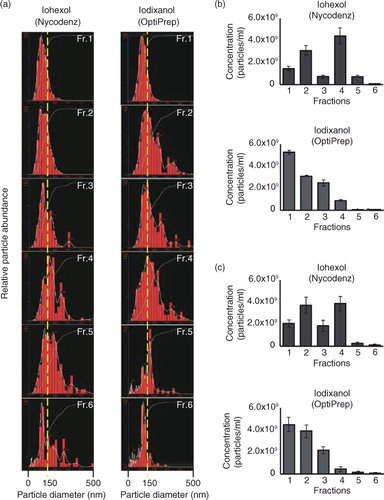
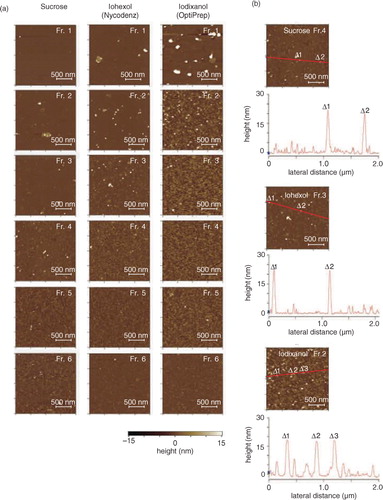
Fig. 4. (a) Atomic force microscopic (AFM) analyses of the fractions in PBS. The crude salivary EVs were fractionated through density gradients of sucrose (left), iohexol (middle) or iodixanol (right), and particles contained in each fraction were adsorbed on the mica precoated with 3-aminopropyltriethoxysilane and were scanned by MFP-3D-SA-J (Asylum Research) using the in liquid tapping mode. The colorimetric scale in the bottom indicates the Z dimension. (b) The height maps of the plausible EV-containing fractions. Fraction 4 of sucrose, fraction 3 of iohexol and fraction 2 of iodixanol were mapped with their heights along with the red line in the images. Labels of Δ1 to Δ 3 indicate the positions that had high height in the images.
Comparison of salivary EVs with conditioned medium derived EVs
For comparisons, EVs were also fractionated from the conditioned medium of in vitro cultured cell, HT-29, colon adenocarcinoma grade II cell line using the same 3 media, namely, sucrose, iohexol or iodixanol (Supplementary Fig. 4). Distributing patterns of CD63, CD133, TSG101, HSP70, EpCAM, β-actin and CD44 suggest that iodixanol and iohexol have better resolution than sucrose, because most of these proteins were concentrated in lighter fractions (Supplementary Fig. 4). Interestingly, when the densities of the fractions containing EV markers between saliva and HT-29 were compared, it was noticed that EVs from saliva had higher densities than conditioned cell medium (1.11 g/ml vs. 1.06 g/ml in iodixanol), even though they were analysed under identical conditions.
Atomic force microscopic analyses for salivary and cultured cell-derived EVs
The results obtained from density gradient fractionation experiments suggested that EVs from saliva and conditioned cell medium have distinct physicochemical characteristics. To extend the knowledge on the differences in physicochemical characters of these EVs, AFM observations were performed for these EVs ( and Supplementary Fig. 5), in which each fraction that was differentiated by density gradient centrifugation using the 3 media was applied on the APTES-modified mica disc and the attached moieties were scanned by AFM in PBS with liquid mode. As shown above (b), in the WB analyses for each fraction, conventional EV markers such as CD63 or CD81 were expressed in fractions 4 and 5 from sucrose, fractions 2 and 3 from iohexol and fraction 2 from iodixanol. AFM observations have recognized putative EV particles as shown in . Fractions 1 of iohexol and iodixanol contained larger particles (a). Because the expression of EV-related markers was not detected in the fractions (), and it had low densities (1.09 and 1.07 g/ml, respectively), it was speculated that these larger particles would represent “empty” larger vesicles.
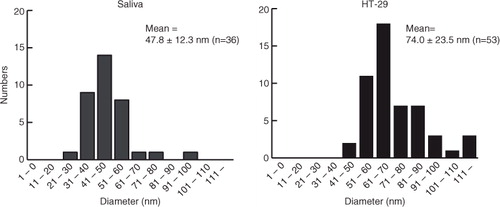
Under the conditions used, many tiny structures (whose diameters were mostly <5 nm, a) were also observed in fractions 4 to 6 from sucrose, fractions 3 to 6 from iohexol and fractions 2 to 6 from iodixanol. These tiny moieties were not precipitates of media because the media themselves did not form these structures under identical centrifugation conditions (data not shown). Although the origins of these tiny structures are not yet known, particles having height >15 nm in AFM observations were considered EVs, whereas those smaller than 15 nm in height were not included in the analysis. The putative EVs (>15 nm) were quantified by focusing on fraction 2 in iohexol. The results obtained are plotted with numbers as the vertical axis and diameter as the horizontal axis (, left). For comparison, the EVs were also prepared from the conditioned medium of HT-29 under the same conditions, and each fraction from sucrose and iohexol was analysed similarly (Supplementary Fig. 5). When the particle distributions in AFM of fraction 2 in iohexol were compared between these 2 sources, it was noticed that, in salivary EVs, particles having diameters of 40–50 nm were dominant, whereas, in HT-29 EVs, the particles having diameters of 50–100 nm accounted for 90% of the particles observed. The average vesicle diameters observed were calculated to be 47.8±12.3 nm (n=36) and 74.0±23.5 nm (n=53), respectively, for human saliva and HT-29. Thus, the data indicate that salivary EVs have smaller diameters (47.8±12.3 nm) and greater densities (1.11 g/ml) compared with EVs isolated from conditioned cell media (74.0±23.5 nm and 1.06 g/ml, respectively).
Fig. 5. Size distributions of EVs observed in AFM images obtained from fraction 2 in iohexol of saliva (left) and the conditioned medium of HT-29 (right). The diameters of AFM images were calculated by the image analysis software SPIP 6.3.6. In total, 36 and 53 particles were analysed for saliva and HT-29, respectively. Images were processed by SPIP 6.3.6 image analysis software.
Modified isolation protocol for salivary EVs with improved throughput
As described above, the isolation protocol for salivary EVs was established, in which pretreatment of saliva with sonication and usage of iodixanol enables EVs to be fractionated based on their densities. However, the method established still required a long centrifugation time, 17 h for fractionation, which may hinder prompt progress in the discovery of diagnostic markers from many clinical samples. To improve the throughput of density-based fractionation of EVs, the original protocol was further modified by using a fixed angle rotor instead of a swinging rotor. For centrifugation of the density gradient, a swinging bucket rotor has been believed to be essential, because a fixed angle rotor could disturb the gradient during the decelerating step. However, it was found that, even when the crude EVs from saliva were floated up through a gradient of iodixanol using a fixed angle rotor, TLA-110, the linearity of gradient was kept, and CD63, CD133 and EpCAM were observed in the density of 1.09 mg/ml (). Because the TLA-110 angle rotor has a lower k-factor (53.4) than the SW40Ti, swinging bucket rotor k-factor (244), the required centrifugation time could be shortened to 4 h from 17 h (The equation T1/K1 =T2/K2 was used for conversion of the centrifugation time between the different rotors, where Tn and Kn represent centrifugation time and k-factor of a given rotor, respectively) (Citation39).
Fig. 6. Density gradient centrifugation using a fixed angle rotor, TLA-110. (a) The density gradient formed after 160,000×g centrifugation of pretreated salivary EVs in iodixanol for 4 h. The density of each fraction was determined by an automatic refractometer (RX-5000α). (b) Analysis of each fraction by silver staining. (c) Analysis of each fraction by WB. Numbers indicate MW×10−3 of markers.
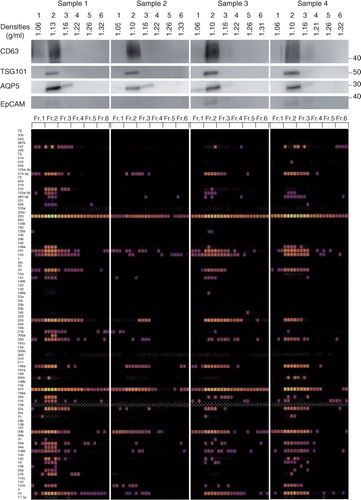
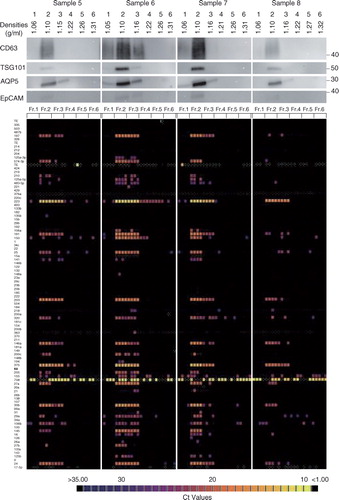
Using this new protocol (a, right), human whole saliva-derived EVs from 8 healthy volunteers were isolated and analysed (). In all specimens, CD63, TSG101, AQP5 and EpCAM were expressed mostly in fraction 2 with differences in expression levels among samples (, upper panel). Total RNAs were extracted from each fraction by the acid guanidinium thiocyanate–phenol–chloroform extraction method, and the amounts of 93 miRNAs, which have been reported to be associated with certain types of oral disorders or systemic diseases, were quantified by the TaqMan method using a BioMark HD system (Fluidigm) as described in Materials and Methods section (b). Among those investigated, it was noticed that 5 miRNAs, miR-30b, miR-146a, miR-203, miR-223 and miR-375, were present in a large quantity in fraction 2 from all 8 of the samples ( and Supplementary Table I). The data were collected with n=4 (experimental replicates), and these 5 miRNAs were expressed in all of n=4. When the miRNAs that were expressed in 3 out of 4 were examined, miR-24 was also categorized as an abundant species in salivary EVs. Each sample expressed a set of miRNAs, whose numbers ranged from 5 species (sample 2) to 27 species (sample 1) when focusing on the ones expressed in all of n=4. In addition, most of these miRNAs were most abundant in fraction 2, suggesting that the EVs having a density of 1.10 g/ml are the main source of salivary secreted miRNAs. Interestingly, some miRNAs were also present in fractions other than fraction 2. For an example, miR-197 (sample 1), miR-203 (sample 2) and miR-320 (sample 3) were expressed only in fraction 3 (, lower panel), suggesting the presence of a distinct EV subclass in fraction 3.
Fig. 7. Continued
Discussion
Although there are many reports in which density gradient centrifugation was used for the isolation of EVs from blood and urine (Citation40, Citation41), to the best knowledge of the authors, the isopycnic centrifugation method has not yet been applied to the isolation of EVs from saliva. Saliva is one of the most viscous body fluids, which is mostly because of salivary glycoproteins, including mucin-glycoproteins (MG1) secreted by the sublingual, subman dibular and palatal glands. It has been reported that the viscosity of unstimulated saliva was 5–7 cP (Citation42), whereas human plasma has 1.2–1.3 cP of viscosity.
When the conventional sucrose density-based purification protocols were used for the isolation of saliva, CD63, an EV marker, was detected in the fractions having very high densities (Supplementary Fig. 1b, left), and most proteins had not floated up to appropriate fractions (Supplementary Fig. 1a, left), suggesting that equilibrium had not been reached under the conditions used. To solve this issue, the effects of pretreating saliva using various filtration and sonication methods were first examined. Although most of these pretreatments improved the formation of a linear gradient of sucrose densities (Supplementary Fig. 2), all of the EV markers tested and most proteins were still retained in the high-density fractions (, left), indicating that the pretreatment alone was not sufficient for the fractionation of saliva by density gradient centrifugation.
It has already been reported that the choice of media for density gradient centrifugation affects the resolution of density-based separation (Citation36). Therefore, next, the effects of different media on salivary EV isolation were examined. In addition to sucrose (C12H22O11), iohexol (C19H26I3N3O9) and iodixanol (C35H44I6N6O15) were investigated in this study (c). Iohexol and iodixanol are iodinated compounds whose viscosity is lower than that of sucrose (Citation37). Iodixanol is a dimer of iohexol and the dimeric structure of iodixanol reduces its osmolality, which makes it possible to prepare iso-osmotic solutions (ca. 260 mOsm) over a wide range of densities (up to 1.32 g/ml) with iodixanol (Citation37). These iodinated compounds have been widely used for isolation of cells or organelles (Citation43, Citation44). Iodixanol has also recently been used for density-based isolation of EVs in some groups (Citation45, Citation46).
The results using iohexol and iodixanol as gradient media have shown that all EV-related signals (with the exception of CD9) tested were mostly concentrated in fraction 2 (density of ca. 1.11 g/ml) when iodixanol was used (, right). NTA analyses (a) and AFM observations () have also shown that fraction 2 (density of ca. 1.11 g/ml) of iodixanol centrifugation contained many EV-like particles. The “equilibrium” state of EV movement in iodixanol has been further confirmed by separating EVs both with “floating” and “sedimentation” directions, which concentrated CD63, CD81 and β-actin in the same fraction of density (Supplementary Fig. 3). This successful separation of salivary EVs with iodixanol is still dependent on pretreatment, because the EVs were not concentrated in the fraction of 1.11 g/ml when the pretreatment step was omitted (data not shown). Thus, by combining the pretreatment of saliva with sonication and the usage of iodixanol as the centrifugation media, salivary EVs can successfully be isolated.
Interestingly, as shown in and Supplementary Fig. 3, there is still the subclass of EVs that have not yet reached the “equilibrium” state during the conditions used. Certain physicochemical properties of the subclass of EVs might reduce the velocity of EVs in the medium, thus retarding the movement in the density gradient. A similar observation has already been reported for prostasome; the author established the equilibrium state by prolonging centrifugation time (Citation47). Indeed, these unpublished observations showed the subclass of salivary EVs expressing CD9 as being isolated in the fraction of 1.11 g/ml when the centrifugation time was prolonged to 96 h.
Establishment of a state of “equilibrium” is important to gain insights into the nature of proposed EV markers, because the crude extract of EVs (i.e. the pellets after 160,000×g centrifugation) usually contain various biomolecules other than EVs. However, active use of a “non-equilibrium” state can also be applied for the differentiation of EVs. In this context, the use of iohexol should be very attractive. As shown in , under the conditions used, subclasses of EVs were separated based on their velocities. NTA analyses have also shown the biphasic distribution of particles from iohexol centrifugation (b and c). Although reproducible conditions would be difficult to establish, such a “velocity method” can be explored to establish a complete picture about the subclasses of EVs.
This study compared the properties of EVs, whose origins were saliva and the conditioned medium of an adenocarcinoma cell line, because it has been noticed that published sizes of salivary EVs (Citation26, Citation28) (Citation48, Citation49) were always smaller than the ones that were reported for EVs from other sources (Citation50–Citation52). Because subtle differences in experimental conditions could affect the observed sizes of vesicles in AFM experiments, we carefully compared the properties of the salivary EVs and the conditioned medium under identical protocols. AFM observations (liquid mode) from this study have indeed confirmed the smaller size of salivary EVs. Salivary EVs had a mean diameter of 47.8±12.3 nm in AFM observations, whereas the EVs from the HT-29 cell line, which were isolated under identical conditions, were 74.0±23.5 nm in diameter (). Higher densities of salivary EVs compared with HT-29 EVs were also observed in the density gradient separation, irrespective of the medium used (compare and Supplementary Fig. 4). Further investigations will be needed to know if this apparent smaller size and higher density represent the intrinsic nature of salivary EVs (they are small and have high density when they are released into the oral cavity) or represent characteristic physicochemical properties (they are susceptible to isolation procedures and become smaller and more dense during the purification processes). In any case, the current data indicate that salivary EVs have distinct properties compared with EVs isolated from a cell line.
At the discovery stage of the development of diagnostic methods, “throughput” and “accuracy” are important factors. Isolation by density gradient centrifugation has been regarded as the “gold standard” method for isolation of EVs, and it can provide researchers with the opportunity to achieve “accurate” analyses of EVs. However, it requires a “long” centrifugation process, and thus has very low “throughput.” The original protocol for salivary EV isolation contained the step of 17 h of centrifugation to establish a state of equilibrium (a, left). It has been believed that the use of a swinging bucket rotor is essential for the experiment of equilibrium density gradient separation to avoid turbulence in the gradient induced during the decelerating step. However, the observations in this study have revealed that centrifugation with a fixed angle rotor can also separate salivary EVs based on their densities (). Based on these observations, an improved version of the protocol for salivary EV isolation has been established in this study (a, right), in which a fixed angle rotor having a k-factor of 53.4 was used. Because of this small k-factor of the rotor, it was possible to reduce the centrifugation time from 17 to 4 h.
With this modified protocol, salivary EVs were purified from 8 healthy volunteers. For all 8 specimens, EV markers (CD63, TSG101, AQP5 and EpCAM) were highly expressed in fraction 2, and miRNAs were also abundant in fraction 2 ( and ). There were differences in expression levels of these biomolecules but, dependent on samples, they were concentrated in apparent EV fractions, thus providing a reliable source for discovery biomarkers from EVs. miRNAs have been proposed to be potential biomarkers and novel targets for cancer (Citation53, Citation54), diabetes (Citation55), cardiovascular disease (Citation56), osteoporosis (Citation57) and Sjögren's syndrome (Citation58), and some of them (Citation59, Citation60) were indeed expressed in fraction 2 of these samples. Interestingly, some miRNAs were expressed in fractions other than fraction 2. For instance, miR-197 (sample 1), miR-203 (sample 2) and miR-320 (sample 3) were only expressed in fraction 3. Density-based separation and characterization of these biomarkers would reveal the subclass of EVs or carriers (for instance, lipoprotein particles) other than EVs, which contain these biomolecules and would lead to the establishment of novel diagnostic methods. The ultracentrifugation method enables us to prepare a relatively pure EV fraction, which is necessary in the developmental stage of a diagnostic system. However, even with our modified protocol, with improvements throughout, the method may not be compatible with daily diagnostic tasks in hospitals. Furthermore, it is important to be aware of the artifact that could be induced by ultracentrifugation itself, as recently reported (Citation61, Citation62). Further exploration of EV isolation methods based on novel principles is vital for the realization of an EV-based diagnosis system.
Fig. 7. Characterization of the salivary EVs from 8 healthy volunteers. WB analyses with anti-CD63, TSG101, AQP5 and EpCAM antibodies are shown on the top with MW×10−3 of markers. Quantities of 93 miRNAs were quantified by the TaqMan real-time PCR method using the BioMark HD system (Fluidigm), and calculated Ct values are shown in colour code (bottom). Numbers in the left indicate miRNAs tested that are listed in Supplementary Table I. The box with small white dots means the obtained amplification curve could not be analysed by the software of the BioMark HD system (no information). A technical replicate of n=4 was used to induce robust results.
Conclusions
In this study, the conditions for fractionating salivary EVs based on their densities have been established. Using this methodology, a comparative analysis between salivary EVs and EVs prepared from the conditioned medium of culture cell has been performed, from which it was found that salivary EVs have smaller sizes and higher densities than the EVs from the cell supernatant. This study also established separation protocol with high throughput for clinical samples. The methods established here will accelerate the development of salivary EV-based diagnosis systems.
Conflict of interest and funding
The authors have not received any funding or benefits from industry or elsewhere to conduct this study.
Supplementary Material
Download PDF (2.4 MB)Acknowledgements
We thank M. Yoshida (TDC) for support in centrifugation experiments and S. Matsumura (JFCR) for critical discussion in AFM observations. This work was supported by “Project for Private Universities: matching fund subsidy” from MEXT (Ministry of Education, Culture, Sports, Science and Technology) to Y. Y. and by a grant from the Vehicle Racing Commemorative Foundation to K. S.
Notes
To access the supplementary material to this article, please see Supplementary files under ‘Article Tools’.
Related Research Data
References
- Wong DT. Salivary diagnostics powered by nanotechnologies, proteomics and genomics. J Am Dent Assoc. 2006; 137: 313–21.
- Pfaffe T, Cooper-White J, Beyerlein P, Kostner K, Punyadeera C. Diagnostic potential of saliva: current state and future applications. Clin Chem. 2011; 57: 675–87.
- Humphrey SP, Williamson RT. A review of saliva: normal composition, flow, and function. J Prosthet Dent. 2001; 85: 162–9.
- Deutsch O, Fleissig Y, Zaks B, Krief G, Aframian DJ, Palmon A. An approach to remove alpha amylase for proteomic analysis of low abundance biomarkers in human saliva. Electrophoresis. 2008; 29: 4150–7.
- Krief G, Deutsch O, Gariba S, Zaks B, Aframian DJ, Palmon A. Improved visualization of low abundance oral fluid proteins after triple depletion of alpha amylase, albumin and IgG. Oral Dis. 2011; 17: 45–52.
- Wong DT. Salivary extracellular noncoding RNA: emerging biomarkers for molecular diagnostics. Clin Ther. 2015; 37: 540–51.
- Lötvall J, Hill AF, Hochberg F, Buzas EI, Di Vizio D, Gardiner C, etal. Minimal experimental requirements for definition of extracellular vesicles and their functions: a position statement from the International Society for Extracellular Vesicles. J Extracell Vesicles. 2014; 3: 26913, doi: http://dx.doi.org/10.3402/jev.v3.26913.
- Yanez-Mo M, Siljander PR, Andreu Z, Zavec AB, Borras FE, Buzas EI, etal. Biological properties of extracellular vesicles and their physiological functions. J Extracell Vesicles. 2015; 4: 27066, doi: http://dx.doi.org/10.3402/jev.v4.27066.
- Valadi H, Ekstrom K, Bossios A, Sjostrand M, Lee JJ, Lötvall JO. Exosome-mediated transfer of mRNAs and microRNAs is a novel mechanism of genetic exchange between cells. Nat Cell Biol. 2007; 9: 654–9.
- El Andaloussi S, Mager I, Breakefield XO, Wood MJ. Extracellular vesicles: biology and emerging therapeutic opportunities. Nat Rev Drug Discov. 2013; 12: 347–57.
- Théry C, Ostrowski M, Segura E. Membrane vesicles as conveyors of immune responses. Nat Rev Immunol. 2009; 9: 581–93.
- Skog J, Wurdinger T, van Rijn S, Meijer DH, Gainche L, Sena-Esteves M, etal. Glioblastoma microvesicles transport RNA and proteins that promote tumour growth and provide diagnostic biomarkers. Nat Cell Biol. 2008; 10: 1470–6.
- Rupp AK, Rupp C, Keller S, Brase JC, Ehehalt R, Fogel M, etal. Loss of EpCAM expression in breast cancer derived serum exosomes: role of proteolytic cleavage. Gynecol Oncol. 2011; 122: 437–46.
- Gyorgy B, Modos K, Pallinger E, Paloczi K, Pasztoi M, Misjak P, etal. Detection and isolation of cell-derived microparticles are compromised by protein complexes resulting from shared biophysical parameters. Blood. 2011; 117: e39–48.
- Alvarez ML, Khosroheidari M, Kanchi Ravi R, Distefano JK. Comparison of protein, microRNA, and mRNA yields using different methods of urinary exosome isolation for the discovery of kidney disease biomarkers. Kidney Int. 2012; 82: 1024–32.
- Chen C, Skog J, Hsu C-H, Lessard RT, Balaj L, Wurdinger T, etal. Microfluidic isolation and transcriptome analysis of serum microvesicles. Lab Chip. 2010; 10: 505–11.
- Théry C, Amigorena S, Raposo G, Clayton A. Isolation and characterization of exosomes from cell culture supernatants and biological fluids. Curr Protoc Cell Biol. 2006. Chapter 3:Unit 3 22.
- Raposo G, Nijman HW, Stoorvogel W, Liejendekker R, Harding CV, Melief CJ, etal. B lymphocytes secrete antigen-presenting vesicles. J Exp Med. 1996; 183: 1161–72.
- Rani S, O'Brien K, Kelleher FC, Corcoran C, Germano S, Radomski MW, etal. Isolation of exosomes for subsequent mRNA, MicroRNA, and protein profiling. Methods Mol Biol. 2011; 784: 181–95.
- Raj DA, Fiume I, Capasso G, Pocsfalvi G. A multiplex quantitative proteomics strategy for protein biomarker studies in urinary exosomes. Kidney Int. 2012; 81: 1263–72.
- Admyre C, Johansson SM, Qazi KR, Filen JJ, Lahesmaa R, Norman M, etal. Exosomes with immune modulatory features are present in human breast milk. J Immunol. 2007; 179: 1969–78.
- Harrington MG, Fonteh AN, Oborina E, Liao P, Cowan RP, McComb G, etal. The morphology and biochemistry of nanostructures provide evidence for synthesis and signaling functions in human cerebrospinal fluid. Cerebrospinal Fluid Res. 2009; 6: 10.
- Berckmans RJ, Sturk A, van Tienen LM, Schaap MC, Nieuwland R. Cell-derived vesicles exposing coagulant tissue factor in saliva. Blood. 2011; 117: 3172–80.
- Gonzalez-Begne M, Lu B, Han X, Hagen FK, Hand AR, Melvin JE, etal. Proteomic analysis of human parotid gland exosomes by multidimensional protein identification technology (MudPIT). J Proteome Res. 2009; 8: 1304–14.
- Michael A, Bajracharya SD, Yuen PS, Zhou H, Star RA, Illei GG, etal. Exosomes from human saliva as a source of microRNA biomarkers. Oral Dis. 2010; 16: 34–8.
- Sharma S, Rasool HI, Palanisamy V, Mathisen C, Schmidt M, Wong DT, etal. Structural-mechanical characterization of nanoparticle exosomes in human saliva, using correlative AFM, FESEM, and force spectroscopy. ACS Nano. 2010; 4: 1921–6.
- Lässer C, Alikhani VS, Ekstrom K, Eldh M, Paredes PT, Bossios A, etal. Human saliva, plasma and breast milk exosomes contain RNA: uptake by macrophages. J Transl Med. 2011; 9: 9.
- Sharma S, Gillespie B, Palanisamy V, Gimzewski JK. Quantitative nanostructural and single-molecule force spectroscopy biomolecular analysis of human saliva-derived exosomes. Langmuir. 2011; 27: 14394–400.
- Gallo A, Tandon M, Alevizos I, Illei GG. The majority of microRNAs detectable in serum and saliva is concentrated in exosomes. PLoS One. 2012; 7: e30679.
- Ogawa Y, Taketomi Y, Murakami M, Tsujimoto M, Yanoshita R. Small RNA transcriptomes of 2 types of exosomes in human whole saliva determined by next generation sequencing. Biol Pharm Bull. 2013; 36: 66–75.
- Lau C, Kim Y, Chia D, Spielmann N, Eibl G, Elashoff D, etal. Role of pancreatic cancer-derived exosomes in salivary biomarker development. J Biol Chem. 2013; 288: 26888–97.
- Zlotogorski-Hurvitz A, Dayan D, Chaushu G, Korvala J, Salo T, Sormunen R, etal. Human saliva-derived exosomes: comparing methods of isolation. J Histochem Cytochem. 2015; 63: 181–9.
- Yang J, Wei F, Schafer C, Wong DT. Detection of tumor cell-specific mRNA and protein in exosome-like microvesicles from blood and saliva. PLoS One. 2014; 9: e110641.
- Gorur A, Balci Fidanci S, Dogruer Unal N, Ayaz L, Akbayir S, Yildirim Yaroglu H, etal. Determination of plasma microRNA for early detection of gastric cancer. Mol Biol Rep. 2013; 40: 2091–6.
- Jang JS, Simon VA, Feddersen RM, Rakhshan F, Schultz DA, Zschunke MA, etal. Quantitative miRNA expression analysis using fluidigm microfluidics dynamic arrays. BMC Genomics. 2011; 12: 144.
- Cantin R, Diou J, Belanger D, Tremblay AM, Gilbert C. Discrimination between exosomes and HIV-1: purification of both vesicles from cell-free supernatants. J Immunol Methods. 2008; 338: 21–30.
- Neves JS, Perez SA, Spencer LA, Melo RC, Weller PF. Subcellular fractionation of human eosinophils: isolation of functional specific granules on isoosmotic density gradients. J Immunol Methods. 2009; 344: 64–72.
- Perez-Gonzalez R, Gauthier SA, Kumar A, Levy E. The exosome-secretory pathway transports amyloid precursor protein carboxyl terminal fragments from the cell into the brain extracellular space. J Biol Chem. 2012; 287: 43108–15.
- Cvjetkovic A, Lötvall J, Lässer C. The influence of rotor type and centrifugation time on the yield and purity of extracellular vesicles. J Extracell Vesicles. 2014; 3: 23111, doi: http://dx.doi.org/10.3402/jev.v3.23111.
- Simpson RJ, Jensen SS, Lim JW. Proteomic profiling of exosomes: current perspectives. Proteomics. 2008; 8: 4083–99.
- Katsuda T, Kosaka N, Ochiya T. The roles of extracellular vesicles in cancer biology: toward the development of novel cancer biomarkers. Proteomics. 2014; 14: 412–25.
- Rantonen PJ, Meurman JH. Viscosity of whole saliva. Acta Odontol Scand. 1998; 56: 210–4.
- Mayanagi T, Kurosawa R, Ohnuma K, Ueyama A, Ito K, Takahashi J. Purification of mouse primordial germ cells by Nycodenz. Reproduction. 2003; 125: 667–75.
- Graham J, Ford T, Rickwood D. The preparation of subcellular organelles from mouse liver in self-generated gradients of iodixanol. Anal Biochem. 1994; 220: 367–73.
- Baietti MF, Zhang Z, Mortier E, Melchior A, Degeest G, Geeraerts A, etal. Syndecan-syntenin-ALIX regulates the biogenesis of exosomes. Nat Cell Biol. 2012; 14: 677–85.
- Tauro BJ, Mathias RA, Greening DW, Gopal SK, Ji H, Kapp EA, etal. Oncogenic H-ras reprograms Madin-Darby canine kidney (MDCK) cell-derived exosomal proteins following epithelial-mesenchymal transition. Mol Cell Proteomics. 2013; 12: 2148–59.
- Aalberts M, van Dissel-Emiliani FM, van Adrichem NP, van Wijnen M, Wauben MH, Stout TA, etal. Identification of distinct populations of prostasomes that differentially express prostate stem cell antigen, annexin A1, and GLIPR2 in humans. Biol Reprod. 2012; 86: 82.
- Palanisamy V, Sharma S, Deshpande A, Zhou H, Gimzewski J, Wong DT. Nanostructural and transcriptomic analyses of human saliva derived exosomes. PLoS One. 2010; 5: e8577.
- Zlotogorski-Hurvitz A, Dayan D, Chaushu G, Salo T, Vered M. Morphological and molecular features of oral fluid-derived exosomes: oral cancer patients versus healthy individuals. J Cancer Res Clin Oncol. 2015; 142: 101–10.
- Hardij J, Cecchet F, Berquand A, Gheldof D, Chatelain C, Mullier F, etal. Characterisation of tissue factor-bearing extracellular vesicles with AFM: comparison of air-tapping-mode AFM and liquid Peak Force AFM. J Extracell Vesicles. 2013; 2: 21045, doi: http://dx.doi.org/10.3402/jev.v2i0.21045.
- Ashcroft BA, de Sonneville J, Yuana Y, Osanto S, Bertina R, Kuil ME, etal. Determination of the size distribution of blood microparticles directly in plasma using atomic force microscopy and microfluidics. Biomed Microdevices. 2012; 14: 641–9.
- Leong HS, Podor TJ, Manocha B, Lewis JD. Validation of flow cytometric detection of platelet microparticles and liposomes by atomic force microscopy. J Thromb Haemost. 2011; 9: 2466–76.
- Uesugi A, Kozaki K, Tsuruta T, Furuta M, Morita K, Imoto I, etal. The tumor suppressive microRNA miR-218 targets the mTOR component Rictor and inhibits AKT phosphorylation in oral cancer. Cancer Res. 2011; 71: 5765–78.
- Li A, Omura N, Hong SM, Vincent A, Walter K, Griffith M, etal. Pancreatic cancers epigenetically silence SIP1 and hypomethylate and overexpress miR-200a/200b in association with elevated circulating miR-200a and miR-200b levels. Cancer Res. 2010; 70: 5226–37.
- Shantikumar S, Caporali A, Emanueli C. Role of microRNAs in diabetes and its cardiovascular complications. Cardiovasc Res. 2012; 93: 58393.
- Tijsen AJ, Pinto YM, Creemers EE. Circulating microRNAs as diagnostic biomarkers for cardiovascular diseases. Am J Physiol Heart Circ Physiol. 2012; 303: H1085–95.
- Wang Y, Li L, Moore BT, Peng XH, Fang X, Lappe JM, etal. MiR-133a in human circulating monocytes: a potential biomarker associated with postmenopausal osteoporosis. PLoS One. 2012; 7: e34641.
- Alevizos I, Illei GG. MicroRNAs in Sjogren's syndrome as a prototypic autoimmune disease. Autoimmun Rev. 2010; 9: 618–21.
- Bousquet M, Harris MH, Zhou B, Lodish HF. MicroRNA miR-125b causes leukemia. Proc Natl Acad Sci USA. 2010; 107: 21558–63.
- Bandyopadhyay S, Friedman RC, Marquez RT, Keck K, Kong B, Icardi MS, etal. Hepatitis C virus infection and hepatic stellate cell activation downregulate miR-29: miR-29 overexpression reduces hepatitis C viral abundance in culture. J Infect Dis. 2011; 203: 1753–62.
- Yuana Y, Boing AN, Grootemaat AE, van der Pol E, Hau CM, Cizmar P, etal. Handling and storage of human body fluids for analysis of extracellular vesicles. J Extracell Vesicles. 2015; 4: 29260, doi: http://dx.doi.org/10.3402/jev.v4.29260.
- Linares R, Tan S, Gounou C, Arraud N, Brisson AR. High-speed centrifugation induces aggregation of extracellular vesicles. J Extracell Vesicles. 2015; 4: 29509, doi: http://dx.doi.org/10.3402/jev.v4.29509.