
Abstract
Proteomics analysis of biofluid-derived vesicles holds enormous potential for discovering non-invasive disease markers. Obtaining vesicles of sufficient quality and quantity for profiling studies has, however, been a major problem, as samples are often replete with co-isolated material that can interfere with the identification of genuine low abundance, vesicle components. Here, we used a combination of ultracentrifugation and size-exclusion chromatography to isolate and analyse vesicles of plasma or urine origin. We describe a sample-handling workflow that gives reproducible, quality vesicle isolations sufficient for subsequent protein profiling. Using a semi-quantitative aptamer-based protein array, we identified around 1,000 proteins, of which almost 400 were present at comparable quantities in plasma versus urine vesicles. Significant differences were, however, apparent with elements like HSP90, integrin αVβ5 and Contactin-1 more prevalent in urinary vesicles, while hepatocyte growth factor activator, prostate-specific antigen–antichymotrypsin complex and many others were more abundant in plasma vesicles. This was also applied to a small set of specimens collected from men with metastatic prostate cancer, highlighting several proteins with the potential to indicate treatment refractory disease. The study provides a practical platform for furthering protein profiling of vesicles in prostate cancer, and, hopefully, many other disease scenarios.
To access the supplementary material to this article, please see Supplementary files under ‘Article Tools’.
Prostate cancer is the most common cancer in men in the UK, and lifetime prevalence is 1 in 8, accounting for almost 1 quarter of new male cancer cases (Citation1) with 220,800 new diagnosis projected for 2015 in the USA (Citation2). The reliance on serum prostate-specific antigen (PSA) levels as a mode of prostate cancer detection has been a mixed success. While helping to identify men with early-stage disease, its low specificity has led to a problem of over-diagnosis and the treatment of clinically insignificant tumours. Most diagnoses will not actually require active interventions other than surveillance, as they would be considered indolent. In a proportion of men, however, the disease takes a more aggressive course and the early identification of these cancers remains a challenge. In fact, in a major review of gene expression data in prostate cancer, the authors concluded that, after 10 years of biomarker research, the histological Gleason score remains the most useful prognostic marker, and searching for biomarkers to improve this must continue (Citation3).
Exosomes are membrane-bounded vesicles manufactured within late endosomal compartments termed multivesicular endosomes, which are trafficked to the plasma membrane releasing the preformed nanovesicles into the extracellular space (Citation4). The vesicles constitute a miniature and simpler version of the parent cell in terms of the proteome (Citation5), but they also encapsulate a set of transcripts, non-coding RNA, and possibly DNA, which again differ from the cellular repertoire (Citation6, Citation7). Exosomes often exhibit heightened production by cancer cells (Citation8), and exogenous environmental cues, such as hypoxia or other stressors, can lead to changes in the molecular constituents of exosomes (Citation9, Citation10). Dynamic changes in exosomes are functionally important, and there is strong evidence demonstrating their roles in carcinogenesis and disease progression, through direct activities in immune evasion, stromal activation, angiogenesis and metastatic niche formation (Citation11).
Exosomes mediate their influence locally and also at distant sites within the body through entering the circulation. In fact, exosomes are present within all biological fluids including circulating plasma (Citation12), seminal plasma, urine (Citation13), saliva (Citation14), tumour effusions (Citation15) and others. For these reasons, exosomes have attracted considerable interest in recent years as possible “treasure chests” of relevant disease markers (Citation16–Citation20); that is to say, they provide a complex set of molecules of functional importance in disease, in a minimally invasive manner. Although there is enormous interest in the discovery of RNA-related markers within biofluid-derived exosomes, there is still considerable utility in deciphering the protein profile of these vesicles. A notable example is the use of vesicular Glypican-1 to provide diagnostic information in early pancreatic cancer (Citation17).
Performing proteomics on exosomes isolated from biological fluids, however, is a technical challenge for several reasons. Biological fluids, particularly blood plasma, are extremely protein-rich, and confidently separating vesicles from non-vesicular proteins is very difficult. The use of straightforward differential centrifugation followed by an ultracentrifugation pelleting step provides a vesicle-containing sample replete with high abundant blood proteins such as albumin, complement components and immunoglobulins. When present, these components are notorious for confounding mass-spectrometry-based proteomics as they mask the identification of relatively low abundant, vesicle-associated proteins. Some more recent attempts have utilized some traditional, but gold-standard methods, involving ultracentrifugation on gradients, resulting in significant enrichment of vesicles, revealing greater numbers of likely vesicle-related proteins (Citation21). However, such gains are countered by the sample-handling processes here that involve operator skill and are very time consuming. The use of size-exclusion chromatography (SEC) has been advocated as a means of separating vesicles from proteins some time ago (Citation22) and has seen renewed uptake recently by the vesicle community as a vesicle clean-up method (Citation23). The use of SEC as an up-front method prior to mass spectrometry has indeed shown some utility, revealing just over 100 proteins that might otherwise not have been possible to identify (Citation24). However, even with very advanced mass-spectrometry instrumentation, the inability to completely remove contaminating albumin and other abundant biofluid proteins is limiting the capacity to discover novel exosome proteins that can be informative of disease.
The use of protein-array methods may offer a partial solution to this, if the presence of contaminating protein would have less impact in masking interesting yet low abundance vesicular protein. One such technology platform is the SOMAscan® assay, which is a multiplex aptamer-based protein array capable of giving relative quantity data on over 1,000 proteins (detailed by Gold et al. (Citation25)). Although principally designed for assaying blood (serum/plasma), it is adaptable for other sample types including urine, and we have previously used this method for protein discovery in prostate cancer cell-line derived exosomes, identifying over 300 proteins with previously unknown associations with prostate cancer cell-line exosomes (Citation26).
In this current report, therefore, we present an isolation of exosomes isolated from blood plasma or urine specimens using a SEC approach followed by an analysis of enriched vesicle isolates by SOMAscan®. In the first instance, using healthy donors, we compare the quality of vesicle isolates generated from plasma and urine, and demonstrate the successful identification of hundreds of proteins; some providing a clear distinction between vesicles of blood and urinary compartments. We also undertook a small-scale study with specimens provided by patients with metastatic prostate cancer using these workflows. We conclude that the combination of SEC with SOMAscan® assay can provide a means for proteomics comparisons in a clinical setting and can potentially identify vesicular proteins of blood or urine origin indicative of treatment failure and progressive disease in prostate cancer.
Experimental procedures
Blood and urine donors
Biofluid samples were collected from healthy donors under informed consent and with ethical approval from Cardiff University, School of Medicine Research Ethics Committee, under the reference number 14/55. All patient biofluid samples were ethically obtained from consenting patients with metastatic prostate cancer through a bespoke specimen collection arranged through the Wales Cancer Bank. Sample collection was open for a period of around 6 months. Specimens were obtained from 2 clinical scenarios; first, from men presenting with metastatic prostate cancer prior to receiving any therapeutic interventions (annotated herein as Arm A), and second, from men having failed all therapeutics, bearing progressive disease (annotated as Arm B).
Urine sample collection
Up to 250-ml volume was collected into sterile containers (Millipore, Watford, UK). Samples were not the first-morning urine and were processed within 2 h of collection, as follows. Urine was centrifuged at 400×g (7 min, 20°C) to remove cells and subsequently at 2,000×g (15 min, 4°C) to remove cellular debris. The urine fraction was collected and 0.22-µm vacuum filtered to remove any remaining large debris (Millipore). Urine was then stored at −80°C until processing for vesicle isolation. This was performed <4 weeks post collection.
Plasma sample collection
Approximately 9 ml of blood was collected in K3 EDTA tubes (Greiner Bio-One Ltd, Stonehouse, UK) and the tubes inverted gently once in order to limit platelet activation. With minimal agitation, blood samples were centrifuged at 400×g (7 min, 20°C). The plasma layer was then collected and centrifuged at 6,000×g (fixed angle rotor, 10 min, 20°C). Platelet-free plasma was then syringe filtered (0.22 µm) and stored (1.6-ml aliquots) at −80°C until processing for vesicle isolation. This was performed <4 weeks post collection.
Vesicle isolation from plasma
Sepharose CL-2B (GE Healthcare Life Sciences, Little Chalfont, UK) was diluted 1:1 with 0.1-µm filtered phosphate-buffered saline (PBS) containing 1.8-mg/ml ethylenediaminetetraacetic acid (EDTA) (Lonza and Sigma Aldrich) and poured into long ~30-cm glass columns (12-ml bed volume; Bio-Rad Laboratories Ltd, Hemel Hempstead, UK) (a). The columns were washed with 30-ml mobile phase buffer (0.1-µm filtered 1.8-mg/ml EDTA in PBS) and stored overnight at 4°C. A volume of 1.5 ml of plasma was then thawed at ambient temperature and after mixing, applied to the column and the first 3×500-µl fractions collected. Without allowing the column to dry out, mobile phase buffer was added serially in steps of 500 µl, and corresponding 500-µl fractions were collected achieving up to 30 fractions in total. The protein and particle content of each fraction was determined by NanoDrop™ (measuring absorbance at 280 nm, in duplicates) and NanoSight™, respectively. Fractions to be processed and analysed were selected on the basis of the first protein peak (by NanoDrop-protein measurements), as explained in detail in the Results section. Those selected fractions were pooled and washed with PBS and centrifuged at 200,000×g for 2 h at 4°C to pellet vesicles (using: Quick Seal tubes; TLA-110 fixed angle rotor; Optima™ Max-XP ultracentrifuge; Beckman Coulter, High Wycombe, UK). The supernatant was discarded and the pellet resuspended in 40 µl of PBS and stored at −80°C.
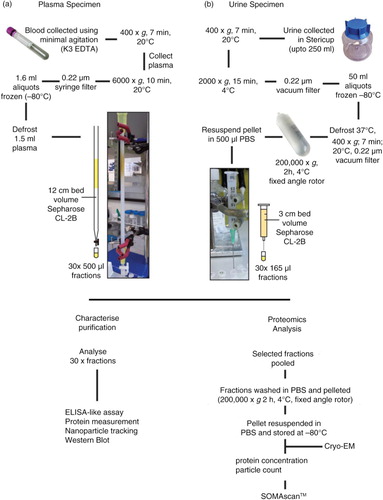
Fig. 1. Flowchart for the isolation of plasma- and urine-derived vesicles. Blood was collected into EDTA vacutainers and pre-cleared of cells, filtered and frozen at −80°C in 1.5-ml aliquots. The plasma was subsequently thawed and vortexed prior to applying to the home-made 12-cm bed volume 30-cm long Sepharose CL-2B size-exclusion column. PBS EDTA was used as the mobile phase buffer and up to 30×500 µl fractions were collected (a). Urine was collected into 250-ml Stericups and pre-cleared of cells, filtered and frozen at −80°C in aliquots up to 50 ml. Upon thawing, the urine was vortexed and centrifuged and filtered a second time to eliminate sediment, and ultracentrifuged for 2 h, 4°C, 200,000×g. The subsequent pellet was resupended in 500 µl PBS and applied to a small 3-cm volume column made in a 2.5-ml syringe. An 18-gauge needle was attached to the bottom of the syringe to guide the sample accurately into 500-µl microcentrifuge tubes in up to 30×165 µl fractions (b). For both plasma and urine, each fraction was subject to analysis by ELISA-like assays, protein measurement, NTA, and when possible also by western blot. Alternatively, selected vesicle-rich fractions were pooled and concentrated/washed (200,000×g, 2 h, 4°C). The pellet was resuspended in a small volume of PBS, and protein and particle concentrations determined and stored at −80°C. Prior to SOMAscan® analysis, occasional samples were assessed by cryo-electron microscopy.
Vesicle isolation from urine
Similarly, Sepharose CL-2B was prepared as for the plasma; however, the column itself was a 2.5-ml plastic syringe barrel (plunger removed) with glass wool plugging the bottom preventing the Sepharose leaking through. The bed volume was 2.8 ml and was washed through with 6 ml of mobile phase buffer (b) and left overnight at 4°C to settle. Up to 260 ml of urine was thawed at 37°C in a water bath and, after mixing, it was subjected to an additional centrifugation at 400×g (7 min, 20°C) and 0.22-µm vacuum filtration to remove any sediment. The urine was then ultracentrifuged at 200,000×g for 2 h at 4°C (using: QuickSeal tubes; 70 Ti Fixed angle rotor; Optima LE80 K Ultracentrifuge; Beckman Coulter). The supernatant was discarded and the pellets resuspended in a total volume of 500-µl PBS. The resuspended urinary pellet was then loaded onto the column. The mobile phase buffer was serially added in 165-µl steps, and corresponding fractions of 165 µl were collected for a total of up to 30 fractions. Protein and particle content of each fraction was determined and selected fractions pooled and vesicles pelleted as above.
Nanoparticle tracking analysis (by NanoSight™)
Vesicles/particles present in the fractions and final pellets were diluted in particle-free water (Fresenius Kabi, Runcorn, UK) to concentrations up to 2×10⁹ particles/ml within the linear range of the instrument, and analysis was performed on a NanoSight™ LM10 system as previously described (Citation27) but configured with a temperature-controlled LM14 laser module with a 488-nm laser and a high-sensitivity sCMOS camera system (OrcaFlash2.8, Hammamatsu C11440) and a syringe-pump system (Malvern Instruments, Malvern, UK). The analysis was performed as described by Webber and Clayton (Citation27), with some modifications. Three videos of 30 s were taken under controlled fluid flow with a pump speed set to 80 and temperature set to 25°C. Videos were analysed using the batch analysis tool of NTA 2.3 software (version 2.3 build 2.3.5.0033.7-Beta7), where minimum particle size, track length and blur were set as “automatic.” The area under the histogram for each triplicate measurement was averaged and used as a particle concentration measurement.
Microplate-based assay for vesicle surface markers
Immunostaining was performed as previously described (Citation26). Briefly, fractions were bound to protein-binding microtitre ELISA plates (Greiner Bio-One, Stonehouse, UK) at a dilution of 1:4. After overnight coupling and blocking (with 1% (w/v) BSA in PBS for 2 h at room temperature (RT)), the bound material was labelled with primary antibodies including CD9, ApoB, THP (Tamm–Horsfall protein) (at concentrations of 1 µg/ml) or HSA (human serum albumin) (at 250 ng/ml) (R&D Systems) all for 2 h at RT on a plate shaker. After 3 washes, goat antimouse-biotinylated antibody (Perkin Elmer) diluted 1:2,500 was added for 1.5 h. After 3 washes, Europium-conjugated streptavidin (Perkin Elmer) was added for 45 min. Finally after 6 washes, specific signal was measured by time-resolved fluorometry using a Wallac Victor-II multilabel plate reader (PerkinElmer Life). The method is referred to as an “ELISA-like” assay in the text.
Electrophoresis and immunoblotting
Chromatographic fractions were boiled in sodium dodecyl sulphate (SDS) sample buffer containing 20-mM 1,4–Dithiothreitol (DTT) as previously described (Citation26, Citation28). Membranes were probed using antibodies against proteins including TSG101 (clone C-2), ALIX (clone G-10), LAMP2 (clone H4-B4) (Santa Cruz Biotechnology, Inc., Heidelberg, Germany) or HSA (clone 188835) (R&D systems, Minneapolis, MA) at 1–4 µg/ml in PBS-Tween 20 (0.05%) and detected using antimouse-HRP conjugate (Santa Cruz) and super-signal picoWest luminescence reagent (Thermo Fisher).
Cryo-electron microscopy
We performed cryo-electron microscopy (cryo-EM) to examine the presence of vesicle structures in selected, pooled column eluates. Around 5 µl of the specimen was directly adsorbed onto glow-discharged holey carbon grids (QUANTIFOIL, Germany). Grids were blotted at 95% humidity and rapidly plunged into liquid ethane with the aid of VITROBOT (Maastricht Instruments BV, The Netherlands). Vitrified samples were imaged at liquid nitrogen temperature using a JEM-2200FS/CR transmission cryo-electron microscope (JEOL, Japan), equipped with a field emission gun and operated at an acceleration voltage of 200 kV.
Preparation of samples for the SOMAscan® array
The SOMAscan® multiplex assay consists of 1,129 individual affinity molecules called SOMAmer® (slow off-rate modified DNA aptamer) reagents, each with very high affinity to their protein targets (Citation25, Citation29). Exosomes were prepared for the SOMAscan® assay by diluting them to 200 µg/ml in a buffer consisting of 1×SomaLogic SB17, 1% NP-40 and 0.5% (w/v) sodium deoxycholate. The diluted samples were incubated for 15 min on a rotisserie at 37°C. This incubation is followed by a centrifugation step at 14,000×g for 5 min and the supernatant is recovered. A volume of 72 µL of SomaLogic Plasma Diluent is mixed with 12 µL SomaLogic Assay buffer and 36 µl of the above-processed exosome preparation (material recovered after centrifugation). This procedure results in a final protein concentration of 60 µg/ml. The final sample is incubated with a pool of 1,129 SOMAmer® reagents for equilibration binding for 210 min at 28°C. Two sequential bead-based immobilization and washing steps were then used to eliminate unbound or non-specifically bound proteins and the unbound SOMAmer® reagents, leaving only protein target-bound SOMAmer® reagents. These remaining SOMAmer® reagents were isolated, and each reagent was quantified simultaneously on a custom Agilent hybridization array. The number of each SOMAmer® measured is quantitatively proportional to the protein concentration in the original sample.
Data handling, presentation and bioinformatics analysis
The RFU (relative fluorescence unit) output from the array was subjected to background subtraction. For both the plasma- and urine-derived exosomes, this involved utilizing the data collected from a 16-point titration, using healthy donor specimens. The backgrounds/baselines were established using SomaLogics’ method for calculating background, which examines the RFU values for the 5 lowest dilutions in the titration. “The %CV is computed for the RFU measurements of the 2 lowest dilutions, followed by that for the 3, 4 and 5 lowest dilutions. A baseline is defined by the median RFU for that set of points with the lowest %CV below a threshold of 15%. If no set of points had a %CV below the threshold, the baseline is set to zero.”
After background subtraction had been performed, the significant differences between plasma- and urine-derived exosomes was assessed using row-by-row t test, and additional correction for multiple testing was applied using the Benjamini–Hochberg (BH) procedure. Negative values were made zero and proteins with zeros for both means were eliminated from further analysis. Hierarchical clustering was performed using Euclidean distance with the complete linkage method. All graphs in were generated using R in RStudio version 0.99.483 for Windows (RStudio, Inc., Boston, MA).
If protein identifications are represented as genes, in the Gene Ontology analysis, any SOMAmer® which report with 2 or more genes because they may recognize a protein complex, all gene names were included. The protein identifications which demonstrated significant differences and a minimum of a 1.5-fold change were analysed using FunRich version 2.1.2 for Windows (Citation30) to examine the subcellular location of the proteins. This was performed using the UniProt Human Taxon (13/10/2015) as a background and the Entrez gene accession numbers as the method of gene annotation for each of the SOMAmer®'s of interest. The most significantly enriched subcellular locations are depicted in c and 7c.
All other graphs were generated using GraphPad Prism version 5.01 for Windows (GraphPad Software, San Diego, CA), which was also used to calculate statistics for comparing groups (data presented in ), based on 1-way ANOVA, with Tukey's honest significance post-test, where *p<0.05, *p<0.01, ***p<0.001 and ****<0.0001.
Results
Isolation of vesicles from plasma specimens
Several methods for isolating exosome vesicles from plasma were tested including ultracentrifugation, Optiprep™ gradient ultracentrifugation, tangential flow filtration, dialysis and various combinations of these. We found that these methods poorly separated the vesicles from the bulk of non-exosomal protein. Some methods were also very time consuming, taking up to 2 days to perform and thus making them impractical for processing potentially large numbers of clinical samples (data not shown). We subsequently explored other options, including the simple size-exclusion chromatographic approach described recently by Böing et al. (Citation23), based on packing a 10-ml syringe barrel with ~12-ml Sepharose CL-2B. This was successful in the separation of most of the vesicles from the majority of the blood proteins and was performed in a comparable manner to a commercially available column (Midi Column, Cell Guidance Systems, Cambridge), as we previously described (Citation31). However, the use of a longer column (30-cm long) with a smaller diameter (around 0.5 cm), as shown in a, with the same 12-ml bed volume of Sepharose CL-2B, we were able to see an improvement in resolution with slightly better separation of vesicles from albumin and other proteins (data not shown).
Using our variation on this method, depicted in a, pre-cleared healthy donor plasma was defrosted at RT prior to loading onto a pre-prepared column. To inhibit coagulation, 1.8 mg/ml K3EDTA was added to PBS as the mobile phase buffer. Up to 30 fractions of 500 µl were collected, taking 1–2 h to complete. A proportion of each fraction was assayed for protein (by absorbance at 280 nm, using a NanoDrop™ device) and assessed for nanoparticles using the NanoSight™ platform (Citation27). Over 95% of the protein contained within the fraction series was present between fractions 15 and 26 (a). The particle-to-protein ratio was used as a means of estimating vesicle purity as previously described (Citation27), and this showed the purest eluates encompassed fractions 10–18.
Fig. 2. Analysis of plasma fractionated by size-exclusion chromatography. Pre-cleared plasma was subject to separation on a 12-cm long Sepharose CL2B size-exclusion column, and 30× serial 500-µl fractions were collected and analysed. The protein concentration was estimated by NanoDrop™ (absorbance at 280 nm), and the particle concentration was measured by nanoparticle tracking analysis (NanoSight™). Individual fractions where NanoSight™ analysis was not performed are indicated (with an X). The ratio of particles to protein (particles/µg) was calculated and plotted (left axis: blue bars) with total protein on the right axis (red line) (a). A proportion of the same fraction series was immobilized onto high-protein-binding microplate strips and allowed to couple overnight. After blocking, wells were stained with primary antibodies against CD9, CD81, ApoB or HSA, and binding detected using a time-resolved fluorometric readout (arbitrary TRF units shown) (b). Selected fractions (F10 to F15), identified as vesicle rich but protein low by the aforementioned assays, were pooled and concentrated by ultracentrifugation. After re-suspending the pellet, a proportion was examined by cryo-EM (scale bar=100 nm), and representative fields are shown (c). A proportion was also analysed by nanoparticle tracking to examine the size distribution of particles in the final sample, and the histogram mean and mode is shown (based on triplicate measurements) (d).
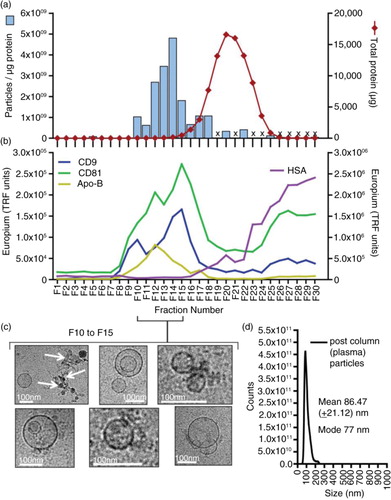
By staining a proportion of each fraction applied to a protein-binding microtitre plate, we were able to track the presence of typical exosome-vesicle-associated proteins, revealing a peak between fractions 10 and 18 containing the tetraspanin proteins CD9 and CD81 (b, left axis). We also saw some staining, albeit weaker for ApoB in the same fractions. The signal for HSA (b, right axis) began to increase strongly after fraction 15, corresponding to the increase in total protein, but this signal continued to rise beyond fraction 30. On 3 occasions, we attempted to demonstrate exosome-associated markers along the SEC-derived fraction series by western blotting, but each time the protein load in the wells was simply overwhelming and prevented us from generating comparable gels as seen for the urine samples (to follow).
Based on the above, selecting fractions 10–15 ensures maximal capture of vesicle markers and high particle-to-protein ratios. Some signal for HSA was still apparent within these fractions and so HSA may not have been removed completely by selecting fractions 10–15; however, this selection minimized its inclusion while retaining as much vesicle marker as possible. At this time, however, it is not clear whether the presence of ApoB in the exosome-rich fractions is due to the co-isolation of lipoproteins or whether the ApoB may be a constituent part of the exosomes as previously documented (Citation32, Citation33).
The selected fractions were subsequently subjected to a centrifugation step to further wash away non-vesicular proteins and concentrate the sample. Cryo-electron microscopy of the resuspended pellet revealed populations of lipid-bounded, spherical vesicles of typical exosomal size (~100 nm). These structures were not uniform in appearance, with some heterogeneity revealing occasional vesicles with the appearance of being within other vesicles (c). This phenomenon is not unusual and has been observed in other studies (Citation34, Citation35). There are, however, other rare electron dense structures present in some microscopic fields, possibly representing lipoproteins (Citation36) or debris of unknown nature (c, arrows). Overall, however, analysis of particulate material in the final preparations by NanoSight™ reveals a single monodisperse peak consistent with a preparation of small vesicles with exosome characteristics (d).
Isolation of vesicles from urine specimens
We adapted the above isolation protocol in order to accommodate the large volume of urine collected for the study, as summarized (b). Pre-cleared urine was concentrated down to a pellet, and resuspended in 500-µl PBS and loaded onto a pre-prepared mini Sepharose column (a 2-ml syringe barrel, holding 1-ml Sepharose CL2B). Up to 30 fractions of 165 µl were collected taking 10–15 min to complete, and the protein and particle concentrations were determined. The fractions were analysed as above by the same microtitre plate assay and also by western blotting; staining for markers as indicated. Uncropped blots are shown (Supplementary Fig. 1).
The western blots reveal a clear separation of the HSA-containing fractions from those containing some of the classical exosome-associated markers, TSG101, ALIX and LAMP2 (a). These exosome marker positive fractions (Citation6–Citation12) also exhibited the highest particle-to-protein ratios (b) and had the highest levels of CD9 staining (c). One of the most abundant urinary proteins is the THP, also known as uromodulin, which is present as a glucose-6-phosphate isomerase (GPI)-anchored monomeric membrane protein of around 68 kDa but is also found as huge aggregates in urine (Citation37). THP, however, was not separated from the exosome-containing fractions by the ultracentrifugation/SEC method (c), and in fact showed a very broad elution profile consistent with a wide range of molecular weights. Its first appearance, in fraction 5, coincides with the first appearance of exosome-related proteins, and this suggests potentially some degree of exosome association.
Fig. 3. Analysis of urine fractionated by ultracentrifugation and size-exclusion chromatography. Urine was concentrated by pelleting (200,000×g, 2 h, 4°C) and after re-suspending, the material was fractionated using a Sepharose CL-2B size-exclusion chromatography column. Thirty fractions were collected. Equal volumes of fraction 4 to fraction 25 were examined by western blotting; staining for the endo/lysosomal-related proteins including TSG101, ALIX, LAMP2 or for serum albumin (HSA). For this number of samples, 2 gels were required, and the position of the divide between the gels is indicated by a dotted line (a). In addition, the protein and particle concentrations were determined (for the latter, those that were not measured are denoted by an X). The particle-to-protein ratio was calculated and is plotted (blue bars) together with total protein estimation (red line) (b). A proportion of the same fraction series was immobilized onto high-protein-binding microplate strips and allowed to couple overnight. After blocking, wells were stained with primary antibodies against CD9, THP (uromodulin), HSA or isotype control, and binding detected using a time-resolved fluorometric readout (arbitrary TRF units shown) (c). Selected fractions (F5 to F12), identified as vesicle rich but protein low by the aforementioned assays, were pooled and concentrated by ultracentrifugation. After re-suspending the pellet, a proportion was examined by cryo-EM (scale bar=100 nm), and representative fields are shown (d). A proportion was also analysed by nanoparticle tracking to examine the size distribution of particles in the final sample, and the histogram mean and mode is shown (based on triplicate measurements) (e).
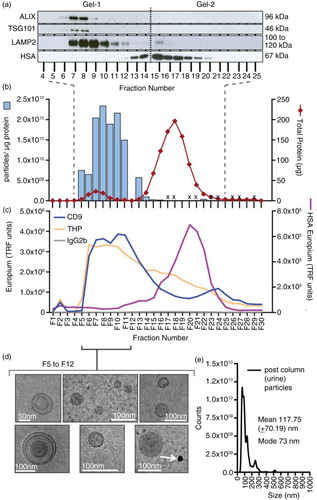
Fractions 5–12 that have high particle-to-protein ratio, high exosome marker and low HSA were pooled and subjected to an ultracentrifugation wash and concentration step. Observations by cryo-EM (d) revealed membrane-bounded vesicular structures of sizes consistent with the exosome vesicles similar to those isolated from plasma. There were few microscopic fields containing the aforementioned dense structures that would not be considered as vesicles (d, arrows). Analysis of the final preparation by NanoSight™ shows, overall, a predominant peak of typical exosome size (mode of 73 nm), with perhaps some occasional particulates at larger sizes (e).
Assessing vesicle yield, purity and variation across healthy donors
We performed the above workflows for plasma (n=10) and urinary (n=13) specimens donated from healthy male volunteers in order to assess the amount of vesicles that we could isolate and also to examine the variation we might expect using this approach. Analysing the post-column eluates using all of the aforementioned assays would consume too much sample, however, leaving too little for subsequent proteomics analyses, and hence we could not use this approach for selecting relevant vesicle-containing fractions. On occasion, some columns ran 1 or 2 fractions fast/slow and, hence, we decided against relying on fraction number as an absolute means of fraction selection. Instead, we based fraction selection on the protein assessment. Regardless of columns dimensions (plasma or urine columns), we consistently saw a small “hump” in the protein levels corresponding to the vesicle-containing factions. This is nicely shown b (red line, fractions 5–10). Our selections were, therefore, based on the position of this “hump,” and we pooled the fractions spanned by this protein peak.
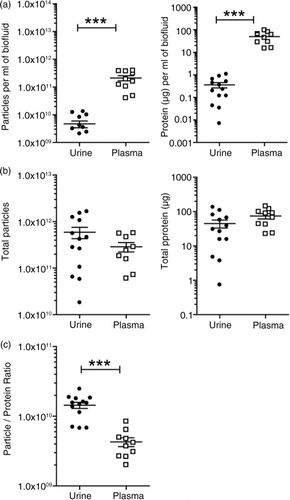
The pooled fractions were pelleted and the final product analysed for protein and particle concentration, by NanoDrop™ and NanoSight™ analysis, respectively (). As a source of vesicles, plasma gave significantly more (p<0.001) material in terms of particles (around 45-fold) and protein (around 137-fold) (a) per ml of input volume compared to urine. The urinary volume obtained from individuals was variable, but at least 60 ml was processed for each donor, while a consistent 1.5 ml was achieved across the individuals for plasma. When making comparisons irrespective of input volume, the total isolated particle (urine=5.91×10¹¹±5.76×10¹¹ versus plasma=2.88×10¹¹±1.98×10¹¹, p>0.05) and protein (urine=44.82±42.47 µg versus plasma=73.92±41.04 µg, p>0.5) quantities were approximately comparable, with greater variance in the urine samples partly explained by this input volume issue (b). We also examined the particle-to-protein ratio across these specimens, as a simple means of estimating vesicle purity. The average of urine-derived vesicle preparations exhibited a 3.36-fold higher ratio than plasma vesicles, indicating that the final preparations generated from urine were purer overall than those taken from plasma (p<0.001). In fact, the urinary particle-to-protein ratios were approaching the purity of samples generated from cell culture sources (Citation27). When normalizing the specimen for subsequent proteomics analysis, we suggest that a greater proportion of the urine sample would constitute vesicles compared to plasma, and given the complexity of the plasma proteome, this is not entirely unexpected.
Fig. 4. Vesicle yields and purity. Urine or plasma specimens were collected from healthy male donors and processed by the aforementioned methods to generate a preparation of vesicles. For each run of plasma (n=10 donors), a total volume of 1.5 ml was processed. The urine donated (n=13), however, was more variable, ranging from 60 to 250 ml. The final vesicle preparations were measured for protein and particles and the data plotted as dot-plots where each symbol is a different donor, and the mean and standard error is shown. In (a), the data are corrected for the initial starting volume (p≤0.001), indicating that plasma provides greater quantity of particles and protein compared to urine. In (b), data show the total material achieved in the vesicle isolates irrespective of input volume. The particle-to-protein ratio as an estimation of sample purity is depicted in (c) (p≤0.001).
Protein profiling of vesicle isolates
We next tested the compatibility of our SEC-derived vesicle isolates with a well-established liquid chromatography/mass-spectrometric platform (LC-MALDI) as we previously described for cell-culture-derived exosomes (Citation28). We did this with plasma and not urine, as this was the more challenging specimen type, in terms of vesicle purity. Using healthy donor plasma as the vesicle source, we generated a list of only 21 proteins (reporting with ≥2 peptides), compared to over 300 proteins with cell-culture-derived vesicles (Citation28), and these represented the usual high abundance blood proteins, and was devoid of identifications we would ascribe to vesicles (Supplementary Table 1). While performing SEC followed by ultracentrifugation, >97% of protein were eliminated. Nevertheless, the sample remained too replete with these high abundance proteins to generate useful data by this MS approach.
We therefore considered using an alternative protein-profiling technology, based on a protein array platform as this successfully generated reliable, semi-quantitative data with cultured cancer-cell-derived exosomes as a specimen (Citation26). We expected that contaminating protein in the isolates would not confound the identification of lower abundant proteins of interest with the array method. We also wanted to examine the reproducibility of our vesicle isolation workflow and how variance here may impact the proteomics data quality. For this experiment, therefore, we pooled healthy donor plasma or urine, and each pool was separated by 3 independent SEC columns. Vesicle isolates were shipped to SomaLogic™ (Boulder, CO) for analysis. Specimens were examined on the SOMAscan® v3.0 array at a concentration of 60 µg/ml protein. This dose was predetermined by a titration experiment in which most of the target proteins within the array menu reported with signal above the background at this dose.
The data are summarized in and appended in full as Supplementary Table 2. shows the positive identification of 1,035 proteins following background correction and good reproducibility across the replicates. For urine, the median %CV across the identified proteins was only 4.1%, with over 87% of these below 10% CV. This was slightly less consistent for plasma, with a median of 7.7% CV and 68% below 10%. Some of the identifications reported with a low signal, for example, with an RFU<200 units; approaching the lower limits of detection of the array. Some studies have utilized an arbitrary cut-off value of 200 RFU, to gain greater confidence of a positive identification, at the expense of losing some potentially relevant results (Citation26). Because of the background correction performed here, however, we chose to present the entire data without such a cut-off and cautiously consider these low signal proteins as low abundance positives.
Fig. 5. Proteomics analysis of vesicles derived from healthy donor urine and plasma. A pool of healthy donor urine or plasma was used as a source of biofluid and for each, 3 separate isolation procedures were undertaken to generate technical replicates. To help evaluate the reproducibility of the preparation methods, the specimens were subject to protein profiling using the SOMAscan ® protein array. A total of 1,035 proteins was identified following background correction, and these are represented by a scatter plot of the loge of the RFU values for both exosome sources. The different coloured circles represent the statistical significance of each protein as determined by row-by-row t test (with BH correction), as indicated in parentheses (a). Some examples of proteins more highly expressed in urine (b) or plasma (c) are shown. A total of 392 proteins exhibited comparable expression levels (p≥0.05) in both urine- and plasma-derived vesicles (d). (Bars show mean RFU values±SD SD of triplicates, **p≤0.01, ***p≤0.001, ****p≤0.0001). The full data set is available as Supplementary Table 2. Venn diagram compares the urine results, with previously published studies of healthy donor urinary exosomes, using mass spectrometry, showing the degree of identifications in agreement across these data sets (e).
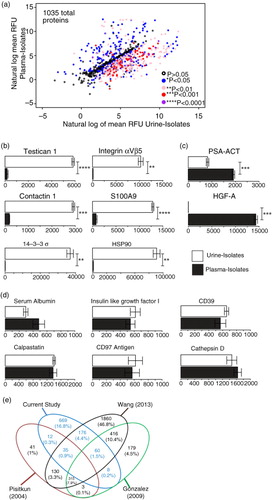
We compared the relative levels of identified proteins in urine and plasma vesicle isolates. There were significant differences seen for 643 proteins, and the level of significance is shown (as coloured symbols in a). We found, for example, a total of 317 proteins at the significance level of p≤0.01 that were more abundant in urine vesicles compared to plasma vesicles. These included contactin 1 (14-fold higher), S100A9 (16-fold), testican 1 (28-fold), integrin αVβ5 (61-fold) and HSP90α/β (over 70-fold) (shown in b). Although some proteins showed infinite enrichment in urine compared to plasma (i.e. presence versus absence), such as Hsp90 co-chaperone Cdc37 (CDC37) or fibroblast growth factor 7 (FGF7), most of these reported with very low RFU values, and we are uncertain about the level of enrichment of these. There were examples, however, of proteins of over 100-fold more abundance in urine and reporting with high RFU values indicating a strong detection signal, including vacuolar protein sorting-associated protein VTA1 homolog (DRG-1) (over 1,600-fold), galectin-8 (almost 700-fold), Ras-related C3 botulinum toxin substrate 1 (RAC1) (315-fold) and others. Most of these have previous reports pointing to vesicle association from searching Vesiclepedia (19 Jan 2016) (Citation5).
Similarly, there were 45 proteins that were more highly expressed (p≤0.01) in plasma-derived vesicles, and, as described above, the level of relative enrichment for some was striking, including protein S (over 5,000-fold), complement factor H (over 3,500-fold), fibrinogen (over 800-fold), α2-macroglobulin (over 700-fold), as well as more modest levels of relative enrichment of hepatocyte growth factor activator (HGF-A) (312-fold) and PSA–ACT (PSA–antichymotrypsin complex) (2.3-fold) (c). A handful of other proteins would also have shown enrichment in blood versus urinary isolates, such as platelet factor-4 (PF-4) or plasma kallikrein; however, due to the high variation in the triplicates for these particular analytes, they reported high p values and are considered as not confidently different (Supplementary Table 2). Many within this list of 45 proteins would be consistent with the carryover of blood proteins into our vesicle isolates. Having said this, we may particularly have expected high albumin levels for plasma-derived vesicles, as this protein accounts for around 55% of total blood proteins. The signal strength for albumin was surprisingly low and similar to the urine-vesicle level; presenting good evidence for a major removal of albumin from the samples (d). Many membrane-associated proteins, however, are found in this list, for example, integrin αIIb,β3 complex (190-fold more in plasma versus urine), neurogenic locus notch homolog protein 1 (Notch1) (46-fold), and high-affinity immunoglobulin gamma Fc receptor-I (36-fold). The data likely, therefore, represent membrane vesicles and blood proteins, and point to the advantage of the protein-array method for identifying membrane/vesicular proteins even in the presence of high signals for some of the aforementioned blood-related components.
There were 392 proteins in total that did not reach significant differences when comparing plasma and urinary isolates. These reported with broadly comparable RFU levels between the biofluid sources including insulin-like growth factor-1 (IGF-1), calpastatin, cathepsin-D, and the membrane proteins CD39 and CD97 (shown in d), vascular cell adhesion protein 1 (VCAM-1), Wnt inhibitory factor 1 (WIF-1), CD30 and many others. These are again examples of previously reported vesicle-related proteins, and suggest vesicles in plasma and urine show many common features (Citation5).
We examined the Vesiclepedia database to search for previous exosome-proteomics studies in relation to healthy donor urine. We chose not to do this with respect to plasma, given the aforementioned issues of sample purity. For urine, we identified 3 such studies with good numbers of listed proteins. Specifically, a study by Pisitkun et al. (Citation13) (Vesiclepedia ID: 13) reported 614 identifications; Gonzales et al. (Citation38) (VP-ID: 63) reported 1,059 identifications; and Wang et al. (Citation39) (VP-ID: 437) reported 3,082 proteins, presented as a Venn diagram (e). There were 79 proteins that were common across these and our presented study, although this amounted to only 2% overlap of all the considered proteins. These common proteins included several enzymatic elements related to metabolic activity, malate dehydrogenase-1 (MDH1), GPI, and phosphogluconate dehydrogenase (PGD). There were identifications associated with protease regulation, serpin peptidase inhibitor (SERPING1), inter-alpha-trypsin inhibitor (ITIH4), membrane-related proteins; phosphatidylethanolamine-binding protein 1(PEBP1) and clusterin (CLU) in addition to markers of endocytic compartments (vesicle (multivesicular body) trafficking 1). These common elements lacked the expected exosome markers like tetraspanins, TSG101, Alix or others, as these are not currently included within the SOMAscan® menu. They are, however, shown as present in the urine-vesicle specimens by western blotting and other approaches (). Our study shows 350 proteins overlap with the Wang study, whereas the same comparison of Pisitkun or Gonzalez with Wang shows 559 and 870 proteins overlapping, respectively. This, we believe, is a reflection of the very different technologies used here that has identified 669 proteins not found by these other studies.
Analysis of vesicles from men with prostate cancer
Having established that the vesicle isolation method and SOMAscan® platform were a suitable combination for analysing plasma and urine-vesicle isolates, we went on to analyse clinical samples from patients with metastatic prostate cancer. A bespoke sample collection was initiated, aiming to collect plasma and urine from prostate cancer patients who were either newly diagnosed with multiple metastasis and had received no therapeutic intervention (Arm A) or from men who had failed first- and second-line treatments and had hormone-refractive progressive disease (Arm B). Such a comparison would highlight markers indicative of treatment failure, which would be clinically useful if obtained in a non-invasive manner. Although we had intended to collect from 12 to 20 individuals in each group, this was not possible in the timeframe available for the study. In addition, some urine specimens were of low volume or contained blood and did not provide sufficient material for proteomics analysis; and hence we were able to generate successful vesicle preparations from a total of 11 plasma and only 5 urinary donations.
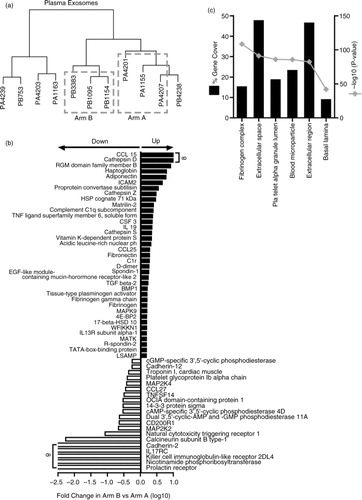
For plasma vesicles, comparison of Arm A with Arm B disappointingly revealed that none of the 990 identified proteins were significantly different across these groups, when using the BH correction. Even when applying an arbitrary cut-off, in order to remove any noise in the data from identifications reporting with an RFU<200, only 2 proteins became significant with the BH procedure namely; complement C 1r and 14-3-3 (p<0.001). This filtering had no impact on BH-corrected statistics for the urinary samples. This is an issue related to the variation from genuine biological replicates, and too few specimens. Although we concede this as a serious limitation of the current study, we wanted to find some proteins that might serve to discriminate these patient groups. We therefore decided to use a clustering approach, removing the extreme outliers and only comparing the more tightly clustered specimens therefore. This allowed for an A versus B comparison with 3 donors in each arm (a). This comparison highlighted that 102 proteins exhibited significant differences (p≤0.05, without BH correction) and, of these, 57 proteins showed a ≥±1.5-fold difference between arms A and B (37 elevated and 20 decreased) (b and Supplementary Table 3A). Proteins, including C–C motif chemokine-15 (CCL15) and cathepsin-D, were essentially not detected in patients in Arm A and were only apparent in progressive disease. Other elements, including adiponectin, intercellular adhesion molecule-2 (ICAM-2), transforming growth factor beta-2 (TGFβ2) and bone morphogenic protein-1 (BMP1) are examples of those elevated in progressive disease. In contrast, the prolactin receptor, killer cell immunoglobulin-like receptor 2DL4 (KIR2DL4), interleukin-17 receptor-C (IL-17RC), cadherin-2 and others were lost on disease progression, together with a reduction in natural cytotoxicity triggering receptor-1 (NCR1), CD200R1, C–C motif chemokine 27 (CCL27) and several others implicated in inflammation, immune function, adhesion and other processes. Some of the proteins in the list might normally be considered as high abundance blood-associated proteins like complement C1q, fibronectin and protein S. It is important to consider that some of these identifications may reflect non-vesicular elements in the preparations. Functional enrichment analysis, based on the 57 proteins, was performed using the FunRich tool (Citation30) and revealed significant associations with terms including “platelet alpha granule lumen,” “extracellular space,” “blood microparticles,” “extracellular region,” and others that may be consistent overall with a vesicle analysis (c).
Fig. 6. Comparison of prostate cancer patient plasma-derived vesicles. Vesicle isolates were prepared from the plasma of metastatic prostate cancer patients and assayed by SOMAscan ® . Cluster analysis was performed (n=11 patients), and 3 samples were selected for further analysis from arms A and B; denoted by dashed line boxes. The sample identifiers are annotated with a letter “P” for plasma and then either an “A” or “B” denoting study arm (a). Of 990 proteins identified by the assay, 102 showed significance (p<0.05) between the 2 arms. Of these, 57 exhibited ≥±1.5-fold change difference in Arm B compared to Arm A (37 elevated and 20 reduced) (b). Results of functional enrichment analysis to examine the subcellular location of the proteins are depicted where the grey line represents log10 (p value) and black bars represent % gene coverage (c). The data set is shown in Supplementary Table 3A.
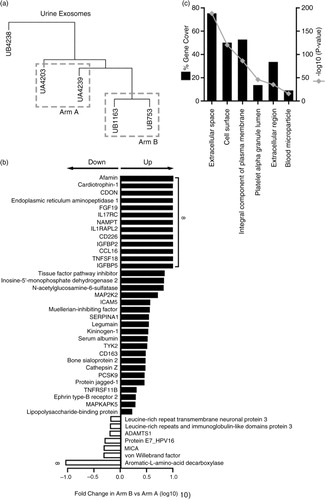
Similarly, this approach was also taken with a limited number of available urinary vesicle isolates. Clustering was used to select 2 patients for each arm for subsequent analysis (a), which gave 62 proteins with significant differences across the 2 groups (p≤0.05) and 41 showed a ≥±1.5-fold difference (b). Of those, several growth factors/cytokines were evidently increased including FGF19, insulin-like growth factor-binding proteins 2 and 5 (IGFBP2 and IGFBP5), C–C motif chemokine-16 (CCL16) and CD226 antigen in progressive disease. MHC class I polypeptide-related sequence-A (MICA), von Willebrand factor and A disintegrin and metalloproteinase with thrombospondin motifs 1 (ADAMTS1) were reduced upon progressive disease. There was an absence of high abundance blood proteins, such as complement factors from the list, perhaps as expected; however, serum albumin was present and apparently elevated in the urine vesicles during progression. Functional enrichment analysis of the list again highlighted terms including “extracellular space,” “platelet alpha granule lumen” and “blood microparticle,” as we found for plasma vesicles, and the overall ontology information was similar.
Fig. 7. Comparison of prostate cancer patient urine-derived vesicles. Vesicle isolates were prepared from the urine of metastatic prostate cancer patients and assayed by SOMAscan ® . Cluster analysis was performed (n=5 patients), and 2 samples were selected for further analysis from arms A and B, denoted by dashed line boxes. The sample identifiers are annotated with a letter “U” for urine and then either an “A” or “B” denoting study arm (a). In this case, 993 proteins were identified in this 2 versus 2 comparison, of which 62 proteins showed significance (p<0.05) between the 2 arms. Out of these, 41 proteins demonstrated 1≥±1.5-fold change difference in Arm B compared to Arm A (33 elevated, 7 decreased) (b). Results of functional enrichment analysis to examine the subcellular location of the proteins are depicted (c), where the grey line represents log10 (p value), and black bars represent % gene coverage. The data set is shown in Supplementary Table 3B.
Discussion
In this study, we present a practical means for the isolation and proteomic analysis of vesicles in blood plasma and in urinary specimens. Although the schemes we have derived require some sample-handling time, it is nevertheless an approach amenable to handling tens of samples in a clinical study while also providing a final vesicle-rich preparation of good purity and reproducible yields. The combination of the sample-processing steps, together with a protein-array technology, generates a data set that would not otherwise be available from more traditional, mass-spectrometric-based methods. We suggest that our study presents a platform that can be built upon in general and hopefully applied to diverse clinical settings.
Generating very pure vesicles isolated from biofluids has remained a major problem for researchers searching for vesicle-associated disease biomarkers. Arguably, this issue may be less of a concern when examining vesicular RNA where material not encapsulated within the vesicles can be enzymatically cleared with RNAse (Citation6). With highly proteinaceous biofluids like plasma, however, the removal of a limited repertoire of very highly abundant proteins has frustrated the progress of vesicle proteomics somewhat, requiring some very long and labour-intensive protocols to partially overcome this issue (Citation21). As a preliminary step to this work, we had also evaluated the ultracentrifugation of biofluids on gradients or cushions (Citation40) and concluded that the time required for each specimen was very limiting in terms of sample throughput. Even with OptiPrep as a separation medium, reportedly giving superior resolution compared to sucrose gradients (Citation41), we found incomplete separation of vesicle-containing fractions from blood proteins, particularly albumin, and the fractions of exosomal density (1.2–1.2 g/L) retained the pigment colour of bilirubin (data not shown). In contrast, employing a SEC step as our principal mode of separating vesicles from biofluid proteins provides a relatively effective method that can be performed in a reasonably short timeframe. Other researchers have also utilized a chromatographic approach to fractionate biofluids to good effect, both in terms of plasma (Citation42, Citation43) and urine (Citation44). With these and, indeed, our protocol, there are a diverse range of choices and variables to be optimized in these workflows, including different preclearing steps, different means of sample concentration (ultracentrifugation, precipitation or various concentration devices like Centricon-centrifugation concentrators) (Citation42, Citation44), and indeed different resins and column dimensions for chromatographic separation (Citation31, Citation43). Studies by these and other researchers continue to strive towards the simplest and most-effective workflow for isolating the purest possible vesicles from such complex source material, yet it is likely that chromatographic approaches are here to stay, given their simplicity and relative efficacy in this regard.
The handling of urine specimens required prior concentration of vesicles prior to SEC, and we used ultracentrifugation for this step. This, together with filtering, removes a proportion of non-vesicular material prior to SEC-based clean-up, and this is therefore not a single-step approach, as described by Böing et al. for platelet concentrates (Citation23), but is more comparable to the method described by Lozano-Ramos et al. (Citation44), who used a centrifugation concentration step prior to SEC fractionation. For urine, the fractions of interest arising from the column showed typical traits of exosomes, comprising small membrane-bounded vesicles that were strongly positive for surface tetraspanin proteins and positive for endocytic markers TSG101, LAMP2 and Alix. These preparations were of good purity and were sufficiently devoid of protein load as to provide excellent samples for western blotting, for example. Pooling selected fractions was followed by a further ultracentrifuge wash/spin, giving a final specimen of very good purity, according to our previously published particle-to-protein assessment (Citation27). It is clear, however, that as one of the most abundant urinary proteins, THP (Tamm–Horsfall protein or uromodulin) was not removed from the vesicle-containing fractions as this remained readily detected across a broad range of vesicle-positive and vesicle-negative fractions. Other steps, such as the salt-based precipitation of THP (Citation45) or the use of DTT (Citation38), have been proposed by other researchers as a means of THP reduction in urinary vesicle specimens, and this seemed successful in the Lozano-Ramos study (Citation44). We chose not to adopt these steps as high salt or DTT may interfere with the proteomics array. Instead, we proceeded with a level of THP in these vesicle isolates and have nevertheless generated a quality proteome data set from the samples. When comparing our data with some previous studies of urinary vesicle protein profiling, we highlight the unique identification of over 600 proteins, not previously identified. Most of the SOMAscan® menu of 1,029 proteins therefore represents proteins that were not detected by the more traditional MS-based methods with this specimen type. This brings a complementary technology to this topic that can highlight elements which are difficult to reveal by the usual methods, hopefully facilitating the discovery of new, disease-relevant markers.
The fractions generated from plasma following the use of long columns for SEC were effective at reducing the vast majority of blood proteins from the sample, and we estimate this to be >97% reduction. The relevant fractions showed evidence of typical exosome vesicles by cryo-EM together with positive tetraspanin expression. There remained detectable, albeit low levels of albumin in the vesicle-containing fractions and likely also a host of other typical blood proteins. The proteomics data point to components of the complement and clotting systems, for example, certainly indicative of an imperfect purification of vesicles, and many of these like d-dimer, fibronectin, properdin reported with very high RFU values suggestive of very high abundance in the specimen. In addition, the final particle-to-protein ratios generated from plasma also indicated a sample of inferior purity compared to urine. Certainly, our failure to generate useful data based on LC–MS with such samples would point to the presence of dominant/confounding blood proteins in these preparations that mask the identification of more interesting, low abundant and vesicle-related proteins. Working with plasma for vesicle proteomics, therefore, remains a challenge, and our presented sample-handling workflow facilitates a major depletion of such contaminants but is only a partial success, as it does not achieve elimination. We have learned that tracking albumin as an example blood protein may not give an entirely accurate account of blood-protein carryover, and based on these data, we would also include some of the aforementioned abundant blood components, for example, d-dimer, to better assess the impact of the clean-up steps employed. It is difficult, however, to ascertain whether a protein element is a co-isolated contaminant or if it is genuinely associated with vesicles in the isolates. While we have tried to well qualify the nature of the inputted material by an assortment of assays including their chromatographic mobility, the presence of certain markers, and imaging and sizing of vesicles as advised by the recent ISEV-position paper (Citation46), absolute vesicle association remains ambiguous with such complex biofluid samples. Further effort to tease this out on a protein-by-protein basis would be needed for the candidates of greatest interest and could be achieved using a post-column affinity isolation method or immunolabelling and electron microscopy.
As with many such studies, translating workflows developed with healthy donor specimens to clinical specimens proved challenging in the available timeframe for the study. In particular, urine donations from metastatic prostate cancer patients proved difficult to obtain, with several unsuitable for subsequent processing due to insufficient volume (that is, <60 ml) and/or due to the presence of macroscopic haematuria. We are, therefore, cautious about statements in relation to these clinical specimens, as the study lacks sufficient power to make firm conclusions. Nevertheless, the combination of isolation method and protein array proved to be achievable and generated identifications that potentially discriminate newly diagnosed from progressive prostate cancer. In plasma isolates, a number of elevated proteins known as markers of prostate cancer or of disease progression were highlighted, including haptoglobin (Citation47), adiponectin (Citation48), proprotein convertase subtilisin (Citation49), cathepsin-S (Citation50), the spondin-related members (R-spondin-2 and spondon-1) (Citation51) and the invasion marker tissue-type plasminogen activator (Citation52). The loss of other proteins such as epithelial-adhesive molecules, cadherins and proteins related to immune function (CD200R1, KIR2DL4) would also be consistent with worsening disease. Many others in the list are not to our knowledge particularly related to prostate, or cancer progression such as matrilin-2, or 4E-BP2, and as such have cautious potential value as novel elements related to progression. Similarly, urinary vesicles showed some proteins with known associations with prostate cancer including kininogen-1 (Citation53) and insulin-like binding proteins (Citation54), with again cautiously novel proteins including Afamin, cardiotrophin-1, legumain and others as elevated during progression.
In summary, we have developed practical methods suitable for the enrichment of vesicles from plasma and particularly for urinary specimens, based on combinations of ultracentrifugation and chromatography. The resulting vesicle-rich samples are purer when from urine compared to plasma and are both of consistent quality and of sufficient quantity for proteomics analysis. Analysis using a multiplex protein-assay (SOMAscan®) provides a useful solution to the problem of co-isolated blood proteins and generates a comprehensive profile of around 1,000 proteins present in the vesicle isolates. As a proof of concept, we show the utility of this approach with clinical specimens from men with metastatic prostate cancer and show the potential to apply these tools for biomarker discovery in cancer and hopefully other disease scenarios.
Conflict of interest and funding
The study was funded through an award by the Movember Foundation as part of the Global action plan-1; exosome biomarker initiative, to an international consortium which included AC, MDM and JMFP. There are no conflicting interests to declare.
Supplementary Figure S1
Download PDF (8.8 MB)Supplementary Table 2
Download MS Excel (155.3 KB)Supplementary Table 3
Download MS Excel (89.8 KB)Notes
To access the supplementary material to this article, please see Supplementary files under ‘Article Tools’.
Related Research Data
References
- Cancer Research UK online statistics. [cited 25th June 2015]. Available from: http://www.cancerresearchuk.org/health-professional/cancer-statistics/.
- Howlader N, Noone A, Krapcho M, Garshell J, Miller D, Altekruse S, etal. SEER cancer statistics review, 1975–2012. 2015; Bethesda, MD: National Cancer Institute.
- Amaro A, Esposito AI, Gallina A, Nees M, Angelini G, Albini A, etal. Validation of proposed prostate cancer biomarkers with gene expression data: a long road to travel. Cancer Metastasis Rev. 2014; 33: 657–71. doi: http://dx.doi.org/10.1007/s10555-013-9470-4.
- Thery C, Zitvogel L, Amigorena S. Exosomes: composition, biogenesis and function. Nat Rev Immunol. 2002; 2: 569–79. doi: http://dx.doi.org/10.1038/nri855.
- Kalra H, Simpson RJ, Ji H, Aikawa E, Altevogt P, Askenase P, etal. Vesiclepedia: a compendium for extracellular vesicles with continuous community annotation. PLoS Biol. 2012; 10: e1001450, doi: http://dx.doi.org/10.1371/journal.pbio.1001450.
- Valadi H, Ekstrom K, Bossios A, Sjostrand M, Lee JJ, Lotvall JO. Exosome-mediated transfer of mRNAs and microRNAs is a novel mechanism of genetic exchange between cells. Nat Cell Biol. 2007; 9: 654–9. doi: http://dx.doi.org/10.1038/ncb1596.
- Thakur BK, Zhang H, Becker A, Matei I, Huang Y, Costa-Silva B, etal. Double-stranded DNA in exosomes: a novel biomarker in cancer detection. Cell Res. 2014; 24: 766–9. doi: http://dx.doi.org/10.1038/cr.2014.44.
- Yu X, Harris SL, Levine AJ. The regulation of exosome secretion: a novel function of the p53 protein. Cancer Res. 2006; 66: 4795–801. doi: http://dx.doi.org/10.1158/0008-5472.can-05-4579.
- Park JE, Tan HS, Datta A, Lai RC, Zhang H, Meng W, etal. Hypoxic tumor cell modulates its microenvironment to enhance angiogenic and metastatic potential by secretion of proteins and exosomes. Molec Cell Proteomics. 2010; 9: 1085–99. doi: http://dx.doi.org/10.1074/mcp.M900381-MCP200.
- Clayton A, Turkes A, Navabi H, Mason MD, Tabi Z. Induction of heat shock proteins in B-cell exosomes. J Cell Sci. 2005; 118: 3631–8. doi: http://dx.doi.org/10.1242/jcs.02494.
- Webber J, Yeung V, Clayton A. Extracellular vesicles as modulators of the cancer microenvironment. Semin Cell Dev Biol. 2015; 40: 27–34. doi: http://dx.doi.org/10.1016/j.semcdb.2015.01.013.
- Caby M-P, Lankar D, Vincendeau-Scherrer C, Raposo G, Bonnerot C. Exosomal-like vesicles are present in human blood plasma. Int Immunol. 2005; 17: 879–87. doi: http://dx.doi.org/10.1093/intimm/dxh267.
- Pisitkun T, Shen R-F, Knepper MA. Identification and proteomic profiling of exosomes in human urine. Proc Natl Acad Sci USA. 2004; 101: 13368–73. doi: http://dx.doi.org/10.1073/pnas.0403453101.
- Ogawa Y, Kanai-Azuma M, Akimoto Y, Kawakami H, Yanoshita R. Exosome-like vesicles with dipeptidyl peptidase IV in human saliva. Biol Pharm Bull. 2008; 31: 1059–62. doi: http://dx.doi.org/10.1248/bpb.31.1059.
- Andre F, Schartz NEC, Movassagh M, Flament C, Pautier P, Morice P, etal. Malignant effusions and immunogenic tumour-derived exosomes. Lancet. 2002; 360: 295–305. doi: http://dx.doi.org/10.1016/S0140-6736(02)09552-1.
- Duijvesz D, Luider T, Bangma CH, Jenster G. Exosomes as biomarker treasure chests for prostate cancer. Eur Urol. 2011; 59: 823–31. doi: http://dx.doi.org/10.1016/j.eururo.2010.12.031.
- Melo SA, Luecke LB, Kahlert C, Fernandez AF, Gammon ST, Kaye J, etal. Glypican-1 identifies cancer exosomes and detects early pancreatic cancer. Nature. 2015; 523: 177–82. doi: http://dx.doi.org/10.1038/nature14581.
- Taylor DD, Gercel-Taylor C. MicroRNA signatures of tumor-derived exosomes as diagnostic biomarkers of ovarian cancer. Gynecol Oncol. 2008; 110: 13–21. doi: http://dx.doi.org/10.1016/j.ygyno.2008.04.033.
- Zhou H, Pisitkun T, Aponte A, Yuen PS, Hoffert JD, Yasuda H, etal. Exosomal fetuin-A identified by proteomics: a novel urinary biomarker for detecting acute kidney injury. Kidney Int. 2006; 70: 1847–57. doi: http://dx.doi.org/10.1038/sj.ki.5001874.
- Lin J, Li J, Huang B, Liu J, Chen X, Chen XM, etal. Exosomes: novel biomarkers for clinical diagnosis. Sci. World J. 2015; 2015: 657086, doi: http://dx.doi.org/10.1155/2015/657086.
- Kalra H, Adda CG, Liem M, Ang C-S, Mechler A, Simpson RJ, etal. Comparative proteomics evaluation of plasma exosome isolation techniques and assessment of the stability of exosomes in normal human blood plasma. Proteomics. 2013; 13: 3354–64. doi: http://dx.doi.org/10.1002/pmic.201300282.
- Taylor DD, Chou I-N, Black PH. Isolation of plasma membrane fragments from cultured murine melanoma cells. Biochem Biophys Res Commun. 1983; 113: 470–6. doi: http://dx.doi.org/10.1016/0006-291X(83)91749-7.
- Böing AN, van der Pol E, Grootemaat AE, Coumans FA, Sturk A, Nieuwland R. Single-step isolation of extracellular vesicles by size-exclusion chromatography. J Extracell Vesicles. 2014; 3: 23430, doi: http://dx.doi.org/10.3402/jev.v3.23430.
- de Menezes-Neto A, Fidalgo Sáez MJ, Lozano-Ramos I, Segui-Barber J, Martin-Jaular L, Estanyol Ullate JM, etal. Size-exclusion chromatography as a stand-alone methodology identifies novel markers in mass spectrometry analyses of plasma-derived vesicles from healthy individuals. J Extracell Vesicles. 2015; 6: 27378, doi: http://dx.doi.org/10.3402/jev.v4.27378.
- Gold L, Ayers D, Bertino J, Bock C, Bock A, Brody EN, etal. Aptamer-based multiplexed proteomic technology for biomarker discovery. PLoS One. 2010; 5: e15004, doi: http://dx.doi.org/10.1371/journal.pone.0015004.
- Webber J, Stone TC, Katilius E, Smith BC, Gordon B, Mason MD, etal. Proteomics analysis of cancer exosomes using a novel modified aptamer-based array (SOMAscan™) platform. Mol Cell Proteomics. 2014; 13: 1050–64. doi: http://dx.doi.org/10.1074/mcp.M113.032136.
- Webber J, Clayton A. How pure are your vesicles?. J Extracell Vesicles. 2013; 2: 19861, doi: http://dx.doi.org/10.3402/jev.v2i0.19861.
- Welton JL, Khanna S, Giles PJ, Brennan P, Brewis IA, Staffurth J, etal. Proteomics analysis of bladder cancer exosomes. Mol Cell Proteomics. 2010; 9: 1324–38. doi: http://dx.doi.org/10.1074/mcp.M000063-MCP201.
- Rohloff JC, Gelinas AD, Jarvis TC, Ochsner UA, Schneider DJ, Gold L, etal. Nucleic acid ligands with protein-like side chains: modified aptamers and their use as diagnostic and therapeutic agents. Mol Ther Nucleic Acids. 2014; 3: e201, doi: http://dx.doi.org/10.1038/mtna.2014.49.
- Pathan M, Keerthikumar S, Ang CS, Gangoda L, Quek CY, Williamson NA, etal. FunRich: an open access standalone functional enrichment and interaction network analysis tool. Proteomics. 2015; 15: 2597–601. doi: http://dx.doi.org/10.1002/pmic.201400515.
- Welton JL, Webber JP, Botos LA, Jones M, Clayton A. Ready-made chromatography columns for extracellular vesicle isolation from plasma. J Extracell Vesicles. 2015; 4: 27269, doi: http://dx.doi.org/10.3402/jev.v4.27269.
- Liang B, Peng P, Chen S, Li L, Zhang M, Cao D, etal. Characterization and proteomic analysis of ovarian cancer-derived exosomes. J Proteomics. 2013; 80: 171–82. doi: http://dx.doi.org/10.1016/j.jprot.2012.12.029.
- Looze C, Yui D, Leung L, Ingham M, Kaler M, Yao X, etal. Proteomic profiling of human plasma exosomes identifies PPARgamma as an exosome-associated protein. Biochem Biophys Res Commun. 2009; 378: 433–8. doi: http://dx.doi.org/10.1016/j.bbrc.2008.11.050.
- Coleman BM, Hanssen E, Lawson VA, Hill AF. Prion-infected cells regulate the release of exosomes with distinct ultrastructural features. FASEB J. 2012; 26: 4160–73. doi: http://dx.doi.org/10.1096/fj.11-202077.
- Tatischeff I, Larquet E, Falcón-Pérez JM, Turpin PY, Kruglik SG. Fast characterisation of cell-derived extracellular vesicles by nanoparticles tracking analysis, cryo-electron microscopy, and Raman tweezers microspectroscopy. J Extracell Vesicles. 2012; 1: 19179, doi: http://dx.doi.org/10.3402/jev.v1i0.19179.
- Colhoun HM, Otvos JD, Rubens MB, Taskinen MR, Underwood SR, Fuller JH. Lipoprotein subclasses and particle sizes and their relationship with coronary artery calcification in men and women with and without type 1 diabetes. Diabetes. 2002; 51: 1949–56.
- Fernández-Llama P, Khositseth S, Gonzales PA, Star RA, Pisitkun T, Knepper MA. Tamm-Horsfall protein and urinary exosome isolation. Kidney Int. 2010; 77: 736–42. doi: http://dx.doi.org/10.1038/ki.2009.550.
- Gonzales PA, Pisitkun T, Hoffert JD, Tchapyjnikov D, Star RA, Kleta R, etal. Large-Scale proteomics and phosphoproteomics of urinary exosomes. J Am Soc Nephrol. 2009; 20: 363–79. doi: http://dx.doi.org/10.1681/asn.2008040406.
- Wang Z, Hill S, Luther JM, Hachey DL, Schey KL. Proteomic analysis of urine exosomes by multidimensional protein identification technology (MudPIT). Proteomics. 2012; 12: 329–38. doi: http://dx.doi.org/10.1002/pmic.201100477.
- Mitchell PJ, Welton J, Staffurth J, Court J, Mason MD, Tabi Z, etal. Can urinary exosomes act as treatment response markers in prostate cancer?. J Transl Med. 2009; 7: 4. doi: http://dx.doi.org/10.1186/1479-5876-7-4.
- Cantin R, Diou J, Bélanger D, Tremblay AM, Gilbert C. Discrimination between exosomes and HIV-1: purification of both vesicles from cell-free supernatants. J Immunol Methods. 2008; 338: 21–30. doi: http://dx.doi.org/10.1016/j.jim.2008.07.007.
- Lobb RJ, Becker M, Wen SW, Wong CS, Wiegmans AP, Leimgruber A, etal. Optimized exosome isolation protocol for cell culture supernatant and human plasma. J Extracell Vesicles. 2015; 4: 27031, doi: http://dx.doi.org/10.3402/jev.v4.27031.
- Baranyai T, Herczeg K, Onodi Z, Voszka I, Modos K, Marton N, etal. Isolation of exosomes from blood plasma: qualitative and quantitative comparison of ultracentrifugation and size exclusion chromatography methods. PLoS One. 2015; 10: e0145686, doi: http://dx.doi.org/10.1371/journal.pone.0145686.
- Lozano-Ramos I, Bancu I, Oliveira-Tercero A, Armengol MP, Menezes-Neto A, Del Portillo HA, etal. Size-exclusion chromatography-based enrichment of extracellular vesicles from urine samples. J Extracell Vesicles. 2015; 4: 27369, doi: http://dx.doi.org/10.3402/jev.v4.27369.
- Kosanović M, Janković M. Isolation of urinary extracellular vesicles from Tamm-Horsfall protein–depleted urine and their application in the development of a lectin-exosome-binding assay. BioTechniques. 2014; 57: 143–9.
- Lotvall J, Hill AF, Hochberg F, Buzas EI, Di Vizio D, Gardiner C, etal. Minimal experimental requirements for definition of extracellular vesicles and their functions: a position statement from the International Society for Extracellular Vesicles. J Extracell Vesicles. 2014; 3: 26913, doi: http://dx.doi.org/10.3402/jev.v3.26913.
- Saito S, Murayama Y, Pan Y, Taima T, Fujimura T, Murayama K, etal. Haptoglobin-beta chain defined by monoclonal antibody RM2 as a novel serum marker for prostate cancer. Int J Cancer. 2008; 123: 633–40. doi: http://dx.doi.org/10.1002/ijc.23490.
- Ikeda A, Nakagawa T, Kawai K, Onozawa M, Hayashi T, Matsushita Y, etal. Serum adiponectin concentration in 2,939 Japanese men undergoing screening for prostate cancer. Prostate Int. 2015; 3: 87–92. doi: http://dx.doi.org/10.1016/j.prnil.2015.07.001.
- Klee EW, Bondar OP, Goodmanson MK, Dyer RB, Erdogan S, Bergstralh EJ, etal. Candidate serum biomarkers for prostate adenocarcinoma identified by mRNA differences in prostate tissue and verified with protein measurements in tissue and blood. Clin Chem. 2012; 58: 599–609. doi: http://dx.doi.org/10.1373/clinchem.2011.171637.
- Fernandez PL, Farre X, Nadal A, Fernandez E, Peiro N, Sloane BF, etal. Expression of cathepsins B and S in the progression of prostate carcinoma. Int J Cancer. 2001; 95: 51–5. doi: http://dx.doi.org/10.1002/1097-0215(20010120)95:1<51::AID-IJC1009>3.0.CO;2-J.
- Lucarelli G, Rutigliano M, Bettocchi C, Palazzo S, Vavallo A, Galleggiante V, etal. Spondin-2, a secreted extracellular matrix protein, is a novel diagnostic biomarker for prostate cancer. J Urol. 2013; 190: 2271–7. doi: http://dx.doi.org/10.1016/j.juro.2013.05.004.
- Akudugu J, Serafin A, Bohm L. Further evaluation of uPA and PAI-1 as biomarkers for prostatic diseases. J Cancer Res Clin Oncol. 2015; 141: 627–31. doi: http://dx.doi.org/10.1007/s00432-014-1848-3.
- Liu Y, Pixley R, Fusaro M, Godoy G, Kim E, Bromberg ME, etal. Cleaved high-molecular-weight kininogen and its domain 5 inhibit migration and invasion of human prostate cancer cells through the epidermal growth factor receptor pathway. Oncogene. 2009; 28: 2756–65. doi: http://dx.doi.org/10.1038/onc.2009.132.
- Heidegger I, Massoner P, Sampson N, Klocker H. The insulin-like growth factor (IGF) axis as an anticancer target in prostate cancer. Cancer Lett. 2015; 367: 113–21. doi: http://dx.doi.org/10.1016/j.canlet.2015.07.026.