
Abstract
Background
Understanding the pathogenic role of extracellular vesicles (EVs) in disease and their potential diagnostic and therapeutic utility is extremely reliant on in-depth quantification, measurement and identification of EV sub-populations. Quantification of EVs has presented several challenges, predominantly due to the small size of vesicles such as exosomes and the availability of various technologies to measure nanosized particles, each technology having its own limitations.
Materials and Methods
A standardized methodology to measure the concentration of extracellular vesicles (EVs) has been developed and tested. The method is based on measuring the EV concentration as a function of a defined size range. Blood plasma EVs are isolated and purified using size exclusion columns (qEV) and consecutively measured with tunable resistive pulse sensing (TRPS). Six independent research groups measured liposome and EV samples with the aim to evaluate the developed methodology. Each group measured identical samples using up to 5 nanopores with 3 repeat measurements per pore. Descriptive statistics and unsupervised multivariate data analysis with principal component analysis (PCA) were used to evaluate reproducibility across the groups and to explore and visualise possible patterns and outliers in EV and liposome data sets.
Results
PCA revealed good reproducibility within and between laboratories, with few minor outlying samples. Measured mean liposome (not filtered with qEV) and EV (filtered with qEV) concentrations had coefficients of variance of 23.9% and 52.5%, respectively. The increased variance of the EV concentration measurements could be attributed to the use of qEVs and the polydisperse nature of EVs.
Conclusion
The results of this study demonstrate the feasibility of this standardized methodology to facilitate comparable and reproducible EV concentration measurements.
To access the supplementary material to this article, please see Supplementary files under ‘Article Tools’.
Extracellular vesicles (EVs) are vesicles, ranging in size from 50 nm to 1 µm, that are released by cells and microorganisms (such as bacteria and protozoans) into the extracellular space. Several classes of EVs have been identified including exosomes, microvesicles, oncosomes and other types of membrane vesicles (Citation1). Ascribed roles for EVs encompass a wide variety of cellular functions, including the removal of unwanted cellular material, cell signalling and the regulation of the immune system. Several disease states are also associated with the release of EVs with their involvement in many aspects of cancer, neurological diseases and infectious agents (Citation2). Substantial research is currently ongoing to understand the cellular role of EVs and their potential roles in disease, including their use as a source of potential biomarkers.
EVs can be isolated from many biological fluids including blood, urine, cerebrospinal fluid and saliva. When coupled with analysis of their protein and genetic content (predominantly small non-coding RNA such as microRNA), EVs have shown to have utility as biomarkers for cancer and neurodegenerative conditions (Citation3, Citation4). Additionally, researchers are investigating the potential of EVs as a drug delivery vehicle for therapeutic use such as small interfering RNA (siRNA) (Citation5). Understanding the pathogenic role of EVs in disease and their potential diagnostic and therapeutic utility is reliant on solid methodical analysis for the quantification and measurement of EV size distribution.
The isolation of EVs has traditionally relied on the use of differential centrifugation to pellet vesicles of different sizes. Although differential ultracentrifugation is still widely used, the technique is time- and labour-intensive; it pellets non-EV material (such as protein and lipid complexes) and requires specialized equipment. Several other methods including flow-field fractionation (Citation6, Citation7), density gradient separation (Citation8) (using sucrose or iodixanol (Citation9, Citation10) (OptiPrep)), immuno-purification (Citation11, Citation12) and size exclusion chromatography (SEC) (Citation13, Citation14) have been used to further separate vesicles based on their physico-chemical properties. Recently, SEC has been optimized through the use of calibrated columns to provide a rapid means of isolating EVs from biofluids (Citation13, Citation15), which is particularly useful for the removal of most lipid material, proteins and other macromolecules present in plasma (Citation13, Citation14). SEC provides a rapid and cost-effective methodology that can be applied without the use of ultracentrifugation in a diagnostic setting.
Quantification of EVs has presented several challenges to the scientific community, predominantly due to the small size of vesicles such as exosomes (50–100 nm) and the available technology to image and quantify nanosized particles (Citation16). Several biophysical techniques such as dynamic light scattering (DLS), nanoparticle tracking analysis (NTA; Malvern Instruments, Malvern, UK), flow cytometry and tunable resistive pulse sensing (TRPS; Izon Science, Christchurch, New Zealand) have been utilized to quantify and measure EVs in solution. In TRPS, a tunable submicron-sized pore separates 2 fluid chambers, one containing the sample to be analysed, the other an electrolyte solution (Citation17). An electric current between the chambers is disrupted when a particle passes through the pore, causing a “blockade” event, the magnitude of which is proportional to the volume of the particle traversing the pore (Citation17, Citation18), and the blockade rate directly related to the particle concentration (Citation19). Calibration of the system using carboxylated polystyrene standard particles enables accurate measurement of the concentration and size distribution of particles in solution (Citation19, Citation20). TRPS provides reliable and fast particle-by-particle measurement of EV size and concentration distribution (Citation16, Citation21). It offers tunability through adjustment of the detection size range by changing the pore size and requires only small sample volumes (~40 µl). The main advantages of TRPS over other technologies include its very limited dependence on instrument settings and its versatility in available measurement tools, such as the simultaneous determination of size, concentration and zeta potential (Citation22–Citation25) of a given sample. On the other hand, TRPS may not be able to discriminate between different types of particles, such as lipoproteins and EVs, which is a disadvantage.
To determine the feasibility and reproducibility of combining EV isolation using SEC and TRPS for measuring EV size and concentration, synthetic phospholipid vesicles and aliquots of the same EV sample were measured in 6 laboratories worldwide, using a standardized protocol. Concentration measured with TRPS is reported over a predefined size range to enable comparison of results.
Materials and methods
Polystyrene standards
Carboxylated polystyrene particle standards with a nominal mean diameter of 210 nm, denoted as CPC200, were purchased from Bangs Laboratories (Fishers, IN, USA). CPC200 were diluted in PBS (137 mM NaCl, 2.7 mM KCl, 10 mM Na2HPO4, 1.8 mM K2HPO4)+(0.03% w/v Tween 20) at a concentration of 6.7×10⁹/ml and shipped to the 6 trial participants. The CPC200 suspension was mixed with double-strength PBS in a 1:1 ratio (v/v) to make a single-strength solution just before evaluation with TRPS by qNano (Izon Science).
Liposome standards
XCX liposomes were purchased from Excytex (Utrecht, Netherlands). The liposomes consist of dipalmitoylphosphatidylglycerol, dipalmitoylphosphatidylcholine and cholesterol in a molar ratio of 1:5:4, dispersed in PBS and 0.05% sodium azide, with a nominal mode diameter of approximately 115 nm. The nominal total lipid concentration was 60 to 75 mM.
XCX liposomes were diluted 20× in PBS with 0.05% sodium azide and delivered to the 6 trial groups together with a diluent batch, consisting of PBS, 0.03% Tween 20, 0.05% sodium azide and 4% (v/v) Izon coating solution (ICS). The liposome solution was mixed with the diluent in a 1:1 ratio (v/v) just before evaluation with TRPS. The liposome concentration just before evaluation with TRPS was estimated to be 2×10¹⁰/ml.
Plasma extracellular vesicles
This study was conducted in accordance with the Declaration of Helsinki and approved by the local ethics committees. Informed consent was obtained from all volunteers. Blood samples were collected from healthy human volunteers. Blood was drawn from the antecubital vein by a qualified medical technologist using a butterfly catheter with a 21-gauge needle. After discarding the first 3 ml, blood was collected in trisodium citrate (3.2%) (Greiner Bio-One, Frickenhausen, Germany). Immediately after collection samples were centrifuged twice at 2,500×g for 15 min at 20°C, in order to prepare platelet depleted plasma. The supernatant (plasma) was collected, with approximately 10 mm and 4 mm distance to the pellet, following the first and second centrifugation steps, respectively. Samples were frozen and stored at −80°C.
Plasma aliquots (1.1 ml) were shipped as frozen vials to the 6 trial participants. Vials were stored at −80°C and measured within 24 h after thawing. Before TRPS measurement EV samples were centrifuged at 2,000×g for 10 min (4°C if possible) to remove any aggregates formed during the freeze–thaw process. After centrifugation, 500 µl of the resulting supernatant was loaded on a qEV column (see below) for further EV purification.
Sample buffer
PBS-containing surfactant (0.03% Tween 20) was used in this study, to prevent spontaneous EV aggregation in solution (Citation26). TRPS measurements are more stable and accurate when surfactant is present in the buffer (Citation27). The mode diameter of cell line derived exosomes measured in PBS with 0.05% Tween 20 was lower than that of exosomes measured in PBS alone (101 nm vs. 120 nm) (Citation26), which may be due to disruption of the exosome membrane or due to the prevention of aggregation in the sample. Because the total EV concentration (including exosomes, microvesicles and apoptotic bodies) is unaffected up to concentrations of 5% Tween 20 (Citation28), we believe a concentration of 0.03% Tween 20 sufficiently prevents aggregation of EVs in a sample but is insufficient to disrupt the EV structure.
qEV columns
qEV size exclusion columns were provided by Izon Science. The columns contain a resin with a pore size of approximately 75 nm, a bed volume of 10 ml, a bed height (height of the gel, excluding the frit) of 51 mm, an inner tube diameter of 15.6 mm, a void volume of 3.0±0.25 ml, a sample volume of ideally 500 µl and flow rates of typically 0.8–1.2 ml/min at room temperature. Columns are pre-filled with PBS, containing 0.05% sodium azide.
The qEV column isolates EVs in a process that typically takes less than 15 min, resulting in highly purified vesicles. Proteins and other contaminating molecules smaller than 75 nm enter the pores of the resin and are delayed in their passage through the column, eluting mainly in later fractions. However, EVs smaller than 75 nm in diameter also enter the resin and are delayed in their passage.
Fractions 7–9 (1.5 ml) contain the majority of EVs (Citation13, Citation15) and were collected by each research group with each fraction being 0.5 ml. Finally 50 µl of sample additive including coating solution (see below) was added to 450 µl of the qEV purified EV samples, prior to analysis with TRPS.
Transmission electron microscopy of EVs before and after qEV
The EV samples before and after qEV column purification (Fraction 9), both undiluted, were subjected to overnight fixation, in 0.1% final concentration (v/v) paraformaldehyde (Electron Microscopy Science, Hatfield, PA, USA). Then, a 200-mesh formvar- and carbon-coated copper grid (Electron Microscopy Science) was placed on a 10-µl droplet to allow adherence of particles to the grid (7 min, room temperature). Thereafter, the grid was transferred onto a 10 µl droplet of 1.75% uranyl acetate (w/v) for negative staining. Each grid was studied using a transmission electron microscope (Tecnai-2, FEI, Eindhoven, Netherlands).
Transmission electron microscopy of CD9+ immunogold-labelled EVs after qEV
Fractions 8 and 9 were pooled and up-concentrated using a 10 kD spin filter at 14,000×g at 4°C. Immunolabelling was performed by mounting concentrated samples on carbon-coated, glow discharged 400 mesh Ni grids for 30 s and washed 3 times with PBS. Grids were blocked with 0.5% ovalbumin in PBS and then incubated with primary anti-CD9+ antibody (BD Biosciences, Albertslund, Denmark, #555370) 1:50 in 0.5% ovalbumin in PBS for 30 min at 37°C. After incubation grids were washed 3 times with PBS and incubated with secondary antibody goat antimouse conjugated with 10 nm colloidal gold (British BioCell, Cardiff, UK) 1:20 in 1% cold fish gelatine. Samples and secondary antibody were incubated for 1 h at 37°C. The grids were then washed with 3 drops of PBS, before applying 2 drops of 1% cold fish gelatin for 10 min each. The grids were finally washed with 3 drops of PBS before staining with 2 drops of 1% (W/V) phosphotungstic acid at pH 7.0 and blotted dry. Images were obtained with a transmission electron microscope (JEM-1010, JEOL, Eching, Germany) operated at 60 keV coupled to an electron-sensitive CCD camera (KeenView, Olympus, Center Valley, PA, USA). For size determination of visible EVs a grid-size replica (2,160 lines/mm) was used.
Surface modification of membranes
ICS, which is a protein-free PBS-based formulation, was used to line the thermoplastic polyurethane nanopores (NP200, Izon, Christchurch, New Zealand) before measuring EVs. The purpose of the coating solution was to reduce non-specific binding (NSB) onto the nanopore surface and hence to increase the stability of TRPS measurements.
Prior to the trial the NSB properties of ICS were tested. Diluted bovine calf serum (see Supplementary File) was added to the upper and lower fluid cells of the qNano and subsequently flushed through the pore for 10 min at an applied pressure of 2 kPa. After exposure of the pore to serum, the upper cell was removed and washed. Then both sides of the pore were washed with electrolyte at least 6 times. The pore was then reanalysed for resolving CPC 200 calibration particles.
The actual pore size is indicated by the mid-range particle size, which is defined as the particle diameter that will give a blockade magnitude (dI) of 0.3 nA at a background current (I) of 100 nA and a membrane stretch of 45 mm.
Measurement assistant instructions
The qNano software (Izon Control Suite v.3.2) guided the 6 participants through the measurement protocols. These included preparation of the fluid cell, fitting, wetting and coating of nanopore, calibration and optimization of nanopore (see below), liposome and EV sample measurement, sample changeovers and finally assessment of measurement quality.
qNano and TRPS
PBS-containing surfactant (0.03% Tween 20) was placed in both fluid cells, which contained 1 electrode each, below and above the nanopore on the qNano, equipped with an air-based pressure module (Izon Science). Trial participants were guided through a nanopore optimization process. This included adjustment of nanopore stretch, voltage and applied pressure on the CPC200 calibration sample, so that the relative blockade magnitude (which equals the blockade magnitude (dI) divided by the background current (I)) was within 0.0025–0.005 and the inverse full-width half maximum duration (1/FWHM), which reflects particle speed, was within 10–15/ms. These intervals of dI/I and 1/FWHM are denoted as within the “green zone” (to ensure consistency in instrument settings amongst the participants). Exceeding these green zone limits was considered a violation of the protocol. By stretching the TRPS pore and fine-tuning the voltage, particles were measured in the detection range.
Izon Control Suite (v3.1, Izon Science) provided the interface to the qNano instrument and performed calibration to convert the number and magnitude of measured pore blockades to particle diameter and concentration (see details in Supplementary File). Calibration blockade frequencies were adjusted if necessary by removing blockades close to the noise level, in order to provide more robust concentration calibration. These blockades were remnants of previous plasma or liposome sample runs and not CPC200 beads. Blockade counts pertinent for these studies typically ranged between 500 and 2,000 events.
Sample measurement flow
Size and concentration calibrations were performed using a particle standard of known size and concentration as a reference (Citation19–Citation21). Liposome and EV concentration were determined using a 3-point pressure method (Citation19), with pressures typically between 0.1 and 1 kPa. The 3-point pressure method eliminates the impact of pore and particle zeta potentials (electrokinetic effects) on the detected concentration. In cases where blockages occurred at 1 given pressure, the 3-pressure point calibration process was reduced to a 2-pressure point calibration. The concentration of particles in a sample was reported in a predefined size range of 80–180 nm and 80–250 nm for liposomes and EVs, respectively. The EV size range of 80–250 nm is suitable to cover almost all EVs of larger diameter, whilst also including results from larger membranes with a lower detection limit of as large as 80 nm. Liposomes are more monodisperse than EVs and the size range of 80–180 nm is sufficient to cover basically all liposomes.
A triplicate measurement of XCX liposomes at 3 pressures was preceded and followed by a calibration measurement at the same 3 pressures. The last calibration was used to calibrate the XCX liposome measurements. Because the risk of a change in the pore geometry was higher for plasma samples, calibration and plasma samples were measured in alternation (4× calibrations and 3× samples). Each sample measurement was calibrated with the consecutive calibration measurement. This alternating calibration process virtually eliminates the impact of any change in the pore geometry during measurement on EV size and concentration results.
Each trial participant was requested to perform triplicate XCX liposome measurements on 4 pores (4×3) and 1 triplicate on a qEV purified XCX liposome sample on another pore. Triplicate qEV purified plasma sample measurements were performed on 5 different pores (5×3). See the Supplementary File for a detailed measurement scheme (Supplementary Fig. 1).
Statistical analysis
Statistical analyses were performed in SPSS (v22.0, IBM, New York, NY) and MATLAB (R2011b; MathWorks, Natick, MA, USA).
Descriptive statistics were computed for each group. The differences between the 6 groups were assessed by a one-way analysis of variance (ANOVA) with Tukey's honestly significant difference (HSD) multiple comparison post hoc tests. Significance was set at p<0.05. For visualizing the measured concentration across the groups, box and whisker plot representation was applied. Here, the bottom and top of the box represent the first and third quartiles, respectively; the band inside the box is the median; the end of the whiskers represents the 5th and 95th percentile; and the squares in the box indicate the mean of the data.
Association between the concentration and each of the measured parameters was assessed by Pearson's correlation test. Correlation bar plots are shown in the Supplementary File (Supplementary Fig. 4).
For multivariate data analysis unsupervised principal components analysis (PCA) was performed in order to detect outlying samples and to identify potential patterns within the EV data. PCA was used to convert the multidimensional data obtained from EV and liposome analysis into a simpler 2-dimensional plane. When compressing the data, the model was assumed not to lose much information, as only noise and uncorrelated data were removed (Citation29).
Score plots were used to visualize the similar performances between the laboratories and to identify the difference between sample and calibration data. Loadings plots were utilized to show which parameters were significantly different between and within samples and calibration data. Because of the large differences between the magnitudes of several parameters, data were auto-scaled prior to PCA (Citation30). The sign and magnitude of the variables in the loadings plot were used to assess which parameters were important in sample grouping.
Results and discussion
Measuring the concentration and size distribution of EVs can be challenging, because of their polydisperse nature. Filtration with 0.1-µm or 0.22-µm filters was previously used to remove larger particles, with the negative side effect of high sample loss and size distribution distortions (Citation27). There is a clear need for a standardized methodology for EV concentration measurements (Citation31, Citation32) that can cope with their polydisperse nature and make results comparable between different laboratories.
In this study, we present a standardized TRPS analysis of EVs from clinical samples that include (a) sample purification with qEV columns; (b) calibrated concentration measurements over a defined size range; (c) nanopore coating; and (d) consistent measurement settings.
Standardization: use of qEV columns for EV isolation
The qEV SEC approach to isolating particles in plasma samples minimizes the high density lipoprotein (HDL) and protein content, while recovering the majority of EVs (CD63+ EV and CD9+ EV (Citation13, Citation15)). Previously, the recovery of platelet-derived vesicles in pooled Fractions 7–9 was shown to be 43%, with an 8-fold and 70-fold enrichment compared with HDL and protein (Citation13). Large lipoproteins were still present in the EV fractions (Citation14).
SEC will cause sample dilution, which depends on the input volume relative to the fraction size, and the number of collected fractions. Typical dilution factors are 2–5-fold. Optimal qEV loading volumes lie between 500 and 1,000 µl of sample, with higher loading volumes causing a widening of the distribution profile (see a; 2,000 µl loading).
Fig. 1. Typical size exclusion column (qEV) elution profiles of serum extracellular vesicles (EVs) depending on loading.
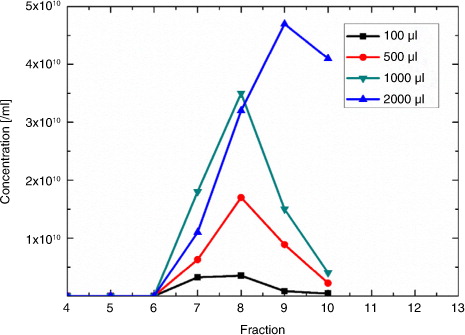
shows typical qEV elution profiles for a range of loading volumes of serum. The total combined particle concentration that eluted in Fractions 7–9 was 7.5×10⁹/ml and 3.2×10¹⁰/ml for qEV column loadings of 100 and 500 µl of serum, respectively. Considering that in both cases the particle concentration before the qEV column was 3.8×10¹⁰/ml, the recovery of the 500-µl sample collected in Fractions 7–9 was approximately 85%. The factor 5 difference between the 100- and 500-µl samples is due to the 5-fold higher dilution of the 100-µl sample. Higher loss occurs with increased loading volumes (at 2,000 µl), as the distribution profile is widened. Some particles elute in Fraction 11 with lower EV purity, as these later fractions will contain more protein.
In comparison, recovery rates of approximately 98% (89%) and 88% (77%) were measured in Fractions 6–11 (Citation7–Citation9) for monodisperse carboxylated polystyrene particles with a nominal diameter of 400 nm and XCX liposomes, respectively (see Supplementary Fig. 3).
To confirm that the vesicles isolated by the qEV column retained their integrity and morphology within the reported EV size range, transmission electron microscopy was used. a shows the sample before qEV. The EVs are obscured by a high protein background. b shows a typical image of Fraction 9 of the sample post qEV. Fraction 9 is nearly devoid of this protein background. Three cup-shaped structures in the centre of the image indicate the presence of EVs. Nine additional images (not shown) taken from the post-qEV sample showed at least 20 EVs (cup-shaped structures) ranging between 90 and 280 nm. Many of the smaller (as small as 30 nm) spherical structures in the transmission electron microscopy image of the qEV enriched sample (b) might also be EVs, amidst lipoproteins and chylomicrons.
Fig. 2. Transmission electron microscopy (TEM) images of plasma EVs (a) before and (b) after qEV purification and (c) CD9+ immunogold-labelled EVs after qEV purification.
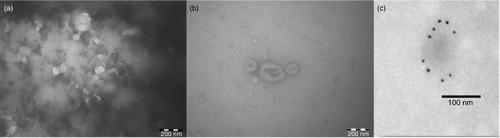
EVs smaller than 70 nm are expected to elute in the protein fractions (>11). For qNano measurements, Fractions 7–9 were pooled, with Fractions 7 and 8 containing less protein than Fraction 9 (Citation13).
To unequivocally demonstrate the presence of EVs CD9+ immunogold labelling of EVs was performed on post qEV separated plasma samples (Fractions 8+9). The roundish particles are indeed CD9+EVs and an example of a labelled vesicle smaller than 100 nm is shown in c. In summary the transmission electron microscopy (TEM) results shows that qEV column separation is a suitable purification method for EVs in plasma samples.
Samples prior to and post-qEV were also measured at the time of the trial with NTA (Supplementary Fig. 6). In both cases there was a significant amount of particulates present with diameters below 100 nm, supporting the TEM and TRPS results.
Standardization: pore lining for stable, reproducible measurements
Most routine laboratory analytical procedures implicitly assume that all used measurement tools and methodologies do not adversely affect the sample. In practice this is not true. In particular NSB can be detrimental, and all methodologies, including TRPS, must deal with it adequately (Citation33). NSB can interfere in TRPS in 2 ways. First, the EVs themselves can bind to the pore, causing it to block and prevent further measurement (Citation27). Second, if the pore properties are changed during a measurement due to molecules such as proteins binding to the pore, the calibration can be rendered meaningless. Accumulation of proteins on the pore is expected to result in a reduced pore size, therewith reducing the sample flow rate and increasing the blockade magnitude per particle. The former affects the concentration calibration, while the latter affects the size calibration.
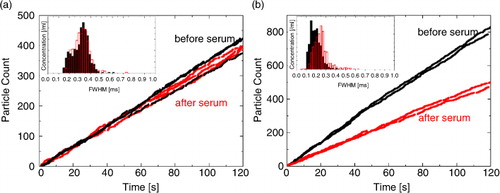
Therefore, ICS was applied to the pore, minimizing NSB and thereby improving the stability of measurements. Without coating, the current was unstable from frequent current drops due to blockages. To evaluate the efficacy of the pore coating in reducing NSB, we measured CPC200 calibration particles before and after a 15-min measurement of serum. Particle counts for CPC200 ranged between 400 and 1,000 and for serum approximately 10,000.
With coating (a), blockade frequencies and FWHM durations (insets) remained constant before (in black) and after (in red) serum runs. Without coating, a decrease in blockade frequency and increase in FWHM (inset b) suggests pore modification through macromolecules such as proteins from serum. For the purpose of clarity only 2 FWHM histograms are displayed in a and b.
Fig. 3. Blockade rates and mean full width half maximum durations (insets) of CPC200 calibration particles (a) with and (b) without coating of the pore. Calibration particles were recorded before the serum (in black) and after the serum (in red), in order to assess pore modification processes.
Standardization: determination of particle concentration over a size range
TRPS measurements of EVs from different users, instruments, pores and days are made comparable through calibration to a standard (CPC200) (Citation19, Citation20) and adherence to a measurement protocol, which guarantees consistent settings.
Often concentration measurement techniques only evaluate the “total” particle concentration, which will crucially depend on the smallest detected size of the technique used (Citation16). TRPS reports concentration over a defined size range, further improving comparability across laboratories. The size ranges for liposome and plasma EV concentrations within this study were 80–180 nm and 80–250 nm, respectively.
Concentration measurements of liposomes
Liposomes are commonly used when analysing methods for vesicle isolation, characterization or quantification. The advantage of liposomes as a standard over beads is that their physical properties, including size, density and composition, can be adjusted to mimic EVs (Citation33, Citation34).
All 6 research groups measured identical XCX liposome samples with a nominal mode diameter of 115 nm. Each group was requested to measure the liposomes, using 4 different pores (with 3 repeats each). Liposome measurements on a fifth pore (3 repeats) after qEV filtration were performed in order to evaluate the effect of qEV on liposome concentration. Of the planned measurements, 68 out of 72 (non-qEV) and 10 out of 18 (with qEV) were fully completed. In 11 out of 68 non-qEV measurements trial participants did not adhere to the measurement protocols and green zone limit requirements. None of these measurements were omitted even though this increased the coefficient of variance (CV) of the results.
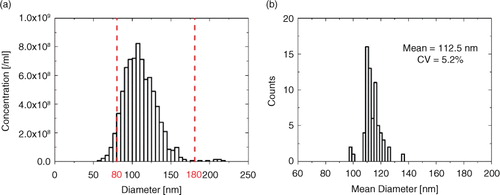
Because measured particle concentration by TRPS is dependent on a varying lower detection limit due to the nanopore size and the instrument settings (Citation14, Citation32), a particle concentration over a suitable size range is applied. This enables comparable quantification of particles. The chosen size range of 80–180 nm covers approximately 95% of the liposome population (a). b shows the histogram of the mean diameters, evaluated over 80–180 nm with a total of 68 measurements. The distribution of the mean diameters is very narrow with a CV of 5.2%, around a mean diameter of 112.5 nm.
Fig. 4. (a) Typical size distribution of liposomes and (b) histogram of mean diameters of the complete liposome data set, including a total of 68 measurements.
Liposome concentration measurements are displayed in . Box plots next to the scatter plots (a) reveal that the mean concentrations between groups are in good agreement, although the spread of concentration results differs considerably between groups, with Group 3 showing the largest variation in the data.
Fig. 5. (a) Concentration scatter and box plots and (b) concentration distribution for the complete liposome data set of 68 measurements. Protocol and “green zone” violations are marked with white circles within the scatter plot in (a).
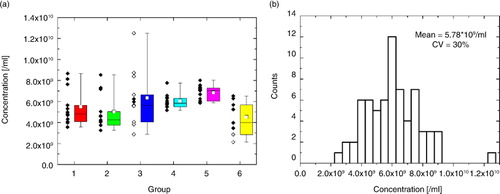
One-factor ANOVA returned a p-value of approximately 0.02 with 5 and 62 degrees of freedom between and within groups, respectively. Statistical difference between groups was assessed with a Tukey HSD test, with significant differences found between Groups 5 and 6.
The resulting distribution in measured concentrations C80–180 (b) of the complete data set had a CV of 30%, around a mean of 5.78×10⁹/ml±0.42×109/ml (95% confidence interval (CI)), with a ratio of the largest to the lowest measured concentration of approximately 6 (4, if the largest concentration was omitted). The weighted CV within groups was approximately 27%, and hence the main contributor to the variability in the results was the method, rather than the site, technician or instrument.
As described above, in 11 of 68 measurements either the participants did not adhere to the protocols and green zone limits (0.0025<dI/I<0.005, 10/ms<1/FWHM<15/ms) or blockages occurred. When these measurements were excluded from the analysis, the concentration CV was reduced to 23.9%, whilst keeping the mean constant at 5.78×10⁹ /ml±0.37×109 /ml (95% CI). The excluded measurements within the scatter plot in a are marked with white circles. Almost all green zone violations stemmed from Group 3, which showed the largest spread in concentration results. By omitting these data sets where green zone violations ocurred, the concentration variablitliy of Group 3 was reduced significantly.
The average time for a complete measurement (including 1 calibration and 3 liposome repeat measurements at 3 pressures each) was 28.5 min, making TRPS a relatively fast concentration evaluation method.
To measure the impact of qEV on recovery and size distribution, we also measured XCX liposome samples that were processed with a qEV column. The mean concentration of qEV processed samples in Fractions 7–9 was approximately 6.18×10⁹/ml compared with 5.78×10⁹/ml before qEV, resulting in a particle recovery of basically 100%. The CV on the concentration was 20% higher due to qEV. The size histograms with and without qEV were in good agreement, with mean diameter and CV increasing by only 4.4 nm and 1%, respectively, due to qEV. Only 10 out of the planned 18 measurements (3 repeats for each group) from 4 groups were completed for liposomes processed with qEV. This limited statistics may lead to considerable uncertainties on the estimated recovery and CV of measured concentrations (see further discussion in Supplementary File).
To further investigate the effect of qEV full recovery studies, evaluating Fractions 6–11 was undertaken with 5 different qEVs but the same pore, liposome sample and instrument user. The measured recovery rates were 86, 95, 79, 97 and 85%, averaging 88%. The average recovery rate in Fractions 7–9 was 77% and hence the 100% recovery as measured in the trial was clearly an overestimate of the real recovery.
Concentration measurements of EVs
Accurate measurement of the polydispersity is essential, because this can be indicative of the origin of the vesicles; for example, tumour-derived EVs have been observed to have greater polydispersity than those from healthy cell lines (Citation35–Citation37). Hence the accurate measurement of concentration and the identification of various size distributions within a polydisperse sample (Citation33, Citation38) are of utmost importance for advanced EV analysis. TRPS size measurements of polydisperse EV samples were in good agreement with results from other nanoparticle sizing techniques (Citation32, Citation33), such as NTA, DLS, small-angle X-ray scattering and TEM (Citation33).
For this trial, all EV measurements were conducted after plasma samples had been purified with qEV. Without qEV filtration the EV measurements would have led to frequent pore-blocking events and hence rendered a comparative study impossible. Of the 90 planned EV concentration measurements, 74 were fully completed. No measurements were omitted, although in 14 cases trial participants did not adhere to the measurement protocols and green zone limits, which led to an increase in CV of the results.
PCA was carried out for an initial assessment of similarity between different data sets and identification of outliers (a), and pertinent variables are displayed in the loading plot (b).
Fig. 6. Performance similarity across the 6 groups was qualitatively visualized in the principal component analysis (PCA) score plot (a). Samples cluster into 2 groups on principal component 1 (PC1), corresponding to data from the EV (+PC1) and calibration (−PC1) data. Data were colour coded according to the 6 groups. (b) PCA loadings plot was used to identify which parameters separated the sample and calibration data. FWHM=full width half maximum duration (as opposed to “duration,” which is the total blockade duration), RMS=root mean square, MRP=mid-range particle size, dI/I=relative blockade magnitude.
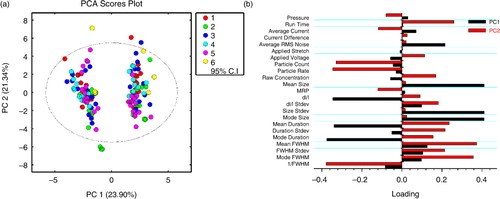
Overall, the data sets are very similar with no extreme outliers. No specific trend is observed between the groups, demonstrating that measurements are reproducible across the different laboratories. The 2 branches in the PCA plot display calibration (left branch) and EV (right branch) data with PC1 covering 23.90% and PC2 21.34% of the total variation of the data. Few data sets (Citation6) were identified as minor outliers due to their placement outside the 95% CI. In 4 out of these 6 cases, instrument users (1 and 2) exceeded the green zone limits.
The PCA loadings plot (b) was used to identify which parameters separated the sample and calibration data. The sign and magnitude of PC1 of each parameter determined its importance in sample separation between the EV and calibration data. As such, positive loadings indicate increased values of these parameters in the EV data and decreased values of the same parameters in the calibration data, respectively. Negative loadings indicate decreased values of these parameters in the EV data and increased values in the calibration data, respectively. Parameters with the largest absolute PC1 loadings are mean and mode size, size standard deviation, relative blockade magnitude dI/I, mean and mode duration. Hence, blockade magnitude and size are the most determining parameters for the separation between EV and calibration data. This indicates a clear dependence of measured EV size distributions and concentrations on calibration blockade magnitude, pore size and lower detection limit (see Supplementary Fig. 4).
The sign and the magnitude of PC2 of each parameter determine its importance in sample separation within EV and calibration data. Parameters with the largest absolute PC2 loadings are mean and mode FWHM, 1/FWHM, particle rate, count and run time. Hence flow rate–related parameters are the most determining parameters for the variance within sample and calibration data.
Collated EV concentration measurements C80–250 are shown in . Box plots next to the scatter plots (a) reveal that concentration means and CVs differed significantly between groups.
Fig. 7. (a) Concentration scatter and box plots and (b) concentration distribution for the complete EV data set of 74 measurements. Protocol and green zone violations are marked with white circles within the scatter plot in (a).
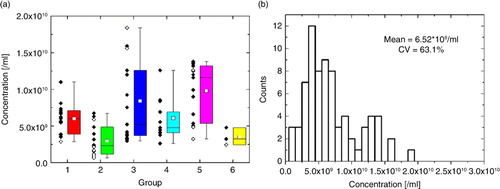
One-factor ANOVA returned a p-value of 1.44×10⁻⁵ with 5 and 68 degrees of freedom between and within groups, respectively. Hence concentration results between groups can be considered as significantly different at a significance level of 0.05. Statistical difference between groups was assessed with a Tukey HSD test, with significant differences between Groups 1 and 5, 2 and 3, and 2 and 5.
The mean concentration C80–250 (b) of the complete data set was 6.52×10⁹/ml±0.95×109/ml (95% CI), with a CV of 63.1%. When only measurements within green zone limits and without blockages were included (60 out of 74), the CV was reduced to 52.5% (see Table , C80–250_no outliers), with a mean concentration of 6.82×10⁹/ml±0.93×109/ml (95% CI). The excluded measurements are marked with white circles within the scatter plot in a. Almost all measurements that needed to be excluded lie either at the bottom or top end of the measurement range and hence are identical to measurement outliers.
Table I. Mean concentrations (with 95% CI) and CVs for various analyses
The average time for a complete measurement (including 3 calibration and 3 EV repeat measurements at 3 pressures each) was 31 min, comparable to 28.5 min for liposomes, detailed above.
a demonstrates how measured particle concentration by TRPS is dependent on a varying lower detection limit. Two examples of size distributions obtained with different sized pores are displayed. The size distribution in green was recorded with a smaller pore, that is, its detection limit was lower, at ~50 nm, compared with ~80 nm for the larger pore (red). TRPS has an inherent levelling off of measured concentration close to the detection limit (Citation27), due to fluctuating noise levels and increased uncertainty in measured particle diameter close to the noise level. In other words, what is perceived as a maximum in concentration versus size distribution of a polydisperse EV sample is not necessarily a real maximum. As clearly indicated by a, the maximum of the distribution shifts to smaller diameters when using a smaller pore, which consecutively results in a larger measured concentration C80–250. The size distributions are only comparable for EV diameters larger than the mode diameter detected by the pore with the largest minimum detectable size. For this reason the particle size distribution is considered reliable from 70 nm for the green (small pore) and from 100 nm for the red (large pore) curves in a. Both are in very good agreement above 100 nm, and the particle size distribution cannot be inferred from either curve below these limits.
Fig. 8. (a) Typical EV size distributions with different lower detection limits. (b) Positive correlation between measured concentration and relative blockade magnitude of calibration is displayed; the circled measurements in red and green represent the size distributions.
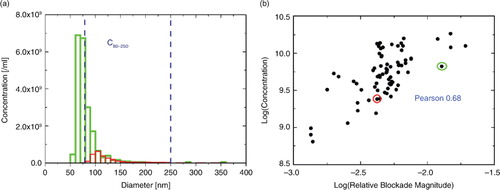
The effective pore size is reflected by the relative blockade magnitude of the measured calibration standard, with a higher relative blockade magnitude indicating a smaller pore. b shows the correlation between measured concentration C80–250 and the relative blockade magnitude of the calibration standard, with a Pearson coefficient of 0.68, demonstrating a strong correlation. The circled data points in red and green are associated with the size distributions in a. The mode of the size distribution is shifted towards smaller sizes with increasing relative blockade magnitude of the calibration standard. The 3 points with the lowest relative blockade magnitude have mode sizes of approximately 130 nm and the points with the largest relative magnitude have mode sizes as small as 70 nm.
To address this impact of detection limit on concentration there are several options, including (a) changing the lower limit of the reported concentration range; (b) limiting the pore sizes used; (c) improvements in data processing and electronics; and (d) fitting the data to a predefined distribution.
Firstly, the lower limit of the analysed size range can be shifted to larger diameters (from 80 nm up to 150 nm) as shown in Table . A shift of the lower limit from 80 to 150 nm, and leaving the upper limit constant at 250 nm, leads to a gradual decrease in CV of measured concentrations from 63% to approximately 54%. However, the smaller the analysed size range, the more limited the resulting information will be. Secondly, reducing the variability in pore size, either through premeasurement selection or through tighter manufacturing tolerances, would reduce concentration variability. Thirdly, an increase of the dynamic range due to improved electronics and signal post processing (such as interpolation and filtering) will shift the lower detection size limit significantly at unchanged pore size. Hence the measured concentrations over a given size range will not be truncated that much at the lower end. This approach reduces the need for decreasing the pore size while not further increasing the probability of pore blockages, which is a major issue for resistive pulse sensing. This makes it the preferred option in reducing concentration measurement uncertainty. Finally, the size distributions can be fitted with statistical functions, best mimicking polydisperse samples. Lognormal, power law and gamma functions are commonly used, to predict the concentration versus size distribution of polydisperse samples (Citation16),Citation39–(Citation42). In the case of EVs, a family of lognormal and normal distributions might best mimic the real particle size distribution.
As discussed above, and supported by further analysis in the Supplementary File, the correlation between measured EV concentration and pore size is a significant contributor to the variability in results. This correlation is significantly diminished for liposomes, which is thought to result from its more monodisperse nature compared with EVs. A more detailed discussion of the comparison between liposome and EV results including ANOVA is given in the Supplementary File (Supplementary Fig. 5, Supplementary Table III).
Sources of errors
The %CV on liposome concentrations (30%) is superior compared to the %CV on EV concentrations (63%). There may be several additional sources of errors to explain this difference, and the higher-than-expected CV on liposome concentrations.
On the sample side, EV samples may be more sensitive to handling, EV concentration may be affected by the freeze–thaw process, performing additional centrifugation prior to isolation may have been neglected, the qEV processing may result in variable dilution of the sample, and EVs are more likely to adhere to instrument or consumables compared to liposomes. These hypotheses must be addressed in further research studies to come.
On the instrument and methodology side, the liposomes are less polydisperse than EVs, and a larger part of their distribution is included in the reported concentration size range. In particular, the effect of the lower detection limit of the pore at hand is magnified by the EV size distribution. Several strategies to remedy this issue may be pursued, including (a) increased lower limit of the reported concentration range; (b) enhanced control over the range of pore sizes used; (c) improvements in data processing; and (d) fitting the data to a predefined distribution. Pertinent to TRPS, standardized reagents to prevent NSB and matching of electrolytes at various measurement steps is also essential.
The user variation could be due to a number of issues, such as incorrect operation of equipment, adherence to protocols, set-up of operating conditions and data quality assessment and adherence to standard lab practices with respect to reagent use, pipetting, use of consumables, and so on.
Nevertheless, the %CV of 63% reported on the EV of plasma samples is comparable to the %CV reported in a standardization study of platelet microparticle detection with flow cytometry (Citation43).
Conclusion
TRPS, in combination with the use of qEV columns, has been shown to offer an accurate methodology for the measurement of EV concentrations in a standardized way. Essential protocol steps are (a) the use of qEV columns for removal of sample proteins; (b) reporting the concentration in a size range of 80–250 nm for all EV measurements; (c) coating the TRPS pore with ICS to prevent adhesion of proteins to the pore; and (d) configuration of the instrument such that it performs within the green zone limits. With these steps, and excluding measurements that did not adhere to the green zone requirement, we found a %CV of 23.9% on the concentration of XCX liposomes (n=57) and a %CV of 52.5% on the concentration of plasma derived EVs (n=60, %CV of 63% including all 74 measurements).
We demonstrated that the major contributor to the %CV with TRPS was variability in the lower detection limit. Methods to address this include (a) an increased lower limit of the reported concentration range; (b) tighter control over the range of pore sizes used; (c) improvements in data processing and electronics; and (d) fitting the data to a predefined distribution. Of these methods, improvements in data processing are preferable.
Conflict of interest and funding
RV and MFB are contractors at Izon Science and their contributions to this paper were made as part of their contracts. AFH is funded by grants from the Australian National Health and Medical Research Council (grants 628946 and 400202; www.nhmrc.gov.au) and an Australian Research Council (www.arc.gov.au) Future Fellowship (grant FT100100560).
Supplementary Material
Download PDF (761.4 KB)Acknowledgements
We wish to acknowledge the support of STW VENI project 13,681 (FAWC), the support of National Institutes of Health (NIH) grant R01GM099471 (to MJK) and the help of Barbara W. Sódar (Semmelweis University, Budapest).
Notes
To access the supplementary material to this article, please see Supplementary files under ‘Article Tools’.
Related Research Data
References
- Yanez-Mo M, Siljander PRM, Andreu Z, Zavec AB, Borras FE, Buzas EI, etal. Biological properties of extracellular vesicles and their physiological functions. J Extracell Vesicles. 2015; 4: 27066. doi: http://dx.doi.org/10.3402/jev.v4.27066 [PubMed Abstract].
- van der Pol E, Böing AN, Harrison P, Sturk A, Nieuwland R. Classification, functions, and clinical relevance of extracellular vesicles. Pharmacol Rev. 2012; 64: 676–705.
- De Toro J, Herschlik L, Waldner C, Mongini C. Emerging roles of exosomes in normal and pathological conditions: new insights for diagnosis and therapeutic applications. Front Immunol. 2015; 6: 203.
- Cheng L, Sharples RA, Scicluna BJ, Hill AF. Exosomes provide a protective and enriched source of miRNA for biomarker profiling compared to intracellular and cell-free blood. J Extracell Vesicles. 2014; 3: 23743. doi: http://dx.doi.org/10.3402/jev.v3.23743.
- Alvarez-Erviti L, Seow Y, Yin H, Betts C, Lakhal S, Wood MJ. Delivery of siRNA to the mouse brain by systemic injection of targeted exosomes. Nat Biotechnol. 2011; 29: 341–5.
- Korgel BA, van Zanten JH, Monbouquette HG. Vesicle size distributions measured by flow field-flow fractionation coupled with multiangle light scattering. Biophys J. 1998; 74: 3264–72.
- Sitar S, Kejzar A, Pahovnik D, Kogej K, Tusek-Znidaric M, Lenassi M, etal. Size characterization and quantification of exosomes by asymmetrical-flow field-flow fractionation. Anal Chem. 2015; 87: 9225–33.
- Théry C, Amigorena S, Raposo G, Clayton A. Isolation and characterization of exosomes from cell culture supernatants and biological fluids. Current Protocols in Cell Biology. 2006; Wiley Chapter 3: Unit 3.22. doi: http://dx.doi.org/10.1002/0471143030.cb0322s30.
- Li X, Donowitz M. Ivanov A. Fractionation of subcellular membrane vesicles of epithelial and nonepithelial cells by OptiPrep™ density gradient ultracentrifugation. Exocytosis and endocytosis: methods in molecular biology, Vol. 440. 2008; Totowa, NJ: Humana Press. 97–110.
- Coleman BM, Hanssen E, Lawson VA, Hill AF. Prion-infected cells regulate the release of exosomes with distinct ultrastructural features. FASEB J. 2012; 26: 4160–73.
- Wittrup A, Zhang S-H, Svensson KJ, Kucharzewska P, Johansson MC, Mörgelin M, etal. Magnetic nanoparticle-based isolation of endocytic vesicles reveals a role of the heat shock protein GRP75 in macromolecular delivery. Proc Natl Acad Sci USA. 2010; 107: 13342–7.
- Greening DW, Xu R, Ji H, Tauro BJ, Simpson RJ. A protocol for exosome isolation and characterization: evaluation of ultracentrifugation, density-gradient separation, and immunoaffinity capture methods. Methods Mol Biol. 2015; 1295: 179–209. [PubMed Abstract].
- Böing AN, van der Pol E, Grootemaat AE, Coumans FA, Sturk A, Nieuwland R. Single-step isolation of extracellular vesicles from plasma by size-exclusion chromatography. 2014; Rotterdam: International Society of Extracellular Vesicles ISEV. 118 p.
- Welton JL, Webber JP, Botos L-A, Jones M, Clayton A. Ready-made chromatography columns for extracellular vesicle isolation from plasma. J Extracell Vesicles. 2015; 4: 27269. doi: http://dx.doi.org/10.3402/jev.v4.27269 [PubMed Abstract].
- Böing AN, van der Pol E, Grootemaat AE, Coumans FAW, Sturk A, Nieuwland R. Single step isolation of extracellular vesicles by size-exclusion chromatography. J Extracell Vesicles. 2014; 3: 23430. doi: http://dx.doi.org/10.3402/jev.v3.23430.
- van der Pol E, Coumans FAW, Grootemaat AE, Gardiner C, Sargent IL, Harrison P, etal. Particle size distribution of exosomes and microvesicles determined by transmission electron microscopy, flow cytometry, nanoparticle tracking analysis, and resistive pulse sensing. J Thromb Haemost. 2014; 12: 1182–92.
- Sowerby SJ, Broom MF, Petersen GB. Dynamically resizable nanometre-scale apertures for molecular sensing. Sens Actuators B Chem. 2007; 123: 325–30.
- Roberts GS, Kozak D, Anderson W, Broom MF, Vogel R, Trau M. Tunable nano/micropores for particle detection and discrimination: scanning ion occlusion spectroscopy. Small. 2010; 6: 2653–8.
- Roberts GS, Yu S, Zeng QL, Chan LCL, Anderson W, Colby AH, etal. Tunable pores for measuring concentrations of synthetic and biological nanoparticle dispersions. Biosens Bioelectron. 2012; 31: 17–25.
- Vogel R, Willmott G, Kozak D, Roberts GS, Anderson W, Groenewegen L, etal. Quantitative sizing of nano/microparticles with a tunable elastomeric pore sensor. Anal Chem. 2011; 83: 3499–506.
- de Vrij J, Maas SLN, van Nispen M, Sena-Esteves M, Limpens RWA, Koster AJ, etal. Quantification of nanosized extracellular membrane vesicles with scanning ion occlusion sensing. Nanomedicine. 2013; 8: 1443–58.
- Vogel R, Anderson W, Eldridge J, Glossop B, Willmott G. A variable pressure method for characterizing nanoparticle surface charge using pore sensors. Anal Chem. 2012; 84: 3125–31.
- Kozak D, Anderson W, Vogel R, Chen S, Antaw F, Trau M. Simultaneous size and zeta-potential measurements of individual nanoparticles in dispersion using size-tunable pore sensors. ACS Nano. 2012; 6: 6990–7.
- Eldridge JA, Willmott GR, Anderson W, Vogel R. Nanoparticle zeta-potential measurements using tunable resistive pulse sensing with variable pressure. J Colloid Interface Sci. 2014; 429: 45–52.
- Kozak D, Anderson W, Vogel R, Trau M. Advances in resistive pulse sensors: devices bridging the void between molecular and microscopic detection. Nano Today. 2011; 6: 531–45.
- Lane RE, Korbie D, Anderson W, Vaidyanathan R, Trau M. Analysis of exosome purification methods using a model liposome system and tunable-resistive pulse sensing. Sci Rep. 2015; 5: 7639.
- Anderson W, Lane R, Korbie D, Trau M. Observations of tunable resistive pulse sensing for exosome analysis: improving system sensitivity and stability. Langmuir. 2015; 31: 6577–87.
- Osteikoetxea X, Sodar B, Nemeth A, Szabo-Taylor K, Paloczi K, Vukman KV, etal. Differential detergent sensitivity of extracellular vesicle subpopulations. Org Biomol Chem. 2015; 13: 9775–82.
- Axelson DE. Data preprocessing for chemometric and metabonomic analysis. 2012; 2nd ed, MRi_Consulting. p. 330–337. Available from: http://www.amazon.de/Data-Preprocessing-Chemometric-Metabonomic-Analysis/dp/1470042827#reader_1470042827.
- van den Berg RA, Hoefsloot HCJ, Westerhuis JA, Smilde AK, van der Werf MJ. Centering, scaling, and transformations: improving the biological information content of metabolomics data. BMC Genomics. 2006; 7: 142.
- Witwer KW, Buzás EI, Bemis LT, Bora A, Lässer C, Lötvall J, etal. Standardization of sample collection, isolation and analysis methods in extracellular vesicle research. J Extracell Vesicles. 2013; 2: 20360. doi: http://dx.doi.org/10.3402/jev.v2i0.20360.
- Maas SLN, de Vrij J, van der Vlist EJ, Geragousian B, van Bloois L, Mastrobattista E, etal. Possibilities and limitations of current technologies for quantification of biological extracellular vesicles and synthetic mimics. J Control Release. 2015; 200: 87–96.
- Varga Z, Yuana Y, Grootemaat AE, van der Pol E, Gollwitzer C, Krumrey M, etal. Towards traceable size determination of extracellular vesicles. J Extracell Vesicles. 2014; 3: 23298. doi: http://dx.doi.org/10.3402/jev.v3.23298.
- van der Meel R, Fens M, Vader P, van Solinge WW, Eniola-Adefeso O, Schiffelers RM. Extracellular vesicles as drug delivery systems: lessons from the liposome field. J Control Release. 2014; 195: 72–85.
- Skog J, Wurdinger T, van Rijn S, Meijer DH, Gainche L, Sena-Esteves M, etal. Glioblastoma microvesicles transport RNA and proteins that promote tumour growth and provide diagnostic biomarkers. Nat Cell Biol. 2008; 10: 1470–6.
- Balaj L, Lessard R, Dai LX, Cho YJ, Pomeroy SL, Breakefield XO, etal. Tumour microvesicles contain retrotransposon elements and amplified oncogene sequences. Nat Commun. 2011; 2: 180.
- Sharma S, Gillespie BM, Palanisamy V, Gimzewski JK. Quantitative nanostructural and single-molecule force spectroscopy biomolecular analysis of human-saliva-derived exosomes. Langmuir. 2011; 27: 14394–400.
- Anderson W, Kozak D, Coleman VA, Jamting AK, Trau M. A comparative study of submicron particle sizing platforms: accuracy, precision and resolution analysis of polydisperse particle size distributions. J Colloid Interface Sci. 2013; 405: 322–30.
- Farr RS. Random close packing fractions of lognormal distributions of hard spheres. Powder Technol. 2013; 245: 28–34.
- Lubachevsky BD, Stillinger FH. Geometric properties of random disk packings. J Stat Phy. 1990; 60: 561–83.
- Ouchiyama N, Tanaka T. Porosity of a mass of solid particles having a range of sizes. Ind Eng Chem Fundamen. 1981; 20: 66–71.
- O'Hern CS, Silbert LE, Liu AJ, Nagel SR. Jamming at zero temperature and zero applied stress: the epitome of disorder. Phys Rev E. 2003; 68: 011306.
- Lacroix R, Robert S, Poncelet P, Kasthuri RS, Key NS, Dignat-George F, etal. Standardization of platelet-derived microparticle enumeration by flow cytometry with calibrated beads: results of the International Society on Thrombosis and Haemostasis SSC Collaborative workshop. J Thromb Haemost. 2010; 8: 2571–4.