
Abstract
Extracellular vesicles (EVs) are emerging as potent non-invasive biomarkers. However, current methodologies are time consuming and difficult to translate to clinical practice. To analyse EV-encapsulated circulating miRNA, we searched for a quick, easy and economic method to enrich frozen human serum samples for EV. We compared the efficiency of several protocols and commercial kits to isolate EVs. Different methods based on precipitation, columns or filter systems were tested and compared with ultracentrifugation, which is the most classical protocol to isolate EVs. EV samples were assessed for purity and quantity by nanoparticle tracking analysis and western blot or cytometry against major EV protein markers. For biomarker validation, levels of a set of miRNAs were determined in EV fractions and compared with their levels in total serum. EVs isolated with precipitation-based methods were enriched for a subgroup of miRNAs that corresponded to miRNAs described to be encapsulated into EVs (miR-126, miR-30c and miR-143), while the detection of miR-21, miR-16-5p and miR-19a was very low compared with total serum. Our results point to precipitation using polyethylene glycol (PEG) as a suitable method for an easy and cheap enrichment of serum EVs for miRNA analyses. The overall performance of PEG was very similar, or better than other commercial precipitating reagents, in both protein and miRNA yield, but in comparison to them PEG is much cheaper. Other methods presented poorer results, mostly when assessing miRNA by qPCR analyses. Using PEG precipitation in a longitudinal study with human samples, we demonstrated that miRNA could be assessed in frozen samples up to 8 years of storage. We report a method based on a cut-off value of mean of fold EV detection versus serum that provides an estimate of the degree of encapsulation of a given miRNA.
MicroRNAs (miRNAs) are small RNA molecules of 19–22 nucleotides that downregulate mRNA expression either by impairing messenger RNA transcription or by promoting its degradation (Citation1). They are involved in several cell processes that maintain homeostasis, and their deregulation results in different diseases (Citation2). However, miRNA detection and quantification has become increasingly important not only because of their implication in pathogenesis but mostly because of their potential use as biomarkers. Indeed, circulating miRNAs can be present in serum, either coupled to protein complexes or contained into EVs that protect them from degradation. In several human pathologies, sets of miRNAs can be significantly altered in serum. Since some of them are tissue or cell specific, they may reflect the pathological or physiological status of the producing cells or tissues (Citation3–Citation5), opening the possibility to use them in non-invasive routine tests (Citation6) for diagnosis or prediction of response to treatment (Citation7–Citation10).
Extracellular vesicles (EVs) have emerged recently as powerful intercellular shuttles, given their ability to horizontally transfer genetic material and signalling moieties between different cells in the organism (Citation11). Among EVs, exosomes, sized between 50 and 200 nm, have an endocytic origin, while microvesicles bud from the plasma membrane and are commonly more heterogeneous in size. Both EV types can be released by most cells in physiological and pathological conditions (Citation11) and can therefore be isolated from all body fluids. Because of their content in mRNA and small regulatory RNAs, EVs represent an important source of potential biomarkers in many diseases that could provide a non-invasive method of early diagnosis or prognosis.
Differential ultracentrifugation (UC) has become the classical method for EV enrichment (Citation12). This method includes several UC steps with increasing speeds to sequentially enrich for the different types of EVs. However, serial UC is a costly protocol that cannot be easily adapted to a clinical laboratory for diagnostic purposes. Therefore, it would be necessary to optimize some steps in EV-associated miRNA analysis to make it suitable for a routine test in a hospital laboratory. Here, we analysed the yield of miRNA extraction after different EV-enrichment protocols from blood serum. We have tested and compared isolation methods based on precipitating agents, filtration-based protocols or column-based protocols and compared them with classical UC methodology. For downstream analysis, we quantified particle yield and size by nanoparticle tracking analysis (NTA) and demonstrated the presence of classical EV protein markers in EV preparations. Thereafter, we assessed the miRNA extraction yield of each method. Our results point to polyethylene glycol (PEG)-based precipitation as an easy, economic and quick method to enrich EV for a good performance in the subsequent miRNA extraction, from as little as 0.25 ml of human serum.
Longitudinal analysis of long-term frozen samples showed that they are suitable for exosomes enrichment and miRNA assessment up to 6–8 years frozen, whereas freezing longer than 13–14 years reduces miRNA detection. This highlights the importance of frozen storage time in the study of serum samples in longitudinal cohorts, the best scenario in biomarkers studies.
Materials and methods
Sample collection
From each sample, 8.5 ml of blood was taken in BD Vacutainer SST gel tubes and centrifuged at 1,800 rpm for 10 min to separate the serum fraction. Serum was then stored at −80°C in 1 ml aliquots until further processing. Before the analyses, thawed serum samples were centrifuged at 3,000g for 15 min to remove cells and cell debris.
EV-enrichment procedures
Ultracentrifugation
A volume of 0.25 ml of human serum was diluted to 32 ml in phosphate-buffered saline (PBS) and transferred to a 35 ml open top Ultra-ClearTM centrifuge tube (Beckman Coulter, Brea, CA) and centrifuged for 1 h at 100,000g at 4°C in a Beckman Coulter Avanti j-30 i centrifuge (Js-24,38 rotor, Beckman Coulter). The pellet was resuspended in 33 ml of PBS for a washing step and centrifuged again under the same conditions. Finally, the pellet was resuspended in H2O (250 µl) for subsequent RNA extraction or EV analysis.
ExoQuickTM exosome precipitation
ExoQuickTM exosome precipitation (EXQ) was used according to manufacturer's instructions (System Biosciences). Briefly, 250 µl of human serum was mixed with 126 µl of ExoQuick exosome precipitation solution and incubated for 30 min in ice. Samples were centrifuged at 1,500g for 30 min and resuspended in H2O (250 µl) for subsequent RNA extraction or EV analysis.
Total exosome isolation
Total exosome isolation (TEI) precipitating agent was used according to manufacturer's instructions (Invitrogen by Life Technologies). Briefly, 250 µl of serum was mixed with 100 µl of TEI reagent by vortexing to obtain a homogeneous solution and incubated for 30 min in ice. Samples were then centrifuged at 10,000g for 10 min at retrotranscription (RT) and resuspended in H2O (250 µl) for RNA extraction or EV analysis.
PEG precipitation
PEG EV precipitation was performed as described (Citation13). Briefly, 250 µl of serum was mixed with 100 µl of PEG 6000 (Merck) solution (50% PEG 6000 in 375 mM NaCl). Serum samples were mixed with PEG solution by repeated pipetting and incubated for 30 min in ice. After incubation, samples were centrifuged at 1,500g for 30 min at 4°C. Supernatant was discarded by aspiration to eliminate any residual PEG solution. Pellet was then resuspended in 250 µl of H2O for RNA extraction or EV analysis.
Exo-spin
Exo-spinTM blood (EX02) for blood plasma/sera was used according to manufacturer's instructions (Cell Guidance Systems). Briefly, 250 µl of human serum was mixed with 250 µl of buffer A by inverting tube and incubated at 4°C for 5 min. The mixture was centrifuged at 20,000g for 30 min. The supernatant was aspirated and exosome–containing pellet was resuspended in 100 µl of PBS before being added to the top of the previously activated column and centrifuged at 50g for 60 sec. The column was placed into a clean 1.5 ml microcentrifuge collection tube and EVs eluted with 250 µl of PBS by centrifugation at 50g for 60 sec.
ExoMirTM
ExoMirTM (EXM) was used according to manufacturer's instructions (Bioo Scientific). Briefly, 250 µl of human serum was loaded into syringe that has a filter system attached. The sample is passed through 2 consecutive filter systems (0.22 and 0.02 nm) that capture EVs. For downstream analyses, EVs were extracted from filters by rinsing them with 250 µl of H2O.
Nanoparticle tracking analysis
NTA was performed using a Nanosight LM10 and NTA 2.3 Software (NanoSight, Wiltshire, UK). EV samples were diluted in filtered PBS. Three 60-sec videos were recorded of each sample with camera level and detection threshold set at 10. Temperature was monitored throughout the measurements.
Bead-assisted flow cytometry of EVs
EV preparations were coupled overnight to aldehyde/sulphate-latex beads (4 µm; Invitrogen, Carlsbad, CA) and stained with anti-CD63 TEA3/18 mAb (Citation14) followed by appropriate secondary antibody. Samples were analysed by standard flow cytometry in a Cytomics FC 500 MPL cytometer (Beckman Coulter).
Western blot
EV preparations were lysed in non-reducing Laemmli loading buffer and resolved in a 4–25% gradient SDS–PAGE gel (Bio-Rad). Proteins were transferred onto a Polyvinylidene Difluoride (PVDF) membrane (Bio-Rad), blocked with 10% skimmed milk and incubated with the following primary antibodies: anti-TSG101 mAb (Abcam) and anti-CD81 5A6 mAb kindly provided by S. Levy (Stanford University, CA), followed by peroxidase-coupled secondary antibodies and detected by chemiluminescence with an ImageQuant LAS4000 biomolecular imager (GE Life Sciences).
RNA extraction and RT-PCR
Before inclusion into the study, serum samples were evaluated for the presence of hemolysis using a NanoDrop (hemolysed samples show a peak at 414 nm). RNA was purified with miRCURY™ RNA Isolation Kits-Biofluids (Exiqon) from resuspended EV samples or total serum samples. Briefly, 75 µl of lysis solution containing 1.25 µl of RNA spike-in templates UniSp2, UniSp4 and UniSp5 was added to samples. Protocol for RNA extraction was followed according to manufacturer's instructions. For the reverse transcription reaction with miRCURY RT kit (Exiqon), a volume of 2 µl of RNA per 10 µl of reaction was included as well as 0.5 µl of spike-in UniSp6 and cel-miR-39-3. Thus, UniSp2 and cel-miR-39-3 were used as RNA extraction and cDNA synthesis controls, respectively. After cDNA was diluted to 1:40, individual primer sets for UniSp2, cel-39-3, miR-16-5p, miR-21, miR-19a, miR-451, miR-30c, miR-143, miR-126 and miR-191 (all from Exiqon) were used and PCR was carried out in 384-well plates in a CFX384 Real-Time System (Roche).
RT-PCR analysis
UniSp2 was used as a reference gene for comparisons. The relative amount of each miRNA was calculated as ΔCt=Ct miRNA-Ct UniSp2. Comparison of levels of miRNAs detected in total serum with those detected in EV fraction was calculated using the comparative Ct method (ΔΔCt), where serum total miRNA was used as the calibrator, the final data were derived from . The EVs/total serum ratio was calculated using the following formula:
total serum.
Statistical analysis
Differences between groups were tested using Mann–Whitney U-test.
Ethical considerations
The longitudinal study was performed on serum samples from the prospective PEARL (Princesa Early Arthritis Register Longitudinal) study. Patients had been included in the PEARL cohort due to suspicion of early arthritis (Citation15). Only those samples from patients in which inflammatory or autoimmune disorders were ruled out were included. The registered protocol was reviewed and approved by the Ethics Committee for Clinical Research of Instituto de Investigación Sanitaria La Princesa. All patients were informed about the study and signed an informed consent form before inclusion in the PEARL study.
Results
Comparison of EV purity and yield of different isolation methods
Our aim was to assess the suitability of different EV-enrichment methods for the search of clinically relevant biomarkers, and to test whether EV-enrichment improved the detection of encapsulated miRNA. Therefore, our starting material was frozen/thawed human serum, which is routinely kept in hospital facilities. We took 0.25 ml of thawed serum from healthy donors for each protocol and followed manufacturer's instructions for EV isolation with the commercially available precipitating products (ExoQuick, TEI) as well as with the filter-based kit ExoMir, and the column-based Exo-spin kit. We also analysed the precipitation of EVs with PEG, following the procedure described by (Citation13). As an internal control, we pelleted EVs by UC (1 h at 100,000g; ).
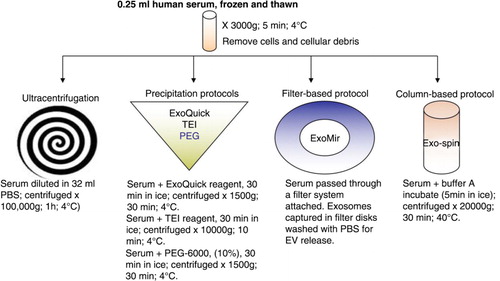
Fig. 1. Scheme of EV-enrichment protocols. Six different protocols were employed to enrich EVs from human serum: ultracentrifugation (UC), ExoQuick precipitation, total exosome isolation (TEI), PEG precipitation, ExoMir filtration and Exo-spin column.
Size and concentration of EVs obtained with the different protocols were measured by NTA (a). Similar results were obtained with the 3 precipitation protocols (ExoQuick, TEI and PEG). The particle concentration yield was very high and the mean particle size was around 140 nm. Increasing incubation times of the samples with the precipitation reagent up to overnight did not significantly improve performance (not shown). ExoMir and Exo-spin samples produced rather irregular profiles and around 10-fold fewer particles compared with precipitation methods. UC had a very scarce and poorly reproducible yield (a).
Fig. 2. Characterization of EV-enriched samples. (a) Nanoparticle tracking analysis measurements. A representative experiment in which 3 videos mean±SD recorded from each EV sample, isolated with the different protocols, are plotted. Concentration and mean particle size are also shown. (b) Protein analyses of EV samples. Lysates of EV enriched with the different protocols were assessed by WB for the presence of the EV markers Tsg101 and CD81. (c) Bead-assisted flow cytometry of EV samples obtained with the different protocols and stained for CD63. Data correspond to the mean±SEM of the mean fluorescence intensity for CD63 in 4 different donors. Negative control corresponds to EV-loaded beads stained only with secondary antimouse antibody.
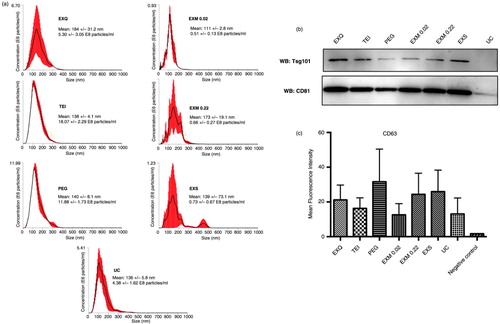
Validation of EV enrichment was performed by analysis of different EV protein markers by western blot and bead-assisted flow cytometry. Western-blot analyses with specific antibodies against 2 EV markers: CD81 and Tsg101 (b) revealed that all protocols produced an enrichment of serum EVs, with a clear detection of EV markers, except in ultracentrifuged samples (b). For a more quantitative analyses, we performed bead-assisted flow cytometry. EV samples were coupled to aldehyde/sulphate-latex beads and labelled with an abundantly expressed typical EV marker such as CD63 (Citation16, Citation17). In this set of experiments, the difference among protocols did not reach significance (c).
EV-associated microRNA analysis
Next, to assess which EV isolation method yielded the highest miRNA amount, we analysed the expression of 8 individual miRNAs by RT-PCR. First, we determined whether the protocols to isolate EVs could interfere with the RNA extraction. The isolation of RNA was monitored using the RNA spike-in kit from Exiqon following manufacturer's instructions. Amplification of spike-in UniSp2 was compared between total serum and the different protocols used for EVs isolation. Detection of UniSp2 was clearly reduced in EV samples isolated by UC and Exo-spinTM (>3CT compared with other methods and total serum) (a). No significant differences were observed between total serum, TEI, EXQ, PEG or EXM. On the other hand, amplification of cel-39-3 was used to determine differences in the RT step. We did not detect differences in RT between different protocols and total serum (b). Because of the defect in RNA extraction observed, UC and Exo-spinTM methods were excluded for the following analyses.
Fig. 3. miRNA qPCR analysis in total serum and EVs isolated using different methods. Threshold cycle (Ct) values for the spike-in UniSp2 (a) and cel-mir-39-3 (b) in total serum samples (TOT), and EVs isolated by ExoQuick (EXQ), total exosome isolation (TEI), polyethylene glycol (PEG) and ExoMir (EXM). Serum samples were obtained from 10 healthy individuals, EVs were isolated from 250 µl of serum as indicated in Materials and Methods section. RNA was purified from EVs and total serum (250 µl); spike-in UniSp2 was added to each sample before RNA extraction while the spike-in cel-mir-39-3 was added before cDNA synthesis. (c) Levels of miRNAs (miR-19a, miR16-5p, miR-21, miR-30c, miR-126, miR-143, miR-191 and miR-451) detected in total serum and EVs isolated with EXQ, TEI, PEG and EXM. miRNAs levels were calculated using the comparative Ct method (ΔΔCt), where the total serum was used as the calibrator. In all cases, mean±SEM is indicated. (d) The EVs/total serum ratio of miRNAs. miRNAs are grouped according to the mean of miRNA levels in EV fractions with respect to total serum. Fold <0.3: filled blue circles and (miR-16-5p, miR-19a and miR-21); fold >0.5: empty red squares (miR-30c, miR-126 and miR-143). Differences between both groups of miRNAs were tested using Mann–Whitney U-test. Lines indicate means.
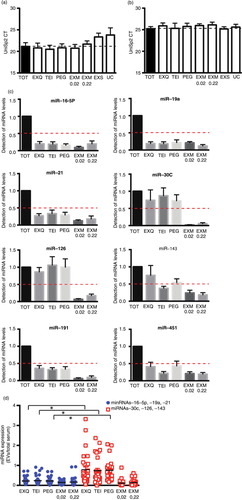
There are no established circulating miRNAs to be used as endogenous housekeeping controls and the proposed ones cannot be universally used. A further challenge in our study was the comparison between miRNAs present in EVs and in total serum because of the absence of known miRNAs equally represented in both types of sample. Thus, to normalize the results, we used precise volumes throughout the experiment and a synthetic miRNA (UniSp2) that was added into each sample before RNA extraction (Citation18, Citation19). As shown in c, very low levels of miR-16-5p, miR-19a and miR-21 were detected in the EV fraction compared with their expression in total serum, independently of the method employed. miR-191 and miR-451 were also poorly detected in EVs fractions, being however the difference with total serum smaller (c). On the other hand, the expression of miR-30c, miR-126 and miR-143 in EVs isolated with EXQ, TEI or PEG was closer to the levels detected in total serum, while their levels in EVs obtained with EXM were barely detectable (c). To distinguish those miRNAs expressed in EVs, we classified miRNAs following a cut-off value of mean of fold EV detection vs. total serum. Using this strategy, 3 clearly differentiated groups of miRNAs were observed. A first group comprised those miRNAs whose levels detected in EVs were close or sometimes even higher than those detected after RNA extraction from the total serum (folds vs. serum >0.5, which included miR-30c, miR-126 and miR-143). A second group of miRNAs, whose levels in EV-enriched samples were very low compared with total serum (c) and presented EV/serum ratio below 0.3, was formed by miR-16-5p, miR-19a and miR-21. Finally, miR-191 and miR-451 presented folds of EV vs. serum that ranged from 0.4 to 0.5; which may indicate that they are present in serum samples both as free miRNAs and encapsulated into EVs. This strategy may therefore be useful to determine the degree of EV encapsulation of a given miRNA in a biological fluid. Therefore, the EVs-miRNA/total serum ratio indicated a clear enrichment of encapsulated miRNAs after EV precipitation procedures (d). On the contrary, EXM was not a suitable method to obtain EVs for RNA analysis under our conditions.
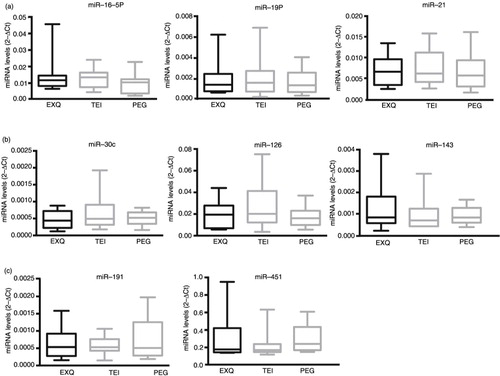
Next, we analysed the relative amount of miRNAs in the EV fractions using the following formula: ΔCt=Ct miRNA-Ct UniSp2. By comparing TEI, EXQ or PEG, non-significant differences were detected in the levels of the different groups of miRNAs studied (a–c). PEG was the procedure that gave, in most cases, the smaller dispersion of the data. Altogether, these data indicate that ExoQuick, TEI and PEG are suitable and comparable methods for isolating encapsulated miRNAs.
Fig. 4. Levels of miRNAs detected in EVs isolated with EXQ, TEI and PEG. Box plot diagrams showing the levels of miRNAs in EVs isolated using precipitation methods (EXQ, TEI, PEG) from 10 healthy donors. miRNAs are classified according to detection in EVs vs. total serum, (a) miR-16-5p, miR-19a and miR-21 (fold<0.3), (b) miR-30c, miR-125 and miR-143 (fold>0.5) and (c) miR-191 and miR-451 (fold 0.4–0.5). miRNA levels were normalized to UniSp2. The line within the boxes indicated the mean, the top edge indicates the maximum and the bottom edge indicates the minimum value.
EV-associated microRNA detection in long-term frozen samples
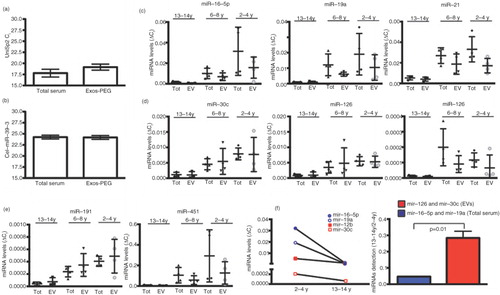
Since biomarker validation is often performed in longitudinal studies through the analyses of long-term frozen cohort samples, we next analysed whether long-term frozen storage affects the isolation of EVs and subsequent RNA extraction efficiency. Since, in comparison with other methods, PEG is less expensive, the experiments were performed using this precipitating agent. We thus isolated EVs by PEG precipitation from serum samples that had been stored at −80°C for 1 month up to 14 years and that had never been thawed before. In parallel, small RNA extraction was performed from the same starting volume of the same sera collection, but omitting the EV-enrichment step. PEG precipitation did neither significantly affect RNA extraction as indicated in the analysis of Ct in UniSp2 (a), nor RT reaction evaluated with the spike-in cel-miR-39-3 (b). Next, miRNA relative levels were determined by RT-PCR using ΔCt method as indicated in the Materials and Methods section. Although we could still recover miRNA from all samples, there was a remarkable decrease in detection levels after 8 years of storage, both in total sera and EV precipitates regardless of whether the miRNAs were encapsulated or not into EVs (c–e). However, when we compared the levels of miRNAs in frozen samples for 13–14 years with those frozen during only 2–4 years, a marked decrease in the detection of miR-16-5p and miR-19a in total serum was observed. In contrast, the decline was significantly smaller in miR-126 and miR-30c (f), indicating that miRNAs encapsulated into EVs are more protected from degradation.
Fig. 5. Longitudinal analyses of miRNA detection in total serum and EVs isolated by PEG from long-term stored sera collection. Threshold cycle (Ct) values for the spike-in UniSp2 (a) and cel-mir-39-3 (b) in total serum samples (Tot) and EVs isolated by polyethylene glycol (PEG). UniSp2 and cel-mir-39-3 were added to each sample before RNA isolation and RT reaction, respectively. Samples were classified according to the time storage: 13–14 years (n=3), 6–8 years (n=5) and 2–4 years (n=4). All samples remained frozen at −80°C until EVs and RNA purification. (c) Levels of miR-19a, miR-16-5p and miR-21 in total serum and EVs isolated with PEG. (d) Levels of miR-30c, miR-126 and miR-143 in total serum and EVs isolated with PEG. (e) Levels of miR-451 and miR-191 in total serum and EVs isolated with PEG. miRNAs levels were calculated using the comparative Ct method ΔCt=Ct miRNA-Ct UniSp2, and values correspond to 2−ΔCt . (f) Comparison of miRNA-16-5p and miR-19a detected in total serum and miR-30c and miR-126 levels detected in EVs fraction between samples frozen for 13–14 years and for 2–4 years. Bars correspond to the ratio: miRNA levels 13–14 years/miRNA levels 2–4 years; difference between groups was tested by Mann–Whitney U-test (p=0.01). In all cases, mean±SD is indicated.
Discussion
In the last years, studies focusing on circulating vesicles and microRNAs have increased dramatically due to their potential application to clinical practice. However, the methods used for EV isolation can largely influence the final result. As a consequence, optimization of the protocol for clinical purposes is absolutely necessary. In this study, we have compared different protocols for EV enrichment from serum samples in order to assess which could be better suited for miRNA profiling. It is important to highlight that our main aim was to optimize a protocol both suitable for clinical practice and aimed at the analysis of EV-related miRNA, so that EV purity was not the major goal to achieve, as long as contaminants would not interfere with miRNA detection. In our screening, we included 3 different precipitating reagents, one protocol based on filtration and one column-based kit. As a reference for a more classical procedure, we also directly pelleted by UC at 100,000g the diluted serum sample. Dilution in a large volume of buffer was performed to avoid the generation of a density gradient by the viscous serum in the tube. This density cushion may interfere with the pelleting of EVs. In any case, direct UC gave poor results, and very low reproducibility, probably due to a great variability in resuspension of the EV pellet. The use of precipitating reagents not only avoided the need for UC at high speed but also greatly improved reproducibility and gave the greatest yield when analysed by NTA. However, it has to be taken into account that protein aggregates, that may be present in this precipitated material, will also appear in the NTA counts. Differences between protocols were not so evident when EV markers were assessed, either by western blot or by bead-assisted flow cytometry. These data would imply that precipitation methods do precipitate a lot of non-vesicular components that give high number of counts in NTA. Electron microscopy of negatively stained samples did not provide any information about the different procedures. Vesicles were too scarce and precipitating reagents gave a very high background signal and in many cases affected the integrity of the grids, hampering any analysis of the samples. However, regarding miRNA yield, the performance of precipitating reagents was better compared with other commercial kits. This fact, together with the ease of manipulation, makes these procedures the best suited for a clinical approach. The overall performance of PEG was very similar, and sometimes better than other commercial precipitating reagents, but in comparison to them PEG is much cheaper. Therefore, for the longitudinal analysis, all EV samples were obtained by PEG precipitation.
Data normalization is a major challenge in data analysis of circulating miRNAs due to the absence of well-accepted control transcripts. Initially, our data were analysed using Biogazelle QBase software to search reference miRNAs. Normalizer miRNAs should be abundant and equally represented throughout the samples. Therefore, in our specific setting, the detection of the putative normalizer miRNA should remain unchanged after EV-enrichment procedures. Since the degree of encapsulation is an intrinsic characteristic of each individual miRNA, no single miRNAs could comply with all the requirements to be a normalizer when comparing EV miRNAs and total serum miRNAs. EV-enrichment procedures will affect their detection in a direct relationship with their degree of EV encapsulation. As an alternative approach for normalization, a synthetic miRNA added before RNA extraction was used to normalize data.
In our analyses, a similar behaviour could be observed for most miRNA analysed. In all cases, precipitating reagents gave a better yield than other commercial kits. In the case of ExoMir (EXM), it should be pointed out that we did not completely follow the instructions of the manufacturer. Because we wanted to perform downstream analyses of the samples, EVs were eluted from the filters using PBS, instead of extracting RNA directly from the filter, as proposed by the manufacturer. In the case of Exo-spin (EXS) EV-containing fraction was eluted, following manufacturer’ instructions, with PBS. The presence of salts during RNA extraction could interfere with an optimal isolation. Similarly, residual salts from the washing PBS could be affecting RNA isolation in ultracentrifuged samples.
In systemic circulation, extracellular miRNAs travel either freely circulating or encapsulated into EVs. However, few works have explored the question of how miRNAs are contained or packaged once they are exported from the cell. We analysed in parallel, the profile of a set of 8 miRNAs in an equivalent serum sample for which no EV extraction was performed. The group of miRNAs studied was selected based on previous data that describe their presence in peripheral circulation and/or their preferential expression in EVs. However, for some of these miRNAs it is not clear whether they are predominately transported via EVs or in complexes with proteins or lipoproteins, given that evidence supporting both possibilities has been documented. Using differential centrifugation methods, Wang et al. (Citation20) described that many of the miRNAs secreted from different cell lines are found both in the EVs and the EV-free fraction with different patterns of distribution. Our data show that EV extraction procedure resulted in a lower detection of all miRNAs analysed, this difference being really marked for miR-19a, miR-16-5p and miR-21, suggesting their preferential expression as free miRNAs. miR-16 is present in human blood, conjugated to both Argonaute-2 and in EVs (Citation21). However, it has been recently reported that miR-16 levels are significantly higher in serum than in EVs (Citation22). Similarly, some authors have reported the expression of miR-21 in EVs (Citation23, Citation24) or in vesicle-free plasma (Citation10). According to our data, both miR-16 and miR-21 are mainly detected in the EV-free fraction. Our results suggest that both miR-451 and miRNA-191 are distributed more homogeneously within and outside of EVs. In this sense, the authors detected similar levels of miR-451 in EVs and EV depleted fractions (Citation20). Finally, levels of miR-126, miR-30c and miR-143 in the EV fractions obtained with ExoQuick, TEI and PEG were closer and in a few samples higher to those detected after RNA extraction from total serum, supporting the notion of their preferential expression in EVs (Citation10, Citation25, Citation26). Thus, although differences were not significant, for a set of miRNA, enrichment of EVs would increase their concentration and therefore slightly improve their extraction and detection as compared with performing it directly from total serum. On the contrary, even though, in principle, protein aggregates may also be present in the precipitated material, our data strongly suggest that EV samples obtained with precipitating methods are almost devoid of contamination with other circulating miRNAs, either coupled to Argonaute or bound to lipoproteins, and that the EV/serum ratio could be experimentally used to determine to some extent the degree of encapsulation of a given miRNA.
Since samples may be frozen for their storage until their analysis, it is important to verify that EV-associated miRNAs are still detectable. In all of our analyses, a freezing/thawing cycle was performed after serum extraction and before EV enrichment. Our data demonstrate that although EV-associated miRNA seems to be more stable in time, both total miRNA and also EV-associated miRNA recovery yield are dramatically decreased after 8 years of storage at −80°C. Although in a previous study, Ge et al. reported that storage time had no significant influence on plasma miRNAs, authors only analysed samples stored up to 5 years (Citation27). Interestingly, it should be pointed out that EV enrichment by PEG precipitation did increase in many cases the detection of encapsulated miRNA above serum levels in those samples stored for long times.
In sum, our analyses highlight precipitation methods as the most suitable procedure for EV enrichment to be incorporated in clinical practice. This method can distinguish between EV-encapsulated miRNAs and those freely circulating, complexed with proteins or lipoproteins. Finally, this EV-enrichment step could be necessary to improve the detection of encapsulated miRNAs in long-term frozen samples.
Conflict of interest and funding
The authors have no conflict of interest to disclose.
Acknowledgements
The authors thank Manuel Gómez for English editing. This work was supported by grant PIE13/00041 from Instituto de Salud Carlos III and co-funded by Fondo Europeo de Desarrollo Regional (FEDER) to MM, IG-A, FS-M and MY-M, and BFU2014-55478-R from Ministerio de Economía y Competitividad to MY-M.
Related Research Data
References
- Negrini M, Nicoloso MS, Calin GA. MicroRNAs and cancer – new paradigms in molecular oncology. Curr Opin Cell Biol. 2009; 21: 470–9.
- Reid G, Kirschner MB, van Zandwijk N. Circulating microRNAs: association with disease and potential use as biomarkers. Crit Rev Oncol Hematol. 2011; 80: 193–208.
- Chen X, Ba Y, Ma L, Cai X, Yin Y, Wang K, etal. Characterization of microRNAs in serum: a novel class of biomarkers for diagnosis of cancer and other diseases. Cell Res. 2008; 18: 997–1006.
- Bala S, Petrasek J, Mundkur S, Catalano D, Levin I, Ward J, etal. Circulating microRNAs in exosomes indicate hepatocyte injury and inflammation in alcoholic, drug-induced, and inflammatory liver diseases. Hepatology. 2012; 56: 1946–57.
- Laterza OF, Lim L, Garrett-Engele PW, Vlasakova K, Muniappa N, Tanaka WK, etal. Plasma microRNAs as sensitive and specific biomarkers of tissue injury. Clin Chem. 2009; 55: 1977–83.
- Scholer N, Langer C, Dohner H, Buske C, Kuchenbauer F. Serum microRNAs as a novel class of biomarkers: a comprehensive review of the literature. Exp Hematol. 2010; 38: 1126–30.
- Vallelunga A, Ragusa M, Di Mauro S, Iannitti T, Pilleri M, Biundo R, etal. Identification of circulating microRNAs for the differential diagnosis of Parkinson's disease and multiple system atrophy. Front Cell Neurosci. 2014; 8: 156.
- Pivarcsi A, Meisgen F, Xu N, Stahle M, Sonkoly E. Changes in the level of serum microRNAs in patients with psoriasis after antitumour necrosis factor-alpha therapy. Br J Dermatol. 2013; 169: 563–70.
- Castro-Villegas C, Perez-Sanchez C, Escudero A, Filipescu I, Verdu M, Ruiz-Limon P, etal. Circulating miRNAs as potential biomarkers of therapy effectiveness in rheumatoid arthritis patients treated with anti-TNFalpha. Arthritis Res Ther. 2015; 17: 49.
- Jansen F, Yang X, Proebsting S, Hoelscher M, Przybilla D, Baumann K, etal. MicroRNA expression in circulating microvesicles predicts cardiovascular events in patients with coronary artery disease. J Am Heart Assoc. 2014; 3: e001249.
- Yanez-Mo M, Siljander PR, Andreu Z, Zavec AB, Borras FE, Buzas EI, etal. Biological properties of extracellular vesicles and their physiological functions. J Extracell Vesicles. 2015; 4: 27066.
- Thery C, Amigorena S, Raposo G, Clayton A. Isolation and characterization of exosomes from cell culture supernatants and biological fluids. Curr Protoc Cell Biol. 2006; Chapter 3: Unit 3 22.
- Kordelas L, Rebmann V, Ludwig AK, Radtke S, Ruesing J, Doeppner TR, etal. MSC-derived exosomes: a novel tool to treat therapy-refractory graft-versus-host disease. Leukemia. 2014; 28: 970–3.
- Yanez-Mo M, Alfranca A, Cabanas C, Marazuela M, Tejedor R, Ursa MA, etal. Regulation of endothelial cell motility by complexes of tetraspan molecules CD81/TAPA-1 and CD151/PETA-3 with alpha3 beta1 integrin localized at endothelial lateral junctions. J Cell Biol. 1998; 141: 791–804.
- Gonzalez-Alvaro I, Ortiz AM, Alvaro-Gracia JM, Castaneda S, Diaz-Sanchez B, Carvajal I, etal. Interleukin 15 levels in serum may predict a severe disease course in patients with early arthritis. PLoS One. 2011; 6: e29492.
- Escola JM, Kleijmeer MJ, Stoorvogel W, Griffith JM, Yoshie O, Geuze HJ. Selective enrichment of tetraspan proteins on the internal vesicles of multivesicular endosomes and on exosomes secreted by human B-lymphocytes. J Biol Chem. 1998; 273: 20121–7.
- Raposo G, Stoorvogel W. Extracellular vesicles: exosomes, microvesicles, and friends. J Cell Biol. 2013; 200: 373–83.
- Akbas F, Coskunpinar E, Aynaci E, Oltulu YM, Yildiz P. Analysis of serum micro-RNAs as potential biomarker in chronic obstructive pulmonary disease. Exp Lung Res. 2012; 38: 286–94.
- Farina NH, Wood ME, Perrapato SD, Francklyn CS, Stein GS, Stein JL, etal. Standardizing analysis of circulating microRNA: clinical and biological relevance. J Cell Biochem. 2014; 115: 805–11.
- Wang K, Zhang S, Weber J, Baxter D, Galas DJ. Export of microRNAs and microRNA-protective protein by mammalian cells. Nucleic Acids Res. 2010; 38: 7248–59.
- Spinetti G, Fortunato O, Caporali A, Shantikumar S, Marchetti M, Meloni M, etal. MicroRNA-15a and microRNA-16 impair human circulating proangiogenic cell functions and are increased in the proangiogenic cells and serum of patients with critical limb ischemia. Circ Res. 2013; 112: 335–46.
- Alegre E, Sanmamed MF, Rodriguez C, Carranza O, Martin-Algarra S, Gonzalez A. Study of circulating microRNA-125b levels in serum exosomes in advanced melanoma. Arch Pathol Lab Med. 2014; 138: 828–32.
- Pfeffer SR, Grossmann KF, Cassidy PB, Yang CH, Fan M, Kopelovich L, etal. Detection of exosomal miRNAs in the plasma of melanoma patients. J Clin Med. 2015; 4: 2012–27.
- Hulsmans M, Holvoet P. MicroRNA-containing microvesicles regulating inflammation in association with atherosclerotic disease. Cardiovasc Res. 2013; 100: 7–18.
- Ramezani A, Devaney JM, Cohen S, Wing MR, Scott R, Knoblach S, etal. Circulating and urinary microRNA profile in focal segmental glomerulosclerosis: a pilot study. Eur J Clin Invest. 2015; 45: 394–404.
- Li Y, Zhang L, Liu F, Xiang G, Jiang D, Pu X. Identification of endogenous controls for analyzing serum exosomal miRNA in patients with hepatitis B or hepatocellular carcinoma. Dis Markers. 2015; 2015: 893594.
- Ge Q, Zhou Y, Lu J, Bai Y, Xie X, Lu Z. miRNA in plasma exosome is stable under different storage conditions. Molecules. 2014; 19: 1568–75.