
Abstract
Extracellular vesicles (EVs) in synovial fluid (SF) are gaining increased recognition as important factors in joint homeostasis, joint regeneration, and as biomarkers of joint disease. A limited number of studies have investigated EVs in SF samples of patients with joint disease, but knowledge on the role of EVs in healthy joints is lacking. In addition, no standardized protocol is available for isolation of EVs from SF. Based on the high viscosity of SF caused by high concentrations of hyaluronic acid (HA) – a prominent extracellular matrix component – it was hypothesized that EV recovery could be optimized by pretreatment with hyaluronidase (HYase). Therefore, the efficiency of EV isolation from healthy equine SF samples was tested by performing sequential ultracentrifugation steps (10,000g, 100,000g and 200,000g) in the presence or absence of HYase. Quantitative EV analysis using high-resolution flow cytometry showed an efficient recovery of EVs after 100,000g ultracentrifugation, with an increased yield of CD44+ EVs when SF samples were pretreated with HYase. Morphological analysis of SF-derived EVs with cryo-transmission-electron microscopy did not indicate damage by high-speed ultracentrifugation and revealed that most EVs are spherical with a diameter of 20–200 nm. Further protein characterization by Western blotting revealed that healthy SF-derived EVs contain CD9, Annexin-1, and CD90/Thy1.1. Taken together, these data suggest that EV isolation protocols for body fluids that contain relatively high amounts of HA, such as SF, could benefit from treatment of the fluid with HYase prior to ultracentrifugation. This method facilitates recovery and detection of CD44+ EVs within the HA-rich extracellular matrix. Furthermore, based on the findings presented here, it is recommended to sediment SF-derived EVs with at least 100,000g for optimal EV recovery.
To access the supplementary material to this article, please see Supplementary files under ‘Article Tools’.
Lately there has been an increased recognition of the role of extracellular vesicles (EVs) in joint regeneration and joint disease, and suggestions have been made for EV-based clinical applications (Citation1). In this context, EVs derived from synovial fluid (SF) are currently being investigated to unravel their role in these processes and their biomarker potential for joint disease. Several studies have examined EVs isolated from SF (Citation2–Citation19). In most of these studies EVs have only been isolated from human SF obtained from inflamed joints. The fact that studies did not include samples from healthy controls is mainly because of ethical constraints concerning joint puncture in healthy subjects and the resulting low availability of healthy samples from the clinic. However, in order to fully understand the role of EV-driven (patho)physiological processes in joints, knowledge about EVs in healthy joints is of utmost importance. Animal studies can ultimately give answers, but small animal models (rodents) do not provide sufficient volumes of SF for EV isolation, nor are their joints representative for the human situation in a biomechanical sense. The horse, on the contrary, is a well-suited species for obtaining large volumes of healthy SF. Furthermore, equine and human joints show great similarities (Citation20) and the horse is an acknowledged animal model for human joint disease (Citation21, Citation22).
Since all body fluids have their own characteristic composition, EV isolation protocols need to be tailored for each specific fluid (Citation23–Citation25). SF, especially if derived from healthy joints, is very viscous due to high concentrations of high-molecular-weight hyaluronic acid (HA), also known as hyaluronan (Citation26, Citation27). Although some previous studies included hyaluronidase (HYase) treatment of SF prior to EV isolation (Citation10, Citation11), the effect of HYase treatment on EV recovery has not been investigated in detail. In fact, an optimized protocol for EV recovery from SF is lacking and documented protocols for EV isolation and analysis differ widely and are often incomplete.
In the current study, the recovery of EV subsets from healthy equine joint-derived SF was analysed using different centrifugation protocols in the absence or presence of HYase. Quantitative and qualitative analysis of EV subsets was performed using single-EV-based high-resolution flow cytometric (FCM) analysis (Citation28, Citation29), cryo-transmission-electron microscopy (cryo-TEM) (Citation30), and Western blotting. Based on the results, suggestions are made for an optimized protocol for EV isolation from SF.
Materials and methods
Experimental study design, ultracentrifugation steps, and density gradient composition
The complete work flow for this study and the specific EV isolation protocol are depicted in . The protocol was based on earlier protocols used for EV isolation from SF as summarized in Table , (Citation2–Citation19) but was more comprehensive than most of these, as it was made to meet the recently defined minimal requirements for functional EV studies (Citation31). The technical specifications of ultracentrifugation steps (centrifugation speeds, rotor types, etc.) and density gradient floatation are indicated in the individual sections. For all ultracentrifugation steps, rotors with swing-out buckets were used. The compositions of the OptiPrep and sucrose density gradients are presented in Supplementary Fig. 1.
Fig. 1 Work flow for isolation of extracellular vesicles from synovial fluid including enzymatic digestion of hyaluronic acid.

Table I. EV isolation and characterization methods for SF-derived EVs published between 1995 and 2016
Reagents and antibodies
HYase type II from sheep testes, PKH67 green fluorescent dye with diluent-C (MIDI-67-1KT kit), and OptiPrep™ density gradient medium (iodixanol 60% w/v) were purchased from Sigma-Aldrich (St. Louis, MO, USA). Phosphate buffered saline (PBS) was purchased from Gibco (Thermo Scientific, Waltham, MA, USA). Protifar protein powder was purchased from Nutricia (Zoetermeer, the Netherlands). Sucrose was purchased from J.T. Baker (Avantor Performance Materials, Center Valley, PA, USA). The following primary antibodies were used for Western blotting and/or high-resolution FCM: anti-CD9 (clone HI9, Biolegend, San Diego, CA, USA), anti-CD44 (clone IM7, PE-conj., eBioscience, San Diego, CA, USA), isotype control for anti-CD44 (rat IgG2bκ, PE-conj., eBioscience), anti-Annexin-1 (clone 29/Annexin-1, BD Transduction Labs, San Jose, CA, USA), and anti-CD90/Thy1.1 (clone MRC-OX-7, PE-conj., Abcam, Cambridge, UK). Secondary antibody for Western blotting was HRP-conjugated goat-anti-mouse IgG (Nordic Immunology Laboratories, Susteren, the Netherlands).
EV depletion of reagents containing BSA and FBS
EV-depleted PBS/0.1% BSA, used for suspension of EV pellets, was prepared by making a stock solution of 5% (w/v) BSA (GE Healthcare, Amersham, UK) in PBS, which was cleared of EVs by ultracentrifugation at 100,000g for 16 h at 4°C (Optima™ L-90K or Optima™ XPN-80 centrifuge; SW28 rotor; 28,000 rpm; relative centrifugation force (RCF) average 103,745g; RCF max 141,371g; κ-factor 245.5; Beckman-Coulter, Fullerton, CA, USA), filtered through a 0.22-µm filter, stored in aliquots at −20°C, and diluted 50× in PBS prior to use.
EV-depleted RPMI/10% FBS, used to stop the PKH67 staining process, was prepared by making a stock solution of 30% (v/v) FBS (PAA Laboratories, GE Healthcare) in roswell park memorial institute medium (RPMI) (Gibco, Thermo Scientific), which was cleared of EVs by ultracentrifugation at 100,000g for 16 h at 4°C (as described above), filtered through a 0.22-µm filter, stored in aliquots at −20°C, and diluted 3× in RPMI prior to use.
This protocol for EV depletion of reagents is a standard procedure in our lab (Citation29) and results in very few remaining EVs if the following precautions are taken: a) start with dilutions of BSA (max 5%) and FBS (max 30%) in the buffer/medium of choice; b) use a swing-out rotor; c) use a centrifugation time of at least 16 h; d) leave at least 5 ml of supernatant above the EV pellet.
Collection of equine SF
SF samples were collected post-mortem with owner consent from adult warmblood horses that were euthanized for reasons other than joint disease at the Utrecht University Equine Hospital. Healthy SF (5–10 ml) without blood contamination was collected by arthrocentesis from the carpal joints within 2 h after euthanasia and cleared from cells by centrifugation at 2,700g (4,000 rpm) 30 min at room temperature (RT) in a Hettich Universal 32 centrifuge (Hettich, Tuttlingen, Germany) with rotor 1619. Cell-free samples were aliquoted and stored at −80°C.
EV isolation and labelling for high-resolution FCM and Western blotting (CD9 and CD44)
The stored, healthy, cell-free SF of 2 donors (adult horses; 4 ml/donor) was thawed and for each donor divided into 2 aliquots of 2 ml. Aliquots were incubated either with 40 µl PBS or with 40 µl HYase solution (1,500 U/ml in H2O) for 15 min in a water bath at 37°C while vortexing every 5 min. Protein aggregates were removed by centrifugation at 1,000g for 10 min at RT in an Eppendorf centrifuge (Hettich Mikro 200R with rotor 2424A). The supernatants were transferred into SW60 tubes (Beckman-Coulter) and gently mixed with 2 ml PBS. EVs were pelleted with 3 sequential ultracentrifugation steps of 10,000g (35 min, 9,900 rpm; RCF average 10,066g; RCF max 13,205g; κ-factor 1667.7), 100,000g (65 min, 31,300 rpm; RCF average 100,618g; RCF max 132,000g; κ-factor 166.8), and 200,000g (65 min, 44,000 rpm; RCF average 198,835g; RCF max 260,849g; κ-factor 84.4) using an SW60-Ti rotor in a Beckman-Coulter Optima™ L-90K or Optima™ XPN-80 ultracentrifuge at 4°C. EV pellets were suspended in a mixture of 20 µl EV-depleted PBS/0.1% BSA and 30 µl diluent-C. To each sample 4 µl anti-CD44-PE antibody (0.2 mg/ml) or 4 µl anti-IgG2bκ-PE isotype control antibody (0.2 mg/ml) was added and incubated for 1 h at RT on a shaker. Prior to use the anti-CD44-PE and the IgG2bκ-PE stock solutions were centrifuged in order to pellet aggregates (21,000g, 20 min, 4°C; Hettich Mikro 200R with rotor 2424A). After CD44-PE or isotype labelling 50 µl diluent-C was added (to create a total volume of 100 µl) and this was mixed with PKH67 staining mix (1.5 µl PKH67 in 100 µl diluent-C). After 3 min incubation at RT, 50 µl of EV-depleted RPMI/10% FBS was added to stop the staining process. Labelled EVs (250 µl) were then mixed with 1.5 ml pure OptiPrep (iodixanol 60% w/v) and used for density gradient floatation. A dye background control sample (20 µl EV-depleted PBS/0.1% BSA+30 µl diluent-C, without EVs) was taken along during the entire procedure of PKH67 labelling, anti-CD44 labelling, and OptiPrep gradient floatation. High-resolution FCM of this control sample did not show significant background in gradient fractions of interest (data not shown).
EV isolation and labelling for cryo-TEM and Western blotting (Annexin-1 and CD90/Thy1.1)
The stored, healthy, cell-free SF of 2 donors (adult horses; 6 ml/donor) was thawed, pooled, and divided into 6 aliquots of 2 ml. Each aliquot was incubated with HYase and cleared from protein aggregates as described above. Supernatants were pooled, transferred into MLS50 tubes (Beckman-Coulter) (3 ml per tube) and gently mixed with 2 ml PBS. EVs were pelleted with 2 sequential ultracentrifugation steps of 10,000g (35 min, 10,000 rpm; RCF average 8,025g; RCF max 10,730g; κ-factor 1,777) and 200,000g (120 min, 50,000 rpm; RCF average 200,620g; RCF max 268,240g; κ-factor 71.7) using an MLS50 rotor in a Beckman-Coulter Optima™ MAX-E ultracentrifuge at 4°C. Note that by omitting the 100,000g centrifugation step, all EVs that would have been recovered in a separate 100,000g step are now recovered in the 200,000g step (in this paper these vesicles will be referred to as “100/200,000g EVs”). The EV pellets of each of 4 corresponding tubes were resuspended in PBS, pooled (final volume 250 µl EVs), and mixed with 1.25 ml 2 M sucrose solution (in PBS) and used for sucrose density gradient floatation.
Density gradient floatation of EVs
OptiPrep™ density gradient floatation
Pelleted 10,000g, 100,000g, or 200,000g EVs, labelled with anti-CD44-PE (or isotype control) and PKH67, mixed with pure OptiPrep (iodixanol 60% w/v) (total volume=1.75 ml) in SW40 tubes (Beckman-Coulter) were carefully overlaid with 15 volumes of 700-µl OptiPrep solutions with decreasing density (pure OptiPrep diluted in PBS) to create continuous gradients of±51–0% iodixanol (Supplementary Fig. 1). Gradients were centrifuged at 200,000g for 16 h at 15°C (Beckman-Coulter Optima™ L-90K or Optima™ XPN-80 centrifuge; SW40-Ti rotor; 39,000 rpm; RCF average 192,072g; RCF max 270,519g; κ-factor 144.5). After centrifugation 12 fractions of 1 ml were carefully collected from top (fraction 1) to bottom (fraction 12) by using a P1000 pipette and OptiPrep densities were calculated by refractometry (Citation32).
Sucrose density gradient floatation
Pelleted 10,000g or 100/200,000g EVs, mixed with 2 M sucrose solution (total volume=1.5 ml) in MLS50 tubes (Beckman-Coulter) were carefully overlaid with sucrose solutions of 1.4, 0.4, and 0 M (sucrose in PBS) to create 2 discontinuous sucrose gradients (Supplementary Fig. 1). Gradients were centrifuged at 200,000g for 16 h at 4°C (Beckman-Coulter Optima™ MAX-E centrifuge; MLS50 rotor; 50,000 rpm; RCF average 200,620g; RCF max 268,240g; κ-factor 71.1). After centrifugation 5 fractions of 1 ml were collected from bottom (fraction 5) to top (fraction 1) by using a peristaltic pump connected to a capillary tube reaching to the bottom of the centrifuge tube. Fraction densities were calculated by refractometry.
Single-EV-based high-resolution FCM
OptiPrep gradient fractions 1–9 (containing 10,000g, 100,000g, or 200,000g EVs from SF treated with or without HYase) were diluted 1:20 in PBS and single-EV-based high-resolution FCM was performed using an optimized jet-in-air-based BD Influx™ flow cytometer (Becton Dickinson, San Jose, CA, USA), as previously described in detail (Citation28, Citation29) (Citation33). Briefly, detection of EVs by this system is based on threshold triggering by the fluorescence emitted after excitation of fluorescently labelled particles passing the first laser (FL1 signal). The threshold for triggering on FL1 was adjusted to allow an event rate of ≤10 events/s when clean PBS was analysed. The threshold level was kept identical for all measurements in this study. Forward scatter (FSC) of EVs was measured through an adapted small particle detector with a collection angle of 15–25° (reduced wide-angle FSC), by using a high numerical aperture and long working distance lens and by installing a 5-mm obscuration bar in front of the FSC collection lens. These settings allow the best distinction of FSC and FL1 fluorescence for fluorescent 100 nm and 200 nm yellow-green (505/515) carboxylated polystyrene beads (FluoSpheres, Life Technologies, Thermo Scientific, Waltham, MA, USA) with which the flow cytometer was calibrated. For experiments a 140-µm nozzle was used. The sheath fluid pressure was kept between 4.98 and 5.02 psi and was monitored by an external pressure meter. The sample pressure was set to 4.29 psi. Data were acquired using BD FACS™ Software v1.0.1.654 (BD Biosciences, San Jose, CA, USA) and analysed with FlowJo v10.07 software (FlowJo, Ashland, OR, USA).
For time-based quantification of EVs per gradient fraction, the amount of PKH67 events (FL1 signal) per 30 s was measured and the percentage of CD44-PE positive events (FL3 signal) was assessed relative to the isotype control condition. Total EV concentrations per ml of SF were calculated based on the event rate measurement per 30 s and a volume measurement of 14.5 µl per 30 s. Volume measurement was performed by a 30–60 min measurement of an H2O sample and calculating the weight difference of the tube over time.
Western blotting
For OptiPrep gradients, 375 µl of fractions 2–7 were pooled (i.e. fractions 2+3, 4+5, and 6+7) since these fractions contained the highest concentration of EVs according to high-resolution FCM. Pooled fractions (750 µl each) were diluted in SW28 tubes (Beckman-Coulter) by adding 37 ml PBS. EVs were pelleted at 100,000g for 60 min at 4°C (Beckman-Coulter Optima™ L-90K or Optima™ XPN-80 centrifuge; SW28 rotor; 28,000 rpm; RCF average 103,745g; RCF max 141,371g; κ-factor 245.5).
For sucrose gradients, fractions 2, 3, and 4 were pooled and 1 ml of pooled sample mixed with 11 ml PBS was centrifuged in SW40 tubes (Beckman-Coulter) to pellet EVs by using the identical protocol as for pelleting EVs for cryo-TEM.
Finally, EV pellets were suspended in 70 µl non-reducing SDS-PAGE sample buffer [50 mM TRIS (pH 6.8), 2% SDS, 10% glycerol, 0.02% bromophenol blue], heated at 100°C, run on 4–20% Criterion TGX gels (Bio-Rad, Hercules, CA, USA), and transferred onto 0.2 µm polyvinylidene difluoride (PVDF) membranes. After blocking (1 h, 5% Protifar in PBS 0.1% Tween-20) proteins were labelled with primary antibodies against CD9 (dilution 1:1,000), CD44 (dilution 1:400), Annexin-1 (dilution 1:400), and CD90/Thy1.1 (dilution 1:400) and a HRP-labelled secondary antibody (dilution 1:5,000) was used for detection by chemiluminescence (SuperSignal West Pico Chemiluminescent Substrate, Thermo Scientific). Chemiluminescence was visualized using a ChemiDoc™ MP Imaging System (Bio-Rad, Hercules, CA, USA) and analysed with Bio-Rad Image Lab V5.1 software (Bio-Rad).
Cryo-TEM
For cryo-TEM, sucrose gradient fractions 2, 3, and 4 (containing 10,000g or 100/200,000g EV) were pooled per gradient and diluted by adding 9 ml PBS to SW40 tubes (Beckman-Coulter). EVs were pelleted at 200,000g for 60 min at 4°C (Beckman-Coulter Optima™ L-90K or Optima™ XPN-80 centrifuge; SW40-Ti rotor; 39,000 rpm; RCF average 192,072g; RCF max 270,519g; κ-factor 144.5). EV pellets were carefully suspended in 20 µl PBS and stored on ice for 1–2 h until vitrification using a Vitrobot™ Mark IV system (FEI, Eindhoven, Netherlands). Three microlitres of EV sample was directly placed onto a glow-discharged 2/2 copper grid (Quantifoil, Jena, Germany). Excess sample was removed with 595 filter paper (Schleicher & Schuell, Whatman Plc., Kent, UK) in the Vitrobot chamber for 1 s at 100% relative humidity, with subsequent plunging into liquid ethane (3.5 purity). Residual ethane was removed with filter paper and grids were stored in cryo-boxes under liquid N2 for later imaging. For cryo-TEM, grids were transferred to a Gatan 626 cryo-holder (Gatan Inc., Pleasanton, CA, USA), which was inserted into a Tecnai™ 20 transmission electron microscopy (FEI) with LaB6 filament operated at 200 kV. Images were acquired with a 4,000×4,000 Eagle charge coupled device (CCD) camera (FEI) at a 19,000× magnification, 5–10 µm under focus.
For morphology of EVs, individual EVs were categorized as “single EVs” (1 EV with a single membrane), “multi-membrane EVs” (2 EVs merged together, or 1 EV with double membrane), “collections of EVs” (more than 2 EVs merged into 1 entity), or “other small particles” (very small vesicle-like particles without clear membrane). Single EVs were further subcategorized into “spherical EVs” (diameter ratio ≥0.7) or “tubular EVs” (diameter ratio <0.7). Multi-membrane EVs and collections of EVs were counted as 1 entity. For size distribution of spherical EVs, the smallest and largest diameter of each individual EV was measured with the “measure tool” in ImageJ (1.48v) and the “diameter ratio” (smallest diameter/largest diameter) was determined. The average diameter for each EV [(smallest+largest diameter)/2] was used for the size distribution graphs.
Statistical analysis
All data in bar graphs are plotted as means of individual measurements of 2 donors. Error bars in all graphs represent the range, indicating the highest and lowest observed values (n=2). Statistical analysis for and was performed on data from 2 donors by using the total EV counts or the relative amount of CD44+ EVs present in the 9 fractions of each gradient as data points. Log-transformation was carried out on total EV counts to gain normal distribution among the 9 fractions. Overall significant differences in all gradient fractions between +HYase and −HYase were calculated in SPSS 22.0 software (IBM, Chicago, USA), using a linear mixed model, with “donor” as a subject and “gradient fraction” (=F1 to F9), “centrifugation step” (=10,000g or 100,000g or 200,000g), and “HYase treatment” (= +HYase or −HYase) as (repeated) fixed factors. Differences with p-values <0.05 were considered significant based on 95% confidence intervals.
Results
Quantification of EVs from SF with or without HYase treatment and detection of EV markers
To characterize and quantify EVs from healthy SF and to investigate the effect of HYase treatment, EVs from equine SF were isolated based on differential centrifugation followed by density gradient floatation. Equine SF was harvested from healthy joints of 2 donors and the samples were processed as summarized in and Supplementary Fig. 1. Previously we analysed whether dilution of fresh SF (1:2 in EV-depleted PBS/0.1% BSA) prior to storage at −80°C would benefit EV isolation and analysis. Since pre-dilution of SF resulted in inconsistent data and loss of EVs (data not shown), in the current protocol, fresh samples were not diluted prior to HYase treatment. After HYase treatment, a 1:1 dilution of the sample was performed.
PKH67-labelled EVs in OptiPrep gradient fractions were measured as single-vesicle events by high-resolution FCM (). EVs were detected throughout fractions F2–F7 with densities between 1.02 and 1.16 g/ml. Highest concentration of EVs were found in gradient fractions F3–F5 (density 1.05–1.10 g/ml). The majority of all EVs were recovered in the 100,000g centrifugation step, regardless of HYase treatment (a). Total EV recovery (sum of 10,000g EVs+100,000g EVs+200,000g EVs in gradient fractions F2–F7) was not significantly affected by pretreatment with HYase. By using the event rate and the sample volume measurement during high-resolution FCM analysis, the biological concentrations of EVs in healthy equine SF (calculated from the HYase-treated samples after OptiPrep density gradient) could be estimated at 7×10⁸ EVs/ml.
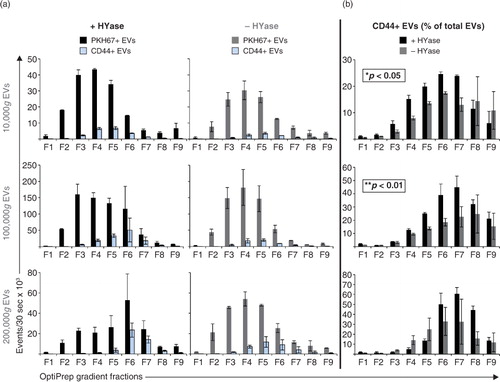
Fig. 2. High-resolution FCM of EVs derived from SF; detection of PKH67+ EVs. EVs were isolated from HYase-treated or non-treated healthy SF, labelled with PKH67, floated in OptiPrep gradients, and analysed using high-resolution FCM in gradient fractions F1 (low density) to F9 (high density). (a) Quantification of PKH67+ events (single EVs) for the subsequent 10,000g, 100,000g, and 200,000g ultracentrifugation steps. Bars represent mean (n=2); error bars represent minimum and maximum observed values. (b) Representative scatter plots corresponding to Fig. 2a for gradient fractions F3–F6. In this figure, the arbitrary regions I–IV were set to indicate observed differences in the light-scattering properties of EVs in each fraction, indicative for the recovery of different EV populations.
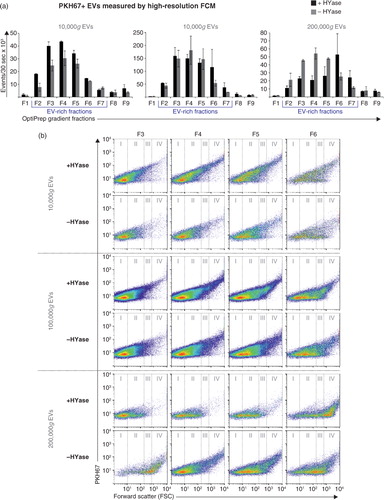
HYase treatment, however, substantially increased the number of EVs pelleting at 10,000g, whereas in the non-treated samples a higher number of EV tended to pellet at 200,000g (a). In addition, differences in light scattering properties of EVs were observed between the HYase-treated and non-treated samples (most clear in arbitrary regions II and III in the 10,000g and 100,000g centrifugation steps and in regions III and IV in the 200,000g centrifugation step). Because light scattering of EVs is dependent on a range of factors, such as size, cargo, and membrane composition, these findings could be indicative for recovery of different EV subsets in HYase-treated and non-treated samples after similar centrifugation conditions (b).
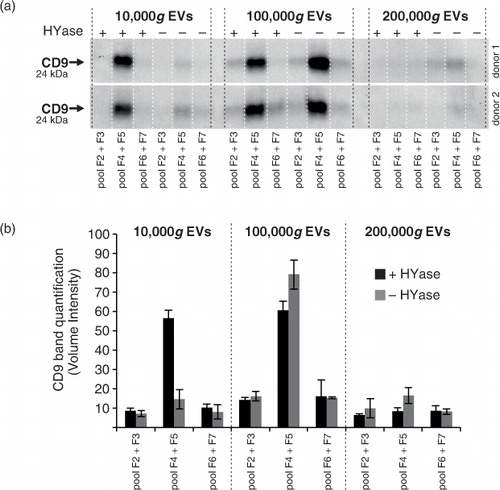
The quantitative results obtained with single-EV-based high-resolution FCM (a) corroborate with the CD9 Western blot results of EVs in pools of the same gradient fractions (; Supplementary Fig. 2a). Similar to the recovery of PKH67-labelled EVs, HYase treatment resulted in a more efficient recovery of CD9+ EVs after 10,000g pelleting, whereas the additional 200,000g step improved the recovery of CD9+ EVs from the non-treated samples. When total CD9 signal (sum) of all gradient fractions was compared, HYase treatment resulted in approximately 10% more CD9+ EVs.
Fig. 3. Detection of CD9 (tetraspanin; EV marker) on EVs from healthy SF by Western blotting. EVs were isolated from HYase-treated or non-treated healthy SF and floated in OptiPrep gradients. (a) CD9 detection on EVs in pools of OptiPrep fractions F2–F7 (F2=low density; F7=high density). (b) Quantification of CD9+ bands from Fig. 3a. Bars represent mean (n=2); error bars represent minimum and maximum observed values.
In addition to CD9, selected as general EV marker (Citation31), Annexin-1 and CD90/Thy1.1 were analysed on SF-derived EVs because of their relevance in the joint. Annexin-1 was previously found on neutrophil-derived EVs during inflammatory arthritis (Citation11), and CD90/Thy1.1 is a cell surface marker of fibroblasts in the synovial lining (Citation34). The latter was verified on primary equine fibroblast-like synoviocytes (Supplementary Fig. 3). Indeed, both Annexin-1 and CD90/Thy1.1 could be detected on 10,000g and 100/200,000g EVs from healthy SF (Supplementary Fig. 2b).
Cryo-TEM of EVs from healthy SF
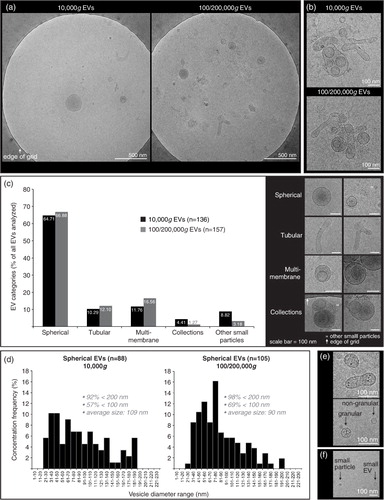
Cryo-TEM investigation was performed in order to confirm intact EVs in our preparations and to determine size and shape of 10,000g versus 100/200,000g EVs from healthy SF (). A typical distribution on the grids showed single intact vesicles (a). In both the 10,000g and the 100/200,000g samples, only occasional clusters of EVs were seen (b). Further, both the 10,000g and the 100/200,000g ultracentrifugation resulted in a large diversity of EV shapes and sizes, for which the spherical shape was most abundant, comprising about 65% of all EVs (c). Of note, about 3–8% of analysed particles were defined as “other small particles” (<20 nm and lacking a clear vesicle membrane) (f). When evaluating the size distribution of spherical EVs (d), 92–98% of all EVs had diameters between 20 and 200 nm in both centrifugation conditions. The highest frequencies of EVs <100 nm, however, were found in the 100/200,000g centrifugation step (69% vs. 57% in the 10,000g step). The average diameter was 109 nm for 10,000g EVs (n=88) and 90 nm for 100/200,000g EVs (n=105). Occasionally EVs were found with high electron-dense granules in their lumen (not quantified) (e).
Fig. 4. Cryo-transmission-electron microscopy (cryo-TEM) analysis of EVs isolated from HYase-treated healthy SF. EVs were pelleted using centrifugation steps of 10,000g (=10,000g EVs), immediately followed by 200,000g, omitting the 100,000g step (=100/200,000g EVs, representing a pool of all EVs that are pelleted if using subsequent 100,000g and 200,000g centrifugation steps). Isolated EVs were floated in sucrose gradients followed by cryo-TEM analysis. (a) Representative images of EV distribution in the grid holes as they are most often observed. (b) Clusters of EVs occasionally observed for both centrifugation steps. (c) Quantification of typical EV morphologies found in healthy SF. Note that sometimes vesicle-like structures without clear membrane were also found, here referred to as “other small particles” (see also 4f). (d) Size distribution for 10,000g and 100/200,000g spherical EVs. (e) For both centrifugation conditions occasionally “granular” EVs were observed containing electron-dense granules. (f) Comparison of small EVs (with clear membrane; typically 20–40 nm) with “other small particles” (lacking a clear membrane; typically <20 nm) generally found in all images.
Quantification of CD44+ EVs from healthy SF and the impact of HYase treatment
Next, the impact of HYase treatment on the identification of specific EV subsets from SF was studied by exploring the detection of CD44+ EVs. CD44 is expressed by various cell types (Citation35), including primary fibroblast-like synoviocytes in the synovial membrane (Supplementary Fig. 3). In healthy joints these fibroblasts are the candidate cell type for the production and release of EVs into the SF. Furthermore, CD44 is the HA receptor and – if present on EVs in SF – could be involved in binding to full-length HA in the extracellular matrix. Therefore, degradation of the extracellular matrix by HYase might be beneficial for the recovery of CD44+ EVs. Indeed, CD44 was detected by Western blotting on 10,000g and 100,000g EVs from the HYase-treated samples, whereas for the non-treated samples CD44+ EVs were only present in the 100,000g samples (Supplementary Fig. 2c). Since Western blotting does not allow single EV analysis, individual CD44+ EVs were quantified by single-EV-based high-resolution FCM ( and ). CD44+ EVs were detected in all centrifugation steps, with an increased yield for the HYase-treated samples when centrifuged at 10,000g (p<0.05) and 100,000g (p<0.01) ( and b). To get more insight into the distribution of the CD44+ EVs throughout the density gradients, the CD44+ population of EVs was compared to the total population of EVs (PKH67+) (). Remarkably, the distribution of CD44+ EVs in the density gradient fractions did not fully correlate with the distribution of the total EV population; CD44+ EVs tend to float at a higher density than the bulk of EVs in the gradient ().
Fig. 5. High-resolution FCM of SF-derived EVs; detection of CD44+/PKH67+ EVs. EVs were isolated from HYase-treated or non-treated healthy SF, labelled with PKH67 and anti-CD44 antibody (PE-conj.) floated in OptiPrep gradients and analysed using high-resolution FCM. Scatter plots for the subsequent 10,000g, 100,000g, and 200,000g ultracentrifugation steps are shown for gradient fractions F3–F6 corresponding to Fig. 2b. Percentages of CD44+ events and absolute CD44+ numbers measured per 30 s were determined using a square gate based on the isotype control (pool of 100,000g and 200,000g EVS, labelled with PKH67 and CD44-PE isotype antibody).
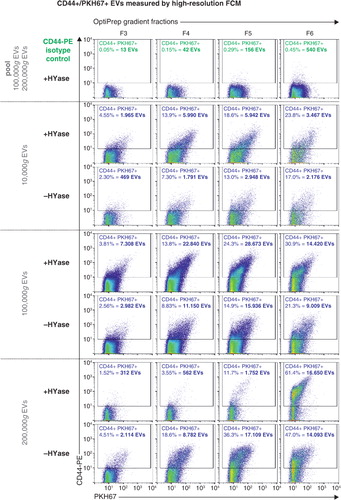
Fig. 6. (a) Comparison of PKH67+ EVs (black/grey bars) (data from Fig. 2) and CD44+/PKH67+ EVs (blue bars) (data from Fig. 5) measured by high-resolution FCM for the conditions +HYase and −HYase. (b) Ratio of CD44+ EVs relative to total EVs. The p-values indicate significantly higher total yield in the HYase-treated samples in the 10,000g and 100,000g centrifugation steps (paired analysis). Bars represent mean (n=2); error bars represent minimum and maximum observed values.
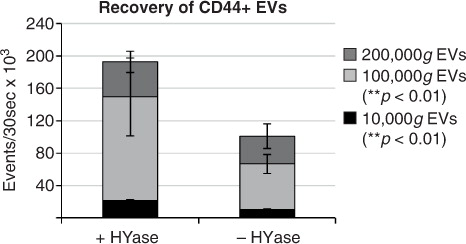
In general, centrifugation at 100,000g contributes mostly to the recovery of CD44+ EVs. Finally, the cumulative counts of CD44+ EVs in all centrifugation steps (sum of event rates for 10,000g EVs+100,000g EVs+200,000g EVs present in gradient fractions F2–F7) clearly demonstrates a significantly less efficient recovery of these EVs in the 10,000g and 100,000g centrifugation steps (p<0.01) in the absence of HYase treatment ().
Fig. 7. Cumulative yield of CD44+ EVs in all ultracentrifugation steps (sum of event rates for 10,000g EVs+100,000g EVs+200,000g EVs present in gradient fractions F2–F7) in HYase-treated and non-treated samples. Bars represent mean (n=2); error bars represent minimum and maximum observed values. The p-values indicate significant higher recovery of CD44+ EVs in HYase-treated samples in the 10,000g and 100,000g centrifugation step.
Discussion
For developing a tailor-made protocol for EV isolation from SF, previously published reports were first evaluated to determine which protocols to date have been used for EV isolation from SF and to survey which important technical steps should be considered for a standardized protocol. Of 18 articles published between 1995 and 2016 reporting EV isolation from SF (Table ) (Citation2–Citation19), 17 involved samples from human patients with joint disease. Only one study investigated healthy SF (of rat, canine, and equine origin) (Citation14). In 6 publications, samples were pretreated with anticoagulant and in 2 publications enzyme treatment with HYase prior to ultracentrifugation was reported. In most cases, EVs were pelleted with maximally 20,500g. In only 4 publications were EVs pelleted at ≥100,000g. Strikingly, there was only a single publication in which EVs were purified by floating in density gradients. In all other studies, fresh SF or the total ultracentrifugation pellets – both cleared from large particles, but contaminated with other non-vesicular macromolecular structures in addition to EVs – were used for analysis of SF-derived EVs.
Our protocol considered the earlier published work, but was more comprehensive and included density gradient floatation, as it was designed to meet the recently published minimal requirements for functional EV studies (Citation31). Importantly, apart from the 10,000g and 100,000g pelleting steps, which are centrifugation forces most often used in the field to isolate EVs from body fluids, an additional 200,000g pelleting step was included to isolate EVs from SF, as this is a very viscous body fluid. Because the SF samples for this study were taken from healthy joints without blood contamination, anticoagulant treatment was not included. In contrast, HYase treatment appeared to be an important step in our protocol, due to the high concentration of high-molecular-weight HA in SF (Citation26, Citation27). HA is a non-sulphated glycosaminoglycan and the most prominent component of the extracellular matrix of SF (Citation27). Because CD44 is an HA receptor and present on synovial fibroblasts, considered to be important EV producers in SF, we evaluated the recovery of CD44+ EVs in the absence or presence of HYase treatment.
We here showed that enzymatic digestion of the large HA chains with HYase is beneficial for the isolation of CD44 (HA receptor) positive EVs from SF. Only after HYase treatment could the CD44+ EVs be efficiently isolated, mainly after 100,000g ultracentrifugation. Although the recovery of total EVs (PKH67+) was not significantly affected when omitting HYase treatment, significantly less CD44+ EVs were recovered. Very recently the presence of HA-coated EVs was detected in SF (Citation19). One possible explanation for the lower detection of CD44+ EVs in the absence of HYase treatment in our study could be masking of antibody detection due to HA binding. However, because the epitope of the anti-CD44 antibody (IM7 clone) used for CD44+ EV detection is located outside the HA binding domain of CD44 (Citation36), antibody shielding or steric hindrance of antibody binding is less likely the cause of lack of detection. We therefore conclude that the lower yield of CD44+ EVs from non-HYase-treated samples is most likely due to the formation of complexes of these EVs with the large chains of non-degraded HA in SF and that HYase degrades HA and liberates EVs that are bound via CD44, resulting in increased EV yields. Nevertheless, if steric hindrance of antibody binding by HA did take place on EVs, it could also hamper other antibody-based detection assays, making HYase treatment indispensable.
Based on our data, we propose HYase incubation of SF preceding EV isolation for efficient recovery of CD44+ EVs. However, it should be noted that possible effects of HYase treatment should be evaluated on further downstream processing and analysis steps, for example, (micro)RNA analysis. For protein and lipid analysis, problems due to HYase are not expected, since general biomarker analysis of fresh SF is routinely preceded by HYase treatment.
The fact that most EVs were intact and no debris of damaged EVs was observed by cryo-TEM indicates that these EVs can withstand the high centrifugation forces used in our protocol (>100,000g). Nevertheless, the possibility of (functional) loss due to centrifugation and floatation procedures cannot be ruled out, which is important for future research aiming at functional testing of these EVs. Cryo-TEM analysis of EVs from healthy SF, isolated with 10,000g or 100/200,000g, followed by a sucrose density gradient, revealed a heterogeneous pool of particles with shapes comparable to findings in other body fluids (Citation24, Citation30) (Citation37, Citation38). For SF, differential centrifugation steps did not separate EVs based on morphology, nor on size, although size distribution of spherical EVs did show a tendency for EVs >100 nm to be recovered at 10,000g (compared to 100/200,000g). The finding that 92–98% of EVs in our study had diameters between 20 and 200 nm is considerably different from the larger particles (up to 400 nm) detected in SF from patients with inflammatory joint disease (Citation6, Citation9) (Citation10, Citation19). These differences could be caused by differences in the methodology used to isolate EVs, for example, centrifugation protocols and density gradients. Alternatively, it might indicate that during disease different EV populations are present in the joint.
Recent data indicate that particular EV types (e.g. platelet-derived EVs present in blood plasma) have the tendency to aggregate due to ultracentrifugation, which can lead to false interpretation of particle size and marker analysis (Citation39, Citation40). However, we have shown here that for SF-derived EVs from healthy joints, clusters of EVs were rarely observed by cryo-TEM analysis, indicating that even 200,000g pelleting did not induce major aggregation artefacts. In addition to very small EVs (20–40 nm), other small particles (typically ≤20 nm) were observed. These structures differed from EVs by not having a clear membrane and usually having a darker and more homogenous core compared to the slightly larger EVs. Possibly, these very small particles could be lipoproteins, resembling cryo-EM preparations of very low density lipoprotein (VLDL) particles from blood (Citation38, Citation41) or ice-crystal artefacts, as has been observed in ejaculates (Citation37).
EVs isolated from healthy equine SF were positive for CD9, Annexin-1, CD90/Thy1.1, and CD44. Whereas CD9 is a common marker for EVs, Annexin-1 has so far – in relation to the joint – been known only as a pro-resolving anti-inflammatory marker on EVs in the inflammatory joints of patients with joint disease (Citation11). The current data show that Annexin-1 is also present on EVs in healthy SF, although at relatively low abundance. These Annexin-1+ EVs may be derived from the few circulating immune cells present in healthy SF. For the bulk of SF-derived EVs, however, a synoviocytic origin is more likely, because markers found on these EVs, for example, CD90/Thy1.1 and CD44, are also highly expressed on primary fibroblast-like synoviocytes.
The interaction between HA and CD44+ EVs in SF might be of functional interest during joint disease. Because the concentration and chain length of HA is dependent on the disease state of the joint (Citation27), the interaction (or the lack thereof) between CD44+ EVs and HA in the extracellular matrix might be altered when joint homeostasis is disturbed. This could have its functional effect by changing the freedom of movement of CD44+ EVs in the joint space and thus changing the efficiency of interaction with target cells in the synovial membrane or the cartilage. CD44+ EVs could also, by binding free HA chains, serve as transport vehicles for HA between cells and might facilitate its efficient delivery to target cells. In vitro studies have shown that when HA is delivered to CD44-expressing cells, the HA–CD44 interaction on these cells results in an anabolic (and anti-inflammatory) cascade by inhibiting TNF-α- or IL-1β-induced matrix metalloproteinase (MMP) production and aggrecanase expression in chondrocytes and synovial cells, explaining the mechanism of action during HA therapy in arthritis (Citation42). Furthermore, triggering of fibroblast-like synoviocytes with HA evokes the production of more HA, dependent on the type of HA used (Citation26, Citation43). Finally, cell types with active HA synthesis (for the joint these are fibroblast-like synoviocytes and chondrocytes) contain an “HA coat” on protrusions of their plasma membrane (Citation44). CD44+ EVs could use these high-affinity HA-coated areas to anchor to cells for further EV uptake or interaction.
While the importance of CD44-dependent EV interaction with HA has already been established in HA-related pathologies, such as cancer progression (Citation45), clarifying the role of EV-associated CD44 in healthy and diseased joints needs to be further substantiated since CD44 is not only a HA receptor, but also an important signalling molecule in various cell types (Citation35). With respect to the CD44–HA interaction on EVs, it is important to note that only specific forms of HA actively bind to CD44 (Citation27). The exact interaction and timing of this event during joint homeostasis, or the disturbance thereof, should be further investigated. Insight into this interaction could also be of importance for potential clinical applications, such as the incorporation of CD44+ EVs or liposomes (loaded with pharmaceuticals) into HA-rich scaffolds for local controlled release of treatment during joint regeneration (Citation1).
Ultimately, the CD44+ EV population in SF is likely an important functional EV subset, which might have distinct functions in healthy and diseased joints. Although infiltration of interstitial fluids into the SF during inflammation results in lower viscosity of the fluid, the HYase step needs to be taken into consideration for inflammatory SF as well, because increased production of low-molecular-weight HA during inflammation might provoke even more trapping of CD44+ EVs into the extracellular matrix (Citation27). In addition, for other HA-containing body fluids, such as pleural fluid, peritoneal fluid, and blood (Citation46, Citation47), sedimentation of EVs could be hampered by omitting the HYase step in the EV isolation protocol. This is an important consideration, since systemic accumulation of HA is often a poor prognostic factor in diseases like rheumatoid arthritis (Citation48), osteoarthritis (Citation49), liver disease (Citation50), and many epithelial cancers (Citation51). Hence to unveil the role of EVs in (patho)physiologic processes and to search for disease-specific EV-based biomarkers, the addition of HYase during EV isolation from body fluids might be indispensable to avoid the loss of a potentially important CD44+ EV subset.
Conclusion
To the best of our knowledge, this is the first detailed investigation in which EVs were isolated and analysed from healthy SF samples. In contrast to reports that claim that high-speed centrifugation of body fluids leads to formation of EV aggregates, EV isolation from SF can be performed with high-speed centrifugation up to 200,000g without substantial aggregate formation or damage to EVs. The majority of EVs from SF can be recovered at 100,000g. However, in the absence of HYase treatment a substantial amount of EVs is only recovered after 200,000g, while the CD44+ EV subset is isolated inefficiently. The beneficial effect of HYase treatment on CD44+ EV recovery from SF stresses the importance of tailor-made protocols for EV isolation from different body fluids. For the case of SF, in most EV isolation protocols up to now, neither HYase treatment nor a 200,000g centrifugation step was applied and often only centrifugation forces of maximally 20,500g were used. Based on our findings, this implies that in these studies EVs are possibly recovered suboptimally and specific subsets, such as the CD44+ EVs, might therefore remain unnoticed. The design of a golden standard protocol for isolation of EVs from SF, however, remains difficult due to differences in SF composition between healthy and diseased joints, within different joint diseases, at different disease stages, and possibly between species. Taking into account that not only EV characteristics, but also the matrix composition wherein these EVs are present, determine the g-forces and time necessary for sedimentation, HYase treatment is an attractive option to at least eliminate HA-dependent matrix variations between SF samples and efficiently recover the biologically relevant CD44+ EVs.
Conflict of interest and funding
The authors declare no conflict of interest regarding the content of this article.
Supplementary Figures 1-3
Download PDF (2 MB)Acknowledgements
We thank Johannes Bergmann, a master's student at Utrecht University, for performing the cryo-TEM analysis. This work was supported by a grant from the Dutch government to the Netherlands Institute for Regenerative Medicine (NIRM, grant no. FES0908) (JB) and the Dutch Arthritis Foundation (grant no. LLP-12 and LLP-22) (JM, PRW).
Notes
To access the supplementary material to this article, please see Supplementary files under ‘Article Tools’.
Related Research Data
References
- Malda J, Boere J, van de Lest CH, van Weeren PR, Wauben MH. Extracellular vesicles – new tool for joint repair and regeneration. Nat Rev Rheumatol. 2016; 12: 243–9.
- Berckmans RJ, Nieuwland R, Tak PP, Boing AN, Romijn FP, Kraan MC, etal. Cell-derived microparticles in synovial fluid from inflamed arthritic joints support coagulation exclusively via a factor VII-dependent mechanism. Arthritis Rheum. 2002; 46: 2857–66.
- Berckmans RJ, Nieuwland R, Kraan MC, Schaap MC, Pots D, Smeets TJ, etal. Synovial microparticles from arthritic patients modulate chemokine and cytokine release by synoviocytes. Arthritis Res Ther. 2005; 7: R536–44.
- Biró E, Nieuwland R, Tak PP, Pronk LM, Schaap MC, Sturk A, etal. Activated complement components and complement activator molecules on the surface of cell-derived microparticles in patients with rheumatoid arthritis and healthy individuals. Ann Rheum Dis. 2007; 66: 1085–92.
- Boilard E, Nigrovic PA, Larabee K, Watts GF, Coblyn JS, Weinblatt ME, etal. Platelets amplify inflammation in arthritis via collagen-dependent microparticle production. Science. 2010; 327: 580–3.
- Cloutier N, Tan S, Boudreau LH, Cramb C, Subbaiah R, Lahey L, etal. The exposure of autoantigens by microparticles underlies the formation of potent inflammatory components: the microparticle-associated immune complexes. EMBO Mol Med. 2013; 5: 235–49.
- Duchez AC, Boudreau LH, Bollinger J, Belleannee C, Cloutier N, Laffont B, etal. Platelet microparticles are internalized in neutrophils via the concerted activity of 12-lipoxygenase and secreted phospholipase A2-IIA. Proc Natl Acad Sci USA. 2015; 112: E3564–73.
- Fourcade O, Simon MF, Viode C, Rugani N, Leballe F, Ragab A, etal. Secretory phospholipase A2 generates the novel lipid mediator lysophosphatidic acid in membrane microvesicles shed from activated cells. Cell. 1995; 80: 919–27.
- György B, Szabo TG, Turiak L, Wright M, Herczeg P, Ledeczi Z, etal. Improved flow cytometric assessment reveals distinct microvesicle (cell-derived microparticle) signatures in joint diseases. PLoS One. 2012; 7: e49726.
- György B, Modos K, Pallinger E, Paloczi K, Pasztoi M, Misjak P, etal. Detection and isolation of cell-derived microparticles are compromised by protein complexes resulting from shared biophysical parameters. Blood. 2011; 117: e39–48.
- Headland SE, Jones HR, Norling LV, Kim A, Souza PR, Corsiero E, etal. Neutrophil-derived microvesicles enter cartilage and protect the joint in inflammatory arthritis. Sci Transl Med. 2015; 7: 315ra190.
- Junkar I, Sustar V, Frank M, Jansa V, Zavec A, Rozman B, etal. Blood and synovial microparticles as revealed by atomic force and scanning electron microscope. Open Autoimmun J. 2009; 1: 50–8.
- Martínez-Lorenzo MJ, Anel A, Saez-Gutierrez B, Royo-Canas M, Bosque A, Alava MA, etal. Rheumatoid synovial fluid T cells are sensitive to APO2L/TRAIL. Clin Immunol. 2007; 122: 28–40.
- Matei CI, Boulocher C, Boule C, Schramme M, Viguier E, Roger T, etal. Ultrastructural analysis of healthy synovial fluids in three mammalian species. Microsc Microanal. 2014; 20: 903–11.
- Messer L, Alsaleh G, Freyssinet J, Zobairi F, Leray I, Gottenberg J, etal. Microparticle-induced release of B-lymphocyte regulators by rheumatoid synoviocytes. Arthritis Res Ther. 2009; 11: R40.
- Pásztói M, Sodar B, Misjak P, Paloczi K, Kittel A, Toth K, etal. The recently identified hexosaminidase D enzyme substantially contributes to the elevated hexosaminidase activity in rheumatoid arthritis. Immunol Lett. 2013; 149: 71–6.
- Reich N, Beyer C, Gelse K, Akhmetshina A, Dees C, Zwerina J, etal. Microparticles stimulate angiogenesis by inducing ELR(+) CXC-chemokines in synovial fibroblasts. J Cell Mol Med. 2011; 15: 756–62.
- Skriner K, Adolph K, Jungblut PR, Burmester GR. Association of citrullinated proteins with synovial exosomes. Arthritis Rheum. 2006; 54: 3809–14.
- Mustonen AM, Nieminen P, Joukainen A, Jaroma A, Kaariainen T, Kroger H, etal. First in vivo detection and characterization of hyaluronan-coated extracellular vesicles in human synovial fluid. J Orthop Res. 2016. doi: http://dx.doi.org/10.1002/jor.23212.
- Malda J, Benders KE, Klein TJ, de Grauw JC, Kik MJ, Hutmacher DW, etal. Comparative study of depth-dependent characteristics of equine and human osteochondral tissue from the medial and lateral femoral condyles. Osteoarthr Cartil. 2012; 20: 1147–51.
- Hurtig MB, Buschmann MD, Fortier LA, Hoemann CD, Hunziker EB, Jurvelin JS, etal. Preclinical studies for cartilage repair: recommendations from the International Cartilage Repair Society. Cartilage. 2011; 2: 137–52.
- McIlwraith CW, Frisbie DD, Kawcak CE. The horse as a model of naturally occurring osteoarthritis. Bone Joint Res. 2012; 1: 297–309.
- Witwer KW, Buzas EI, Bemis LT, Bora A, Lasser C, Lotvall J, etal. Standardization of sample collection, isolation and analysis methods in extracellular vesicle research. J Extracell Vesicles. 2013; 2: 20360,. doi: http://dx.doi.org/10.3402/jev.v2i0.20360. eCollection 2013.
- Zonneveld MI, Brisson AR, van Herwijnen MJ, Tan S, van de Lest CH, Redegeld FA, etal. Recovery of extracellular vesicles from human breast milk is influenced by sample collection and vesicle isolation procedures. J Extracell Vesicles. 2014; 3: 24215,. doi: http://dx.doi.org/10.3402/jev.v3.24215. eCollection 2014.
- Lacroix R, Judicone C, Mooberry M, Boucekine M, Key NS, Dignat-George F, etal. Standardization of pre-analytical variables in plasma microparticle determination: results of the International Society on Thrombosis and Haemostasis SSC Collaborative workshop. J Thromb Haemost. 2013. doi: http://dx.doi.org/10.1111/jth.12207.
- Dahl LB, Dahl IM, Engstrom-Laurent A, Granath K. Concentration and molecular weight of sodium hyaluronate in synovial fluid from patients with rheumatoid arthritis and other arthropathies. Ann Rheum Dis. 1985; 44: 817–22.
- Murai T. Lipid raft-mediated regulation of hyaluronan-CD44 interactions in inflammation and cancer. Front Immunol. 2015; 6: 420.
- Nolte-‘t Hoen EN, van der Vlist EJ, Aalberts M, Mertens HC, Bosch BJ, Bartelink W, etal. Quantitative and qualitative flow cytometric analysis of nanosized cell-derived membrane vesicles. Nanomedicine. 2012; 8: 712–20.
- van der Vlist EJ, Nolte-‘t Hoen EN, Stoorvogel W, Arkesteijn GJ, Wauben MH. Fluorescent labeling of nano-sized vesicles released by cells and subsequent quantitative and qualitative analysis by high-resolution flow cytometry. Nat Protoc. 2012; 7: 1311–26.
- Arraud N, Linares R, Tan S, Gounou C, Pasquet JM, Mornet S, etal. Extracellular vesicles from blood plasma: determination of their morphology, size, phenotype and concentration. J Thromb Haemost. 2014; 12: 614–27.
- Lotvall J, Hill AF, Hochberg F, Buzas EI, Di Vizio D, Gardiner C, etal. Minimal experimental requirements for definition of extracellular vesicles and their functions: a position statement from the International Society for Extracellular Vesicles. J Extracell Vesicles. 2014; 3: 26913,. doi: http://dx.doi.org/10.3402/jev.v3.26913.
- Graham JM. OptiPrep density gradient solutions for nonmammalian organelles. Sci World J. 2002; 2: 1444–8.
- Kormelink TG, Arkesteijn GJ, Nauwelaers FA, van den Engh G, Nolte-‘t Hoen EN, Wauben MH. Prerequisites for the analysis and sorting of extracellular vesicle subpopulations by high-resolution flow cytometry. Cytometry A. 2016; 89: 135–47.
- Bartok B, Firestein GS. Fibroblast-like synoviocytes: key effector cells in rheumatoid arthritis. Immunol Rev. 2010; 233: 233–55.
- Ponta H, Sherman L, Herrlich PA. CD44: from adhesion molecules to signalling regulators. Nat Rev Mol Cell Biol. 2003; 4: 33–45.
- Mikecz K, Dennis K, Shi M, Kim JH. Modulation of hyaluronan receptor (CD44) function in vivo in a murine model of rheumatoid arthritis. Arthritis Rheum. 1999; 42: 659–68.
- Hoog JL, Lotvall J. Diversity of extracellular vesicles in human ejaculates revealed by cryo-electron microscopy. J Extracell Vesicles. 2015; 4: 28680,. doi: http://dx.doi.org/10.3402/jev.v4.28680.
- Yuana Y, Koning RI, Kuil ME, Rensen PC, Koster AJ, Bertina RM, etal. Cryo-electron microscopy of extracellular vesicles in fresh plasma. J Extracell Vesicles. 2013; 2: 21494,. doi: http://dx.doi.org/10.3402/jev.v2i0.21494. eCollection 2013 Dec 31.
- Linares R, Tan S, Gounou C, Arraud N, Brisson AR. High-speed centrifugation induces aggregation of extracellular vesicles. J Extracell Vesicles. 2015; 4: 29509,. doi: http://dx.doi.org/10.3402/jev.v4.29509.
- Yuana Y, Boing AN, Grootemaat AE, van der Pol E, Hau CM, Cizmar P, etal. Handling and storage of human body fluids for analysis of extracellular vesicles. J Extracell Vesicles. 2015; 4: 29260,. doi: http://dx.doi.org/10.3402/jev.v4.29260.
- van Antwerpen R, La Belle M, Navratilova E, Krauss RM. Structural heterogeneity of apoB-containing serum lipoproteins visualized using cryo-electron microscopy. J Lipid Res. 1999; 40: 1827–36.
- Masuko K, Murata M, Yudoh K, Kato T, Nakamura H. Anti-inflammatory effects of hyaluronan in arthritis therapy: not just for viscosity. Int J Gen Med. 2009; 2: 77–81.
- Smith MM, Ghosh P. The synthesis of hyaluronic acid by human synovial fibroblasts is influenced by the nature of the hyaluronate in the extracellular environment. Rheumatol Int. 1987; 7: 113–22.
- Rilla K, Tiihonen R, Kultti A, Tammi M, Tammi R. Pericellular hyaluronan coat visualized in live cells with a fluorescent probe is scaffolded by plasma membrane protrusions. J Histochem Cytochem. 2008; 56: 901–10.
- Mu W, Rana S, Zoller M. Host matrix modulation by tumor exosomes promotes motility and invasiveness. Neoplasia. 2013; 15: 875–87.
- Choi DS, Park JO, Jang SC, Yoon YJ, Jung JW, Choi DY, etal. Proteomic analysis of microvesicles derived from human colorectal cancer ascites. Proteomics. 2011; 11: 2745–51.
- Park JO, Choi DY, Choi DS, Kim HJ, Kang JW, Jung JH, etal. Identification and characterization of proteins isolated from microvesicles derived from human lung cancer pleural effusions. Proteomics. 2013; 13: 2125–34.
- Majeed M, McQueen F, Yeoman S, McLean L. Relationship between serum hyaluronic acid level and disease activity in early rheumatoid arthritis. Ann Rheum Dis. 2004; 63: 1166–8.
- Turan Y, Bal S, Gurgan A, Topac H, Koseoglu M. Serum hyaluronan levels in patients with knee osteoarthritis. Clin Rheumatol. 2007; 26: 1293–8.
- Wyatt HA, Dhawan A, Cheeseman P, Mieli-Vergani G, Price JF. Serum hyaluronic acid concentrations are increased in cystic fibrosis patients with liver disease. Arch Dis Child. 2002; 86: 190–3.
- Peng C, Wallwiener M, Rudolph A, Cuk K, Eilber U, Celik M, etal. Plasma hyaluronic acid level as a prognostic and monitoring marker of metastatic breast cancer. Int J Cancer. 2016; 138: 2499–509.