
Abstract
Extracellular vesicles (EVs), including exosomes and microvesicles (MVs), are explored for use in diagnostics, therapeutics and drug delivery. However, little is known about the relationship of protein and lipid composition of EVs and their source cells. Here, we report high-resolution lipidomic and proteomic analyses of exosomes and MVs derived by differential ultracentrifugation from 3 different cell types: U87 glioblastoma cells, Huh7 hepatocellular carcinoma cells and human bone marrow-derived mesenchymal stem cells (MSCs). We identified 3,532 proteins and 1,961 lipid species in the screen. Exosomes differed from MVs in several different areas: (a) The protein patterns of exosomes were more likely different from their cells of origin than were the protein patterns of MVs; (b) The proteomes of U87 and Huh7 exosomes were similar to each other but different from the proteomes of MSC exosomes, whereas the lipidomes of Huh7 and MSC exosomes were similar to each other but different from the lipidomes of U87 exosomes; (c) exosomes exhibited proteins of extracellular matrix, heparin-binding, receptors, immune response and cell adhesion functions, whereas MVs were enriched in endoplasmic reticulum, proteasome and mitochondrial proteins. Exosomes and MVs also differed in their types of lipid contents. Enrichment in glycolipids and free fatty acids characterized exosomes, whereas enrichment in ceramides and sphingomyelins characterized MVs. Furthermore, Huh7 and MSC exosomes were specifically enriched in cardiolipins; U87 exosomes were enriched in sphingomyelins. This study comprehensively analyses the protein and lipid composition of exosomes, MVs and source cells in 3 different cell types.
To access the supplementary material to this article, please see Supplementary files under ‘Article Tools’.
Extracellular vesicles (EVs) occur in most bodily fluids and cell culture supernatants. With the advent of parallel sequencing technologies, the RNA content of EVs is being heavily investigated as a new type of diagnostic biomarker (Citation1). The RNA contents of EVs from a variety of bodily fluids, including urine, saliva, blood and cerebrospinal fluid, have been explored as biomarkers for indications throughout the body (Citation2–Citation8). EVs as tumour biomarkers are especially valuable, since bodily fluid EVs provide an alternative to repeated biopsies for continuous monitoring and an option for tumours inaccessible to biopsies (i.e. brain tumours). EVs are also being explored as natural carriers of therapeutic RNAs (Citation9, Citation10). EVs for therapeutic applications are typically derived from mesenchymal stem cells (MSCs), a cell type well characterized for cell-based therapies (Citation10, Citation11).
Two EV subgroups in particular, exosomes and microvesicles (MVs), have the ability to carry biomarkers or therapeutic RNA. Exosomes are small vesicles (traditionally considered 50–150 nm) that originate from endocytic compartments within the cell. During endosome maturation, intraluminal vesicles are formed by endosomal membrane budding inside multivesicular bodies, and intraluminal vesicles become exosomes upon the exocytosis of multivesicular bodies (Citation12). Compared with exosomes, MVs are larger vesicles (traditionally considered 200–1,000 nm) and are formed by budding directly from the plasma membrane (Citation13). Available purification methods include separation based on size [differential ultracentrifugation (Citation14) and ultrafiltration (Citation15)], density [OptiPrep™ (Citation16) and sucrose (Citation17)], floatation velocity (Citation18), immunoaffinity (Citation19) and polyethylene glycol (PEG)-based precipitation (Citation15). These strategies enrich EVs within certain size ranges but are not able to fully separate EV subgroups, resulting in mixed EV populations in the isolates (Citation20). The purification strategy defines the nature of EV subgroup mixture in the isolate, which in turn will determine its biological function and biochemical properties. Furthermore, EV purification strategies can co-isolate non-vesicular extracellular proteins and lipoprotein particles with EVs.
The protein and lipid compositions of EVs from various sources have been studied via biochemical assays and mass spectrometry (Citation21–Citation34) and provide a robust basis for protein biomarker identification in EVs for research quality control purposes. Exosomal isolates commonly contain membrane proteins, specifically tetraspanins, as well as various amounts of extracellular matrix proteins; they are devoid of nuclear proteins (Citation16). Microvesicular isolates may contain proteins of mitochondrial or endoplasmic reticulum origin (Citation16). A detailed understanding of the biochemical (protein and lipid) composition of EV subgroups and the extent to which EV composition reflects source cell composition is necessary for further development into diagnostics and therapeutics. To address this question, we performed a comparative analysis of the protein and lipid composition of 2 EV subgroups and their source cells. We chose a glioblastoma (U87) and a hepatocellular carcinoma (Huh7) cell line, since the EVs of these tumour types are in the focus of interest for diagnostic biomarker development (Citation6, Citation35). We further chose bone marrow-derived MSCs, since this cell type is frequently used for therapeutic vesicle production (Citation10). For EV purification, we sought a strategy that would not introduce bias into the composition of EV isolates (unlike immunoaffinity-based purification), would not co-enrich non-vesicular extracellular proteins (unlike PEG precipitation) (Citation15) and would provide sufficient yield for mass spectrometric measurement. Differential ultracentrifugation is considered the gold standard of EV purification and met the above requirements.
Materials and methods
Preparation of EVs
U87 glioblastoma and Huh7 hepatocellular carcinoma cells were cultured in Dulbecco's modified eagle medium (DMEM) and human bone marrow-derived MSCs (Lonza) in MSC basal medium (Lonza). Before EV purifications, cells were incubated with EV-depleted medium for 3–4 days (medium was centrifuged overnight at 100,000g to pellet out vesicles). A volume of 360-mL conditioned medium was collected from the culture of approximately 80% confluency and EVs prepared by differential ultracentrifugation (Citation14). Briefly, cell debris was pelleted at 500g. Then, MVs were pelleted at 10,000g (30 min), supernatant filtered through a 0.2-µm membrane (Nalgene® aPES, Thermo Fisher Scientific, Waltham, MA) and exosomes pelleted at 100,000g (90 min). Concentrations and size distribution were measured by Nanoparticle Tracking Analysis (NanoSight NS300, Malvern). Briefly, samples were diluted in phosphate buffered saline (PBS) 1:100–1:1,000, manually injected into the instrument and videos acquired at ambient temperature at camera level 9 for 1 min per sample, and videos processed at threshold level 10. We purified EVs from all 3 source cell types on 6 different days, and used 3 isolates for proteomics and the other 3 isolates for lipidomic analysis. All 6 isolates underwent Nanoparticle Tracking Analysis before being stored at −80°C until further processing for proteomics or lipidomics.
Electron microscopy
The samples and grids for electron microscopy were prepared at room temperature. An equal volume of 4% paraformaldehyde was added to the exosome sample and incubated for 2 h. Three-microlitre aliquots of exosomes were dropped onto grids and incubated in 2% paraformaldehyde for 20 min. The grids were transferred to a wax strip and washed with 100 µl PBS. The grids were incubated in 50 mM glycine/PBS for 5 min and blocked in 5% bovine serum albumin (BSA)/(PBS) for 10 min and washed with 3× PBS followed by incubation in 1% glutaraldehyde for 5 min. Following 8 washes of 2 min with H2O, the grids were incubated for 5 min in uranyl oxalate and in 1% methyl cellulose: 4% uranyl acetate (9:1) for 10 min on ice. Excess liquid was removed with a filter paper, and the grids were air-dried for 5–10 min. Exosomes were examined in a JEOL 1100 transmission electron microscope (JEOL, Peabody, MA) at 60 kV, and images were obtained with an AMT digital camera (Advanced Microscopy Techniques, Woburn, MA).
Western blotting
EV pellets or cell pellets were suspended in radioimmunoprecipitation assay (RIPA) buffer (Pierce® 899000, Thermo Fisher Scientific) containing phenylmenthylsulfonyl fluoride (PMSF) (36978, Thermo Fisher Scientific) and protease inhibitor cocktail (cOmplete Mini, 11836153001, Roche), and samples were sonicated for 15 min. Insoluble material was pelleted by centrifugation for 15 min at 13,000 rpm at 4°C. Supernatants were transferred to a new tube, and protein concentrations measured by Bradford assay. Proteins (50 µg) were loaded and simultaneously analysed on NuPAGE 4–12% Bis-Tris gels (Invitrogen). After transfer to polyvinylidene fluoride (PVDF) (BioRad) membranes, antibody incubation and development was performed using Odyssey® system (Li-Cor) according to manufacturer's instructions. Primary antibodies used were calnexin (Cell Signaling, C5C9), CD9 (Santa Cruz, C4), CD63 (BD Biosciences, H5C6), CD81 (Santa Cruz, B11) and Tsg101 (Abcam, 4A10).
Proteomics
Protein extraction followed the same protocol as for Western blotting. Total protein (100 µg) was applied to an SDS–PAGE. Once the entire protein sample entered the stacking gel, electrophoresis was stopped and the portion of gel containing proteins was excised and stained with Coomassie brilliant blue. The fixed gel fragments were processed by University of Massachusetts Medical School Mass Spectrometry Core. Gel slices were cut into 1×1 mm pieces, placed in 1.5-ml microcentrifuge tubes containing 1-ml water and incubated for 30 min. The water was replaced with 200 µl of 250 mM ammonium bicarbonate and 25 µl of 45 mM dithiothreitol (DTT), and the samples were incubated for 30 min at 50°C. Samples were then cooled to room temperature, and alkylation was performed by adding 25 µl of 100 mM iodoacetamide and incubating for 30 min. The gel slices were washed twice in water, and then incubated in 1 ml of a 50:50 solution of 50 mM ammonium bicarbonate/acetonitrile for 1 h at room temperature. The solution was replaced with 200 µl acetonitrile and incubated until the gel slices turned opaque white. The acetonitrile was removed, and gel slices were further dried in a Speed Vac. Gel slices were rehydrated in a 100-µl solution of 50 mM ammonium bicarbonate containing 0.01% ProteaseMAX Surfactant (Promega) and 2 ng/µl trypsin (Sigma). Additional bicarbonate buffer was added to ensure complete submersion of the gel slices. Samples were incubated for 21 h at 37°C. Supernatants were transferred to a fresh 1.5-ml tube. Gel slices were further dehydrated with 200 µl of an 80:20 solution of acetonitrile/1% formic acid. The extract was combined with the supernatants of each sample. The combined supernatants containing digested proteins were then dried in a Speed Vac, and pellets were redissolved with 25 µl of 5% acetonitrile in 0.1% trifluoroacetic acid. A 3.5-µl aliquot was directly injected onto a custom-packed 2 cm×100 µm C18 Magic 5 µm particle trap column. Peptides were then eluted and sprayed from a custom-packed emitter (75 µm×25 cm C18 Magic 3-µm particle) with a linear gradient from 95% solvent A (0.1% formic acid in water) to 35% solvent B (0.1% formic acid in acetonitrile) at a flow rate of 300 nl per minute for 120 min on a Waters Nano Acquity UPLC system. Data-dependent acquisitions were performed on a Q Exactive mass spectrometer (Thermo Scientific) according to an experiment where full MS scans from 300 to 1,750 m/z were acquired at a resolution of 70,000 followed by 10 MS/MS scans acquired under higher-energy collisional dissociation (HCD) fragmentation at a resolution of 17,500 and an isolation width of 1.6 Da. Raw data files were processed with Proteome Discoverer (version 1.4) before using Mascot Server (version 2.5) to search against the Uniprot_Human protein database. Applied search parameters were fully tryptic with 2 missed cleavages, parent mass tolerances of 10 ppm and fragment mass tolerances of 0.05 Da, and allowed for fixed modification of carbamidomethyl cysteine and variable acetyl-group modifications at the N-termini, for example, pyroglutamate for N-term glutamine and oxidation of methionine. Search results were loaded into the Scaffold Viewer (Proteome Software, Portland, OR) to validate and quantify peptides.
Lipidomics
MV and exosome samples were pelleted at 10,000 and 100,000g, respectively. Pellets were frozen at −80°C and transferred to Berg LLC (Framingham, MA) on dry ice for lipid composition analysis.
Aliquots of each sample were combined with a cocktail of deuterium-labelled and odd chain fatty acid standards. Standards were chosen that represent each lipid class and were at designated concentrations expected to provide the most accurate quantitation of each lipid species. Lipids were extracted with 4 ml of a 1:1 (v/v) solution of chloroform/methanol as previously described (Citation36), using an automated custom sequence routine on a Star Hamilton Robotics system (Hamilton, Reno, NV). Lipid extracts were dried under nitrogen, and pellets were dissolved in 300 µl of a 1:1 (v/v) solution of chloroform/methanol per mg of protein. Samples were flushed with nitrogen and stored at −20°C. For MS analysis, samples were diluted 50-fold in 3:3:3:1 (v/v/v/v) isopropanol/methanol/acetonitrile/water containing 2 mM ammonium acetate to enhance ionization efficiency in positive and negative modes. Electrospray ionization MS was performed on a SCIEX TripleTOF® 5600+ (SCIEX) coupled to a customized direct injection loop system on an Ekspert microLC200 system. Fifty microlitres of sample was injected at a flow rate of 6 µl/min. Lipids were analysed using a customized data independent analysis strategy on the TripleTOF® 5,600+ allowing for MS/MSALL high-resolution and high mass accuracy analysis as previously described (Citation37). Lipids were quantified using an in-house library on MultiQuant™ software.
Analysis
EVs were purified from source cells on 6 independent days, and 3 replicate samples of cells, MVs and exosomes of each source cell type were used for proteomics analysis and the second set of 3 biological replicates of each sample type for lipidomics analysis. Lipidomic analysis additionally included 2 technical replicates of each biological replicate. Label-free quantification of proteins was performed via the iBAQ [intensity-based absolute quantification (Citation38)] method in Scaffold Viewer (Proteome Software). Briefly, precursor ion intensities of peptides matching to each particular protein were divided by the theoretical number of peptides that could be derived from each particular protein by trypsin digestion. Lipidomic quantitation of molecular species and lipid classes were normalized to the protein content of samples.
Since we collected a large data set without any a priori hypothesis, statistical analysis involved several hypothesis-generating methods. First, we compared total protein profiles (individual iBAQ values) and lipid profiles (nmol of lipid species normalized to total protein content) of exosomes, MVs and source cells by pairwise Pearson's correlation in Microsoft Excel and used R2 to characterize the level of similarity between samples. Another statistical method to explore big data derived from several sample types is principal component analysis (PCA). We normalized protein (individual iBAQ values) and lipid (nmol of lipid species normalized to total protein content) profiles of exosomes and MVs to the protein and lipid profile of their source cells and ran PCA in R (“prcomp” command). We also visualized the normalized protein and lipid profiles of exosomes and MVs on heatmaps, which we generated by the “pheatmap” and “heatmap3” packages in R. We also used gene ontology (GO) analysis to annotate biological function to proteins enriched in EVs [DAVID version 6.7 (Citation39, Citation40), NIH].
Results
We sought to characterize the protein and lipid composition of exosomes and MVs and to determine whether the protein and lipid content depends on source cell type. Although it does not provide full separation of MVs and exosomes, differential ultracentrifugation is currently the gold standard method of EV purification (Citation14). Hence, for the purposes of this publication, we will refer to the 10,000g pellet as MVs, and to the 100,000g pellet as exosomes (). We purified exosomes and MVs from the conditioned cell media of U87, Huh7 and MSC (). As expected, exosomes were relatively homogeneous with an average diameter of approximately 135 nm (50–200 nm; a). MVs, however, were more heterogeneous in size (50–600 nm). We then analysed the protein content of EVs and source cells by liquid chromatography followed by tandem mass spectrometry (LC–MS/MS) and the lipid content using an information-independent acquisition method known as MS/MSALL (Citation37). Protein and lipid contents of EVs from each cell type were compared with the total protein and lipid contents of the respective source cell type in downstream analyses ().
Fig. 1. Workflow of EV preparation and mass spectrometry. Mesenchymal stem cells (MSCs), glioblastoma cells (U87) and hepatocellular carcinoma cells (Huh7) were cultured, and EVs prepared on 6 different days by differential ultracentrifugation. Resulting samples (cells, microvesicles and exosomes, altogether 54 samples) were subjected to proteomic (27 samples, LC–MS/MS) and lipidomic (27 samples, MS/MSALL) analyses. Proteins were quantified by the label-free quantification method iBAQ (intensity-based absolute quantification, see details in materials and methods section). Analysis detected 3,531 proteins and 1,961 lipid species (defined by head group identity, length, saturation and number of fatty acid tails) in 22 lipid classes (defined by head group identity). Level of proteins and lipids in exosomes and microvesicles were later normalized to their respective source cells and expressed on a log(2) scale.
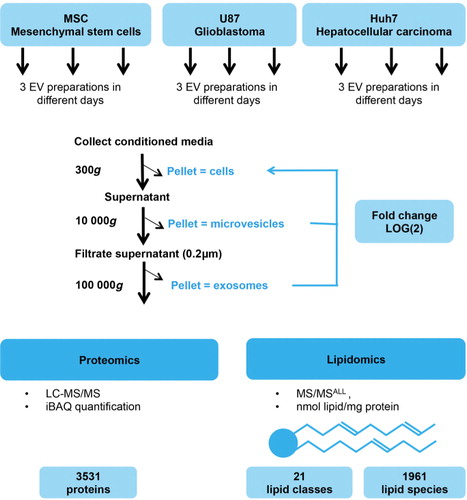
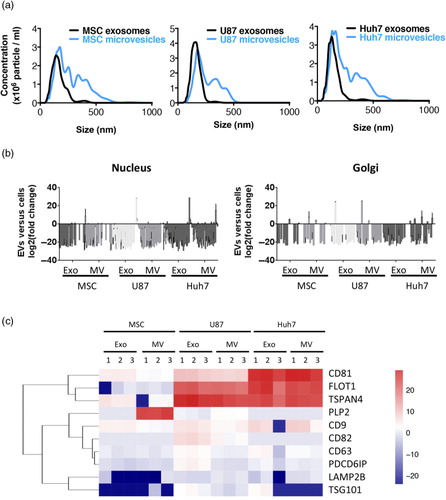
Fig. 2. Quality control of EV preparations. (a) Representative size distribution profiles of EVs from 3 different cell sources as obtained by Nanoparticle Tracking Analysis (NanoSight NS300, Malvern). Microvesicles were more heterogeneous in size independently of cell source. (b) EVs are depleted in proteins of nuclear or Golgi origin. Origin of proteins was identified by Scaffold Proteome Software. (c) Enrichment of exosomal marker proteins in EVs. Fold change of proteins in EVs versus source cells is colour-coded on a log(2) scale. Enrichment of established protein markers in exosomes was source-cell-type-dependent and most exosomal markers were, although to a lower extent, also enriched in microvesicles.
Exosomes differ from microvesicles in protein composition
To assure that we purified bona fide EVs, we confirmed membrane-surrounded vesicular structures in all the EV isolates on EM (Supplementary Fig. 1a) and investigated the presence of known exosomal marker proteins and absence of non-vesicular proteins in our EV preparations. As expected, nuclear and Golgi-resident proteins were few or absent from MVs and exosomes (b), while the ER marker calnexin was absent from exosomes but present in MVs (Supplementary Fig. 1b). Enrichment of EV marker proteins showed significant source cell type dependence. Traditional exosome markers CD81 and CD9 (Citation41) were enriched in both exosomes and MVs, with level of enrichment being higher in exosomes (c and Supplementary Fig. 1b). CD63 enrichment was specific to U87 and Huh7 exosomes, while Tsg101, PDCD6IP (Alix) and CD82 were only enriched in U87 exosomes (c and Supplementary Fig. 1b). Flotillin-1 and tetraspanin-4 were highly enriched in all U87 and Huh7 EVs, while PLP2 enrichment was unique to MSC MVs (c). The immunoblot of individual protein markers corresponded well with label-free quantification of proteomics. Generally, 91% of top EV marker proteins [n=100; ExoCarta (Citation42)] were present in our EV samples (Supplementary Table I).
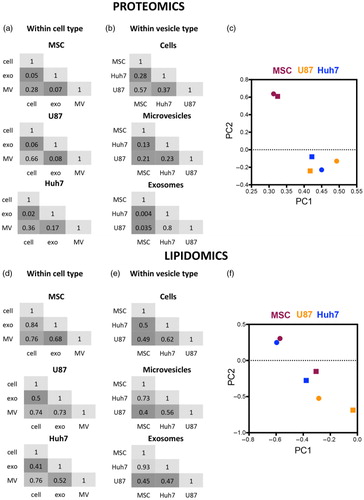
Pairwise Pearson's correlation of protein levels (iBAQ scores) revealed that exosomes were more different from source cells (R2<0.1) than MVs were (R2=0.28–0.66). Exosomes also differed from MVs (R2<0.2) (a). Hence, exosomes and MVs displayed a very different protein profile, despite overlap in their size range (a).
Fig. 3. Protein and lipid sorting into EVs are not linked. Pairwise Pearson's correlations of protein and lipid levels in cells, microvesicles and exosomes derived form 3 source cell types. Numbers represent R2. (a) Microvesicular proteome was more similar to the source cell than the exosomal proteome was in all 3 cell types investigated. (b) Cancer cell-derived proteomes (U87 and Huh7) were increasingly similar to each other and increasingly different from stem cell proteome (MSC) while moving from cells towards microvesicles and exosomes. (c) Principal component analysis of protein levels in exosomes (round) and microvesicles (square) normalized to their respective source cell. MSC-derived exosomes and microvesicles segregate from cancer cell EVs. (d) Lipidomes of exosomes, microvesicles and source cells are more similar to each other than their proteomes are. (e) Huh7 and MSC lipidomes showed increasing levels of similarity moving from source cells to microvesicles to exosomes. (f) Principal component analysis of lipid levels in exosomes (round) and microvesicles (square) normalized to their respective source cell. MSC- and Huh7-derived EVs increasingly cluster together and segregate from U87 moving from microvesicles to exosomes.
Exosomal proteomes effectively distinguish between cancer origin and MSC origin
Huh7 and U87 exosomes had similar protein compositions (R2=0.8), despite poor correlations between MV (R2=0.23) and source cell (R2=0.37) protein levels (b). These data suggested that exosomal proteome was similar between source cell types, whereas MV proteome differed between source cell types. However, MSC exosomes markedly differed from U87 and Huh7 exosomes (R2=0.035 and 0.004). Furthermore, this contrast could not be explained by the difference in source cell protein compositions (MSC to U87, R2=0.57 and MSC to Huh7, R2=0.28). To look at cell type-specific protein enrichment in EVs, we normalized EV protein levels (iBAQ scores) to their respective source cell type's protein levels. Then, we used PCA to determine whether source cell type affected, which proteins were enriched in EVs. Indeed, MSC-derived exosomes and MVs clustered very close together and clearly segregated from U87 and Huh7 vesicles (c).
Over-represented protein pathways depend on vesicle type
To compare functional content of exosomes and MVs, we conducted GO analysis on the list of 719 proteins present in exosomes from all 3 cell types and the 1,357 proteins present in MVs from all 3 cell types using DAVID version 6.7 (Citation39, Citation40) (NIH) (a). GO is a knowledgebase, where genes are assigned to molecular functions, cellular components or biological processes (GO terms). GO analysis tests whether the representation of GO terms in a specific set of genes could be explained by random chance or does it enrich for certain GO terms. We found that exosomes and MVs were both enriched in vesicle proteins, membrane-associated proteins and GTPases (Citation20) (b). Both exosomes and MVs were also enriched for translation and glycolysis pathways.
Fig. 4. Over-represented protein pathways depend on vesicle type. (a) Venn diagrams of detected proteins in exosomes and microvesicles of 3 different source cell types. MSC EVs had a lower diversity of proteins. (b) Proteins shared among exosomes or microvesicles derived from all 3 source cell types (middle section in the Venn diagrams) underwent gene ontology analysis. The negative logarithm of p-values is shown for each GO term, colourful lines represent significance threshold (p=0.05). Common (depicted in black), as well as distinct (depicted in colour) pathways emerged in exosomes versus microvesicles.
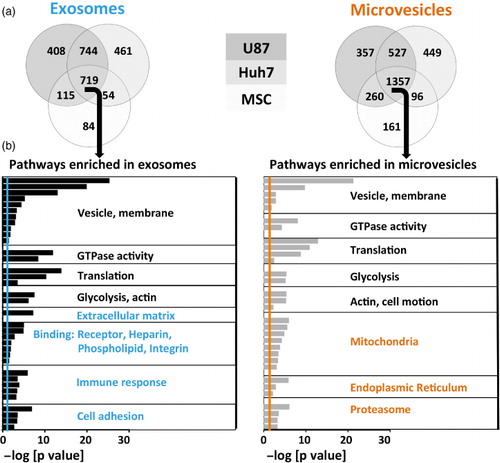
Meanwhile, certain GO terms were differentially enriched in exosomes and MVs. Extracellular matrix, receptors, heparin-binding, phospholipid-binding, integrin, immune response and cell adhesion functions were characteristic for exosomes, whereas mitochondrial, endoplasmic reticulum and proteasomal functions were exclusive to MVs (b).
To examine how cell type influences protein enrichment in EVs, we normalized EV protein content (iBAQ values) to the respective source cell protein content and performed unsupervised cluster analysis, which revealed 9 clusters described in and Supplementary Table II.
Fig. 5. Heatmap of all protein levels in EVs normalized to their respective source cells. iBAQ values of proteins in EVs were normalized to the corresponding protein levels in source cells, expressed on a log(2) scale and colour-coded. Depletion is depicted in blue and enrichment in red. Clusters from heatmap underwent gene ontology analysis, and terms significantly enriched are shown on the right. TM, transmembrane; ECM, extracellular matrix; ER, endoplasmic reticulum; CAM, cell adhesion molecule; VLDL, very low density lipoprotein; diS, disulphide.
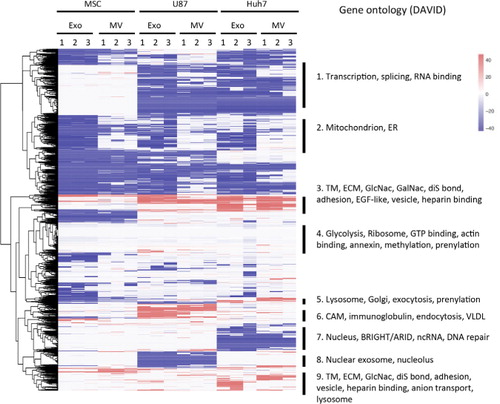
Clusters 1, 7 and 8
Proteins in clusters 1,7 and 8 were depleted from vesicles of U87 cells, Huh7 cells, or both, and absent in all MSC samples. These clusters comprised nuclear proteins, consistent with quality control experiments showing the depletion of nuclear proteins (b).
Cluster 2
Proteins in cluster 2 were depleted from exosomes but not from MVs. This cluster consisted of proteins that function in mitochondria or endoplasmic reticulum, consistent with the MV-specific GO terms we identified in and with an analysis of the relative abundance of endoplasmic reticulum and mitochondrial marker proteins (Supplementary Fig. 2).
Clusters 3 and 9
Proteins in clusters 3 and 9 were enriched or unchanged in EVs regardless of cell type or vesicle type. These clusters consisted of membrane proteins, vesicular proteins, extracellular matrix, heparin-binding, cell adhesion pathways. Furthermore, GO analysis detected enrichment in certain protein motifs (e.g. epidermal growth factor (EGF)-like domain) and post-translational modifications (e.g. disulphide bonds and glycosylation), consistent with the enrichment of membrane proteins. We did not observe an enrichment of proteins known to be palmitoylated, a posttranscriptional modification that has been shown to direct protein accumulation in exosomes (Citation43).
Clusters 5 and 6
Proteins in clusters 5 and 6 were enriched in vesicles of Huh7 (cluster 5) or U87 (cluster 6) cells. Huh7-specific cluster 5 consisted of proteins involved in exocytosis, whereas U87-specific cluster 6 included endocytosis pathway proteins. These observations show source cell-dependent EV content, which may suggest source cell-dependent exosome production and maturation mechanisms. When focusing on 2 protein classes, vesicular trafficking regulator Rabs (Supplementary Fig. 3) and EV organotropism regulator integrins (Citation44) (Supplementary Fig. 4), source cell influence on EV content was particularly clear. Endocytotic Rab34 and Rab23 were highly enriched in U87 exosomes, retrograde transport Rab9 and Rab6 were enriched in Huh7 exosomes, and exocytotic Rab27 was enriched in MSC exosomes (Supplementary Fig. 3). While integrin β3 was enriched in all EVs except Huh7 MVs, integrins α2b [indicated in lung-tropism (Citation44)] and α6 were specific to MSC EVs, integrins α1, α2 and α5 were characteristic to Huh7 EVs, and integrins α3, α7, αV [liver-tropic (Citation44)], β1 [lung-tropic (Citation44)] and β5 [liver-tropic (Citation44)] were characteristic to U87 EVs (Supplementary Fig. 4).
Lipid and protein enrichment in EVs are not linked
MS/MSALL analysis identified 22 lipid classes (defined by head group) and almost 2,000 lipid species (defined by head group, fatty acid tail length and saturation) across all samples. Lipid content was more similar between samples (R2=0.41–0.93) than was protein content (R2=0.004–0.66) (d and e). Surprisingly, lipid enrichment in EVs did not follow the pattern of protein enrichment we observed earlier (a–c): lipid content of U87 and Huh7 exosomes was different (R2=0.47), despite their protein content being very similar (R2=0.8) (b and e). Instead, lipid composition of Huh7 and MSC exosomes showed striking similarity (R2=0.93). This similarity was present, although less pronounced, between Huh7 and MSC MVs as well (R2=0.73; e). Again, similarity in lipid profiles did not correlate with difference in protein profiles of Huh7 and MSC exosomes (R2=0.004), or MVs (R2=0.13) (b). High degree of similarity between Huh7 and MSC exosomes could not be explained by source cell lipid profiles either (e; R2=0.5). When lipid levels in EVs were normalized to their respective source cells and underwent PCA, Huh7 and MSC exosomes clustered very close to each other and segregated from U87 vesicles (f). Huh7 and MSC MVs showed a less clear segregation from U87 EVs. Taken together, certain source cells differing in protein and lipid composition enriched the same proteins but not the same lipids (U87 and Huh7), and yet other source cells enriched the same lipids but not the same proteins (Huh7 and MSC) in their EVs. These data suggested that protein and lipid enrichment mechanisms were not linked.
Next we asked, whether Huh7 and MSC shared characteristics that could possibly relate to their similar exosomal lipid composition. We observed that Huh7 and MSC yielded significantly fewer and smaller exosomes (73 /cell and 36 /cell, 129±14 and 131±12 nm, respectively) than U87 cells (1,382 /cell, 148±8 nm).
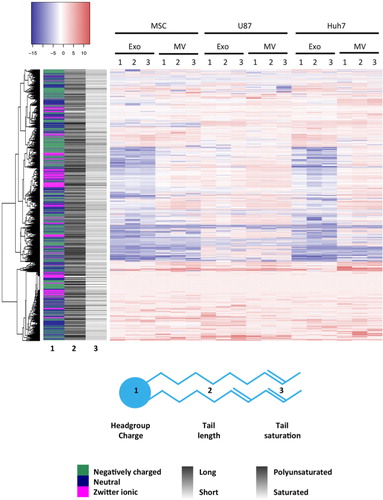
Lipid enrichment in EVs correlates with head group charge, tail length and saturation
The concentration of the 1,961 detected lipid species (defined by head group, number, length and saturation of fatty acid tails) in EVs was normalized to respective source cell lipidome. Colour coding of enrichment (red) and depletion (blue) of lipids ( and Supplementary Table III) in EVs versus source cells showed a good concordance between triplicate measurements and confirmed that MSC and Huh7 exosomes displayed a very similar lipid composition. Next, we were interested whether enrichment or depletion in EVs versus source cells depended on head group or fatty acid tail characteristics. Hence, we created a sidebar on the left, which colour-coded 3 characteristics of each lipid species: charge of its head group [negative (green), neutral (navy) or zwitterionic (magenta)], average length (the darker, the longer) and average saturation (the darker, the more double bonds) of its fatty acid tails. The colours and grey shades partially followed unsupervised clustering of lipids indicating that head group charge as well as tail length and saturation correlated lipid enrichment in EVs. Specifically, MSC MVs (p=0.007), U87 exosomes (p=0.004) and U87 MVs (p=0.006) were enriched in zwitterionic lipid head groups (phosphatidylcholines and/or phosphatidylethanolamines) and depleted in other head groups. MSC exosomes, MSC MVs and Huh7 exosomes were enriched in long lipid species (more than 60 carbons, p≤0.001, p=0.041 and p≤0.001, respectively) and polyunsaturated lipid species (more than 10 double bonds, p=0.006, 0.038 and 0.001, respectively).
Fig. 6. Lipid enrichment in EVs correlates with head group charge and fatty acid tail length and saturation. Lipid species levels in EVs were normalized to the corresponding lipid levels in source cells, expressed on a log(2) scale and colour-coded. Depletion is depicted in blue and enrichment in red. Sidebar on the left encodes 3 characteristics of a lipid species: headgroup charge (in colour), average length of fatty acid tails (greyscale) and average level of saturation of fatty acid tails (greyscale). Lipid species clustered not only according to head group charge but also according to length and saturation of tails.
Lipid class enrichment in EVs depends on vesicle type and source cell type
The 22 lipid classes detected could be sorted into groups marking enrichment in MVs or exosomes, depletion in most EVs or no change in EVs relative to source cells ().
Fig. 7. Lipid class enrichment in EVs depends on vesicle type and source cell type. Percentage of each lipid class within a sample is depicted on slope charts and lipid class grouped according to their enrichment in microvesicles (upper panel), enrichment in exosomes (upper middle panel), depletion in most EVs (lower middle panel) or no difference between EVs and source cells (lower panel). Source cells are depicted in black, exosomes in red and microvesicles in blue. Since different lipid classes represent vastly different percentage of cells’ or vesicles’ lipid composition, the scale of the y-axes shows a corresponding variability.
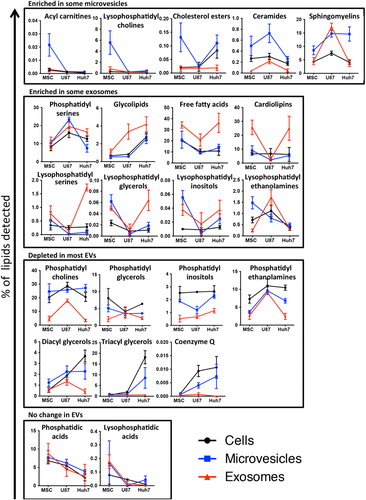
Ceramides and sphingomyelins were consistently enriched in all MVs, whereas cholesterol esters showed enrichment only in MSC and Huh7 MVs and acyl carnitines and lysophosphatidylcholines only in MSC MVs (, upper panel). These lipid classes were depleted from or unchanged in exosomes, with the exception of marked sphingomyelin enrichment in U87 exosomes.
Glycolipid, free fatty acid and phosphatidylserine enrichment characterized all exosomes and were depleted from or unchanged in MVs, except for phosphatidylserine enrichment in U87 MVs (, upper middle panel). The free fatty acids most enriched in MSC and Huh7 exosomes were fully saturated (data not shown). Cardiolipins were markedly enriched in MSC and Huh7 exosomes only. Lyso derivatives (where 1 fatty acid tail is removed by hydrolysis) of phosphatidylserines, phosphatidylglycerols and phosphatidylinositols showed enrichment in MSC and Huh7 exosomes, whereas lyso-phosphatidylethanolamines were rather enriched in U87 exosomes. These lysoderivatives were also enriched in MSC MVs but depleted from U87 and Huh7 MVs.
Structural membrane lipids, including phosphatidylglycerols, phosphatidylinositols and phosphatidylethanolamines, showed depletion from all exosomes and most MVs (, lower middle panel). Phosphatidylcholines were depleted in exosomes but unchanged or enriched in MVs. Depletion in diacyl and triacylglycerols in EVs was most pronounced in Huh7 cells, which had a high baseline level of these lipid classes.
The concentration of phosphatidic acids and their lysophosphatidyl derivatives did not differ between source cells and EVs (, lower panel).
Taken together, both vesicle type and source cell type affected the lipid composition of EVs.
Discussion
EVs consist of heterogeneous subgroups, which are difficult to fully distinguish by current purification methods. Here, we showed that (a) exosomes and MVs could be well distinguished on the proteome level but did not display source cell-independent, vesicle type-specific protein markers, (b) proteome but not lipidome of EVs distinguished cancerous source cells from stem source cells, (c) protein and lipid enrichment in EVs compared to source cells were not linked. Furthermore, the current study provides the largest data set of EV lipid content to date.
We observed cell-type-specific enrichment of proteins and lipids in EVs. The clear difference between composition of source cells and EVs indicated that lipids and proteins are likely actively sorted into EVs. However, the enrichment of commonly used exosome markers was source-cell-type dependent, and although to a different extent, all exosomal markers were enriched in MVs as well. Enrichment of Rab proteins in EVs, a protein family indicated in exosomal biogenesis (Citation45), showed marked source cell dependency, suggesting that protein sorting mechanisms into EVs may depend on source cell type. Commonly enriched pathways in EVs correlated well with previously described behaviours of EVs [such as heparin-binding (Citation46), immune response stimulation (Citation32, Citation47), integrin content (Citation44) and antiphagocytic CD47 (Citation48) of exosomes and mitochondrial, proteasomal and ER content of MVs (Citation16, Citation49)]. GO analysis found enrichment of certain post-translational modification motifs (e.g. glycosylation and prenylation) common to all EVs, although the exosome targeting palmitoyl modification (Citation43) was not detected. We were not able to detect any protein biomarkers that were enriched in exosomes of all source cells and at the same time depleted in MVs of all source cells. Nevertheless, we showed that exosomal and MV content on the proteome level differed significantly from each other independent of source cell type. Therefore, we suggest that the correlation between exosome and MV content could be explored as an additional biomarker for “vesiculome” (mass spectrometry and RNASeq) studies.
Protein enrichment in exosomes distinguished cancer cells from the stem cells used in this study. If further studies on EVs derived from multiple malignant and benign cell types will confirm this observation, then protein enrichment in exosomes might become a particularly useful general cancer marker. Furthermore, this phenomenon suggests that stem cells and cancer cells may use different mechanisms to sort proteins into EVs. Hence, the biomarker value of exosomes might lie in indicating sorting dysregulation in their source cells, whereas MVs are valuable for reflecting the content of their source cells.
Protein and lipid sorting into EVs did not appear to be linked: U87 and Huh7 (cancerous) cells enriched similar proteins but different lipids in their EVs, while Huh7 and MSC (yielding few and smaller exosomes) cells enriched similar lipids but different proteins in their EVs. Hence, protein sorting into EVs associated best with stem or cancer cell origin in this study, whereas lipid sorting associated best with yield and size of exosomes. Further studies are needed to confirm whether these associations explain EV biogenesis mechanisms.
The current study mapped EV lipidome to a great depth, identifying almost 2,000 lipid species. Since lipids are not coded in the genetic code and biological functions of most lipids detectable by mass spectrometry are unknown, data interpretation may follow biochemical/structural principles. Here, we showed that not only head group identity but also head group charge, fatty acid tail length and saturation contributed to lipid enrichment in EVs. These parameters modify the head group-to-tail size ratio, which, in turn, defines the spontaneous curvature of a lipid monolayer. Since EVs are small vesicles, their limiting bilayer membranes are highly curved. We found exosomes to be enriched in positive curvature promoting (free fatty acids and lysophosphatidyl derivatives, both having 1 tail only and favouring outer membranes) as well as negative curvature promoting (cardiolipins having 4 tails and favouring inner membranes) lipids. While cardiolipin is believed to exclusively reside in the inner mitochondrial membrane (a highly curved membrane itself), other mitochondrial contents (proteins) were specifically depleted from the same Huh7 and MSC exosomes. These data suggest that cardiolipin must be actively sorted into exosomes of Huh7 cells and MSCs, and it might function to stabilize these unusually small vesicles. However, a wider screen of source cell types is necessary to establish a firm correlation between cardiolipin content and exosome size. Furthermore, it is intriguing to speculate that anti-cardiolipin antibodies present in several autoimmune diseases (Citation50) might partially be generated due to the presence of cardiolipin on circulating exosomes.
Sphingomyelins and ceramides have been implicated in exosomal biogenesis in brain cells [oligodendrocytes (Citation51), neurons (Citation52), neuroblastoma (Citation53)] but not in in PC-3 cells (Citation54). We found enrichment of sphingomyelins in U87 glioblastoma (a brain cell type) exosomes only, whereas both sphingomyelins and ceramides were characteristically enriched in all MVs. Ceramide-triggered exosome formation pathway is thought to be independent of the endosomal sorting complexes required for transport (ESCRT)-mediated exosome formation pathway (Citation51) and controls the packaging of only a subset of proteins into exosomes (Citation52). Hence, source cell type may influence, which pathway is predominantly involved in exosome formation and which lipid sorting mechanism is applied. Different exosome formation pathways may overlap with MV formation pathways in a source-cell-type-dependent manner.
We found that structural plasma membrane lipids, including phosphatidylcholines, phosphatidylinositols, phosphatidylglycols and phosphatidylethanolamines, were depleted, whereas phosphatidylserines showed a mild enrichment in exosomes but not in MVs. These data are consistent with previous findings showing depletion of phosphatidylcholines and enrichment of phosphatidylserines in exosomes (Citation28). These lipids comprise the majority of membranes, and their levels in MVs were more similar to source cells than their levels in exosomes.
Conflict of interest and funding
The authors declare no conflict of interest.
Supplementary Table 1
Download MS Excel (43.9 KB)Supplementary Table 2
Download MS Excel (718.1 KB)Supplementary Table 3
Download MS Excel (609.6 KB)Supplementary Figures
Download PDF (1 MB)Acknowledgements
We thank Emily Y Chen and Justice McDaniel for their help in lipidomics analysis, Annie Hien for her help in initial EV preparations, Joerg Braun for help with Western blotting and Darryl Conte for help with manuscript preparation. This work was supported by NIH UH2-UH3 grant TR 000-888 to NA and AK, NIH R01 grant GM108803 to AK and CHDI Foundation (Research Agreement A-6119).
Notes
To access the supplementary material to this article, please see Supplementary files under ‘Article Tools’.
Related Research Data
References
- Jia S, Zocco D, Samuels ML, Chou MF, Chammas R, Skog J, etal. Emerging technologies in extracellular vesicle-based molecular diagnostics. Expert Rev Mol Diagn. 2014; 14: 307–21.
- Long JD, Sullivan TB, Humphrey J, Logvinenko T, Summerhayes KA, Kozinn S, etal. A non-invasive miRNA based assay to detect bladder cancer in cell-free urine. Am J Transl Res. 2015; 7: 2500–9.
- Ben-Dov IZ, Whalen VM, Goilav B, Max KE, Tuschl T. Cell and microvesicle urine microRNA deep sequencing profiles from healthy individuals: observations with potential impact on biomarker studies. PLoS One. 2016; 11: e0147249.
- Royo F, Zuñiga-Garcia P, Torrano V, Loizaga A, Sanchez-Mosquera P, Ugalde-Olano A, etal. Transcriptomic profiling of urine extracellular vesicles reveals alterations of CDH3 in prostate cancer. Oncotarget. 2016; 7: 6835–46.
- Momen-Heravi F, Saha B, Kodys K, Catalano D, Satishchandran A, Szabo G. Increased number of circulating exosomes and their microRNA cargos are potential novel biomarkers in alcoholic hepatitis. J Transl Med. 2015; 13: 261.
- Sohn W, Kim J, Kang SH, Yang SR, Cho JY, Cho HC, etal. Serum exosomal microRNAs as novel biomarkers for hepatocellular carcinoma. Exp Mol Med. 2015; 47: e184.
- Quinn JF, Patel T, Wong D, Das S, Freedman JE, Laurent LC, etal. Extracellular RNAs: development as biomarkers of human disease. J Extracell Vesicles. 2015; 4: 27495.
- Hornick NI, Huan J, Doron B, Goloviznina NA, Lapidus J, Chang BH, etal. Serum exosome microRNA as a minimally-invasive early biomarker of AML. Sci Rep. 2015; 5: 11295.
- Didiot MC, Hall LM, Coles AH, Haraszti RA, Godinho BM, Chase K, etal. Exosome-mediated delivery of hydrophobically modified siRNA for Huntingtin mRNA silencing. Mol Ther. 2016; 126
- Quesenberry PJ, Aliotta J, Deregibus MC, Camussi G. Role of extracellular RNA-carrying vesicles in cell differentiation and reprogramming. Stem Cell Res Ther. 2015; 6: 153.
- Lener T, Gimona M, Aigner L, Borger V, Buzas E, Camussi G, etal. Applying extracellular vesicles based therapeutics in clinical trials – an ISEV position paper. J Extracell Vesicles. 2015; 4: 30087.
- Heijnen HF, Schiel AE, Fijnheer R, Geuze HJ, Sixma JJ. Activated platelets release two types of membrane vesicles: microvesicles by surface shedding and exosomes derived from exocytosis of multivesicular bodies and alpha-granules. Blood. 1999; 94: 3791–9.
- Holme PA, Brosstad F, Solum NO. The difference between platelet and plasma FXIII used to study the mechanism of platelet microvesicle formation. Thromb Haemost. 1993; 70: 681–6.
- Thery C, Amigorena S, Raposo G, Clayton A. Isolation and characterization of exosomes from cell culture supernatants and biological fluids. Curr Protoc Cell Biol. 2006. Chapter 3:Unit 3. 22.
- Lobb RJ, Becker M, Wen SW, Wong CS, Wiegmans AP, Leimgruber A, etal. Optimized exosome isolation protocol for cell culture supernatant and human plasma. J Extracell Vesicles. 2015; 4: 27031.
- Kowal J, Arras G, Colombo M, Jouve M, Morath JP, Primdal-Bengtson B, etal. Proteomic comparison defines novel markers to characterize heterogeneous populations of extracellular vesicle subtypes. Proc Natl Acad Sci USA. 2016; 113: E968–77.
- Wubbolts R, Leckie RS, Veenhuizen PT, Schwarzmann G, Mobius W, Hoernschemeyer J, etal. Proteomic and biochemical analyses of human B cell-derived exosomes. Potential implications for their function and multivesicular body formation. J Bio Chem. 2003; 278: 10963–72.
- Aalberts M, van Dissel-Emiliani FM, van Adrichem NP, van Wijnen M, Wauben MH, Stout TA, etal. Identification of distinct populations of prostasomes that differentially express prostate stem cell antigen, annexin A1, and GLIPR2 in humans. Biol Reprod. 2012; 86: 82.
- Greening DW, Xu R, Ji H, Tauro BJ, Simpson RJ. A protocol for exosome isolation and characterization: evaluation of ultracentrifugation, density-gradient separation, and immunoaffinity capture methods. Methods Mol Biol. 2015; 1295: 179–209.
- Raposo G, Stoorvogel W. Extracellular vesicles: exosomes, microvesicles, and friends. J Cell Biol. 2013; 200: 373–83.
- Anderson JD, Johansson HJ, Graham CS, Vesterlund M, Pham MT, Bramlett CS, etal. Comprehensive proteomic analysis of mesenchymal stem cell exosomes reveals modulation of angiogenesis via nuclear factor-kappaB signaling. Stem Cells. 2016; 34: 601–13.
- Kreimer S, Belov AM, Ghiran I, Murthy SK, Frank DA, Ivanov AR. Mass-spectrometry-based molecular characterization of extracellular vesicles: lipidomics and proteomics. J Proteome Res. 2015; 14: 2367–84.
- Clark DJ, Fondrie WE, Liao Z, Hanson PI, Fulton A, Mao L, etal. Redefining the breast cancer exosome proteome by tandem mass tag quantitative proteomics and multivariate cluster analysis. Anal Chem. 2015; 87: 10462–9.
- Wang Z, Hill S, Luther JM, Hachey DL, Schey KL. Proteomic analysis of urine exosomes by multidimensional protein identification technology (MudPIT). Proteomics. 2012; 12: 329–38.
- Sinha A, Ignatchenko V, Ignatchenko A, Mejia-Guerrero S, Kislinger T. In-depth proteomic analyses of ovarian cancer cell line exosomes reveals differential enrichment of functional categories compared to the NCI 60 proteome. Biochem Biophys Res Commun. 2014; 445: 694–701.
- Vallejo MC, Nakayasu ES, Longo LV, Ganiko L, Lopes FG, Matsuo AL, etal. Lipidomic analysis of extracellular vesicles from the pathogenic phase of Paracoccidioides brasiliensis . PLoS One. 2012; 7: e39463.
- Del Boccio P, Raimondo F, Pieragostino D, Morosi L, Cozzi G, Sacchetta P, etal. A hyphenated microLC-Q-TOF-MS platform for exosomal lipidomics investigations: application to RCC urinary exosomes. Electrophoresis. 2012; 33: 689–96.
- Llorente A, Skotland T, Sylvanne T, Kauhanen D, Rog T, Orlowski A, etal. Molecular lipidomics of exosomes released by PC-3 prostate cancer cells. Biochim Biophys Acta. 2013; 1831: 1302–9.
- Duijvesz D, Burnum-Johnson KE, Gritsenko MA, Hoogland AM, Vredenbregt-van den Berg MS, Willemsen R, etal. Proteomic profiling of exosomes leads to the identification of novel biomarkers for prostate cancer. PLoS One. 2013; 8: e82589.
- Kalra H, Adda CG, Liem M, Ang CS, Mechler A, Simpson RJ, etal. Comparative proteomics evaluation of plasma exosome isolation techniques and assessment of the stability of exosomes in normal human blood plasma. Proteomics. 2013; 13: 3354–64.
- Ji H, Greening DW, Barnes TW, Lim JW, Tauro BJ, Rai A, etal. Proteome profiling of exosomes derived from human primary and metastatic colorectal cancer cells reveal differential expression of key metastatic factors and signal transduction components. Proteomics. 2013; 13: 1672–86.
- Graner MW, Alzate O, Dechkovskaia AM, Keene JD, Sampson JH, Mitchell DA, etal. Proteomic and immunologic analyses of brain tumor exosomes. FASEB J. 2009; 23: 1541–57.
- Choi DS, Kim DK, Kim YK, Gho YS. Proteomics, transcriptomics and lipidomics of exosomes and ectosomes. Proteomics. 2013; 13: 1554–71.
- Carayon K, Chaoui K, Ronzier E, Lazar I, Bertrand-Michel J, Roques V, etal. Proteolipidic composition of exosomes changes during reticulocyte maturation. J Biol Chem. 2011; 286: 34426–39.
- Evans SM, Putt M, Yang XY, Lustig RA, Martinez-Lage M, Williams D, etal. Initial evidence that blood-borne microvesicles are biomarkers for recurrence and survival in newly diagnosed glioblastoma patients. J Neurooncol. 2016; 127: 391–400.
- Kiebish MA, Bell R, Yang K, Phan T, Zhao Z, Ames W, etal. Dynamic simulation of cardiolipin remodeling: greasing the wheels for an interpretative approach to lipidomics. J Lipid Res. 2010; 51: 2153–70.
- Simons B, Kauhanen D, Sylvanne T, Tarasov K, Duchoslav E, Ekroos K. Shotgun lipidomics by sequential precursor ion fragmentation on a hybrid quadrupole time-of-flight mass spectrometer. Metabolites. 2012; 2: 195–213.
- Wilhelm M, Schlegl J, Hahne H, Moghaddas Gholami A, Lieberenz M, Savitski MM, etal. Mass-spectrometry-based draft of the human proteome. Nature. 2014; 509: 582–7.
- Huang da W, Sherman BT, Lempicki RA. Bioinformatics enrichment tools: paths toward the comprehensive functional analysis of large gene lists. Nucleic Acids Res. 2009; 37: 1–13.
- Huang da W, Sherman BT, Lempicki RA. Systematic and integrative analysis of large gene lists using DAVID bioinformatics resources. Nat Protoc. 2009; 4: 44–57.
- Keerthikumar S, Chisanga D, Ariyaratne D, Al Saffar H, Anand S, Zhao K, etal. ExoCarta: a web-based compendium of exosomal cargo. J Mol Biol. 2016; 428: 688–92.
- Mathivanan S, Ji H, Simpson RJ. Exosomes: extracellular organelles important in intercellular communication. J Proteomics. 2010; 73: 1907–20.
- Lai CP, Kim EY, Badr CE, Weissleder R, Mempel TR, Tannous BA, etal. Visualization and tracking of tumour extracellular vesicle delivery and RNA translation using multiplexed reporters. Nat Commun. 2015; 6: 7029.
- Hoshino A, Costa-Silva B, Shen TL, Rodrigues G, Hashimoto A, Tesic Mark M, etal. Tumour exosome integrins determine organotropic metastasis. Nature. 2015; 527: 329–35.
- Ostrowski M, Carmo NB, Krumeich S, Fanget I, Raposo G, Savina A, etal. Rab27a and Rab27b control different steps of the exosome secretion pathway. Nat Cell Biol. 2010; 12 19–30; sup pp 1–13.
- Balaj L, Atai NA, Chen W, Mu D, Tannous BA, Breakefield XO, etal. Heparin affinity purification of extracellular vesicles. Sci Rep. 2015; 5: 10266.
- Skokos D, Botros HG, Demeure C, Morin J, Peronet R, Birkenmeier G, etal. Mast cell-derived exosomes induce phenotypic and functional maturation of dendritic cells and elicit specific immune responses in vivo . J Immunol. 2003; 170: 3037–45.
- Kalra H, Drummen GP, Mathivanan S. Focus on extracellular vesicles: introducing the next small big thing. Int J Mol Sci. 2016; 17: 170.
- Zhang B, Asadi S, Weng Z, Sismanopoulos N, Theoharides TC. Stimulated human mast cells secrete mitochondrial components that have autocrine and paracrine inflammatory actions. PLoS One. 2012; 7: e49767.
- Sebastiani GD, Iuliano A, Cantarini L, Galeazzi M. Genetic aspects of the antiphospholipid syndrome: an update. Autoimmun Rev. 2016; 15: 433–9.
- Trajkovic K, Hsu C, Chiantia S, Rajendran L, Wenzel D, Wieland F, etal. Ceramide triggers budding of exosome vesicles into multivesicular endosomes. Science. 2008; 319: 1244–7.
- Guo BB, Bellingham SA, Hill AF. The neutral sphingomyelinase pathway regulates packaging of the prion protein into exosomes. J Biol Chem. 2015; 290: 3455–67.
- Yuyama K, Sun H, Mitsutake S, Igarashi Y. Sphingolipid-modulated exosome secretion promotes clearance of amyloid-beta by microglia. J Biol Chem. 2012; 287: 10977–89.
- Phuyal S, Hessvik NP, Skotland T, Sandvig K, Llorente A. Regulation of exosome release by glycosphingolipids and flotillins. FEBS J. 2014; 281: 2214–27.