ABSTRACT
The aerosol effects on clouds and precipitation in deep convective cloud systems are investigated using the Weather Research and Forecast (WRF) model with the Morrison two-moment bulk microphysics scheme. Considering positive or negative relationships between the cloud droplet number concentration (N c ) and spectral dispersion (ɛ), a suite of sensitivity experiments are performed using an initial sounding data of the deep convective cloud system on 31 March 2005 in Beijing under either a maritime (‘clean’) or continental (‘polluted’) background. Numerical experiments in this study indicate that the sign of the surface precipitation response induced by aerosols is dependent on the ɛ−N c relationships, which can influence the autoconversion processes from cloud droplets to rain drops. When the spectral dispersion ɛ is an increasing function of N c , the domain-average cumulative precipitation increases with aerosol concentrations from maritime to continental background. That may be because the existence of large-sized rain drops can increase precipitation at high aerosol concentration. However, the surface precipitation is reduced with increasing concentrations of aerosol particles when ɛ is a decreasing function of N c . For the ɛ−N c negative relationships, smaller spectral dispersion suppresses the autoconversion processes, reduces the rain water content and eventually decreases the surface precipitation under polluted conditions. Although differences in the surface precipitation between polluted and clean backgrounds are small for all the ɛ−N c relationships, additional simulations show that our findings are robust to small perturbations in the initial thermal conditions.
1. Introduction
The presence of aerosols has non-negligible impacts on the earth–atmosphere system, especially on the climate and the hydrological cycle (Ramanathan et al., Citation2001). It is well known that atmospheric aerosols have a direct impact on the local and global radiation balance by scattering and absorbing solar and terrestrial radiation. Hydrophilic aerosols, serving as cloud condensation nuclei (CCN) or ice nuclei (IN), can indirectly affect cloud radiative properties (Twomey, Citation1977) and precipitation processes (Albrecht, Citation1989).
Considerable attention has been focused recently on the aerosol effects on surface precipitation owing to the complex physical processes in clouds determined by aerosol characteristics and atmospheric environment factors, including dynamical and thermodynamic properties (Hobbs, Citation1993). Whether atmospheric aerosols can increase or decrease surface precipitation has long been a controversial issue in both observations and numerical studies, as recently reviewed by Tao et al. (Citation2012). On the one hand, observations have demonstrated that aerosols from urban and industrial air pollution can decrease cloud droplet size, suppress droplet coalescence and in turn reduce precipitation (Rosenfeld, Citation1999). On the other hand, Shepherd and Burian (Citation2003) have claimed that the precipitation enhancement around heavily polluted urban areas was observed. Many previous numerical studies have reported that aerosols from air pollution can both suppress precipitation (Khain and Pokrovsky, Citation2004; Khain et al., Citation2004; Cui et al., Citation2006; Teller and Levin, Citation2006; van den Heever and Cotton, Citation2007; Storer et al., Citation2010; Tao et al., Citation2012) and enhance precipitation (Khain et al., Citation2005; Wang, Citation2005; Tao et al., Citation2012).
Many hypotheses were proposed to determine the effects of aerosols on the surface precipitation. It was shown that physical and chemical properties of aerosols, for example, size distribution, can affect clouds and surface precipitation significantly (Yin et al., Citation2000; Rudich et al., Citation2002; Yin et al., Citation2002; Fan et al., Citation2007b). The work by Li et al. (2008) recently showed the non-monotonic responses of the surface precipitation to increasing aerosol particles. With increasing aerosol particles, precipitation increases at lower CCN concentrations, while the precipitation decreases at higher CCN concentrations. These non-monotonic responses of aerosols on precipitation are also found by Lim and Hong (Citation2010). Some numerical studies indicate that the impact of aerosols on precipitation and convection structure depends on cloud type (Seifert and Beheng, Citation2006; Khain et al., Citation2008; van den Heever et al., Citation2011) and the atmospheric environment factors, including convective available potential energy (CAPE), air humidity and wind shear (Khain et al., Citation2005; Fan et al., Citation2007a; Lynn et al., Citation2007; Tao et al., Citation2007; Fan et al., Citation2009; Storer et al., Citation2010; Lee, Citation2011). Storer et al. (Citation2010), found that the aerosol indirect effects observed in their study can be changed by different CAPE. Relative humidity, which is one of the important thermodynamic factors, has an important influence on the aerosol–cloud–precipitation system. In air with different relative humidity, the aerosol effects on the surface cumulative precipitation will behave distinctly (Khain et al., Citation2005; Lynn et al., Citation2007; Fan et al., Citation2007a; Tao et al., Citation2007; Lee, Citation2011). Recently, Fan et al. (2009) showed the importance of the magnitude of the environmental vertical wind shear on the aerosol-induced changes of precipitation, and they pointed out that the vertical wind shear can determine whether aerosols induce precipitation suppression or enhancement.
At the same time, the aerosol indirect effects are considered to be associated with the cloud droplet spectral dispersion ɛ defined as the ratio of standard deviation and mean radius of the cloud droplet size distribution (Liu and Daum, Citation2002). This parameter represents the relative dispersion of cloud droplet size distribution. A small value of spectral dispersion indicates a relative narrow size distribution of cloud droplets, whereas a large value shows a good mixture of small and large droplets. A series of theoretical studies have shown that the cloud droplet spectral dispersion has an important influence on the autoconversion parameterisation of the cloud microphysical processes, which can determine the onset of precipitation in warm clouds, and influence the precipitation amount (Liu and Daum, Citation2004; Liu et al., Citation2006a; Xie and Liu, Citation2009). Rotstayn and Liu (Citation2005) showed that these autoconversion parameterisation schemes, including ɛ (Liu and Daum, Citation2004), derived analytically, without employing the unrealistic assumption of constant collection efficiency of cloud water can also account for the spectral dispersion effects on cloud microphysical properties and surface precipitation. More recently, based on sensitivity studies of various spectral dispersion (ɛ= 0.1, 0.2, 0.3 0.4, 0.5, 0.6, 0.7, 0.8, 0.9, 1.0) in the mesoscale convective systems, Xie and Liu (Citation2011) found that the spectral dispersion significantly affects both the cloud microphysical properties and the surface accumulated precipitation in different aerosol backgrounds. Hence, the cloud droplet spectral dispersion is a key parameter which combines aerosols effect on cloud microphysical properties with the surface precipitation.
Some observational studies show that the cloud droplet spectral dispersion ɛ is not a free parameter, which is closely related to cloud microphysical properties, for example, the cloud droplet number concentration N c (Martin et al., Citation1994; Grabowski, Citation1998; Rotstayn and Liu, Citation2003; Daum et al., Citation2007). However, there remains much uncertainty about the present available ɛ−N c relationships. The ɛ−N c relationship is positive reported by Martin et al. (Citation1994) and Rotstayn and Liu (Citation2003), while a negative relationship is found in the work of Grabowski (Citation1998) and Daum et al. (Citation2007). It is suggested that the change of cloud droplet spectral dispersion is very complex, which depends on aerosol physical properties, aerosol chemical composition, dynamical process and other environment factors (Khain et al., Citation2000; Yum and Hudson, Citation2005; Lu and Seinfeld, Citation2006; Liu et al., Citation2006b; Peng et al., Citation2007). At present, the cloud droplet spectral dispersion is not considered or is fixed as a constant in most bulk microphysics parameterisations, especially in the autoconversion parameterisations. Although a few works use the autoconversion parameterisation with ɛ−N c relationships in their theories and models, they only consider the ɛ−N c positive relationships (Liu and Daum, Citation2002; Peng and Lohmann, Citation2003; Rotstayn and Liu, Citation2003; Chen and Penner, Citation2005). We first couple the different types of ɛ−N c relationships (both positive and negative relationship) into the autoconversion paremeterisation considering spectral dispersion in the Weather Research and Forecast (WRF) model.
In this article, we investigate the impacts of aerosols on clouds and precipitation in a deep convective system on 31 March 2005 in Beijing, using the WRF model with the Morrison two-moment bulk microphysics scheme. This article is organised as follows. The autoconversion parameterisation and the WRF model are presented in Section 2. The results of numerical simulations, including cloud microphysical properties and surface precipitation, are discussed in Section 3. Finally, the conclusion and future work are presented in Section 4.
2. Model and simulations
2.1. Relationships between spectral dispersion and cloud droplet number concentration
Many observational studies indicate that the cloud droplet spectral dispersion ɛ can be described as a function of the cloud droplet number concentration N
c
(unit: cm−3). According to the observations from Martin et al. (Citation1994), the ɛ−N
c
relationship has been approximated by Morrison and Grabowski (Citation2007, hereafter, MG07)1
their analytical result is from warm stratocumulus clouds with maritime air masses and continental air masses, where ɛ=0.33 for maritime air masses and ɛ=0.43 for continental air masses.
Rotstayn and Liu (Citation2003) obtained the following formula from measurements (hereafter RL03)2
where the data were obtained from measurements in polluted and unpolluted marine stratiform and shallow cumulus clouds at a variety of locations.
In cloud resolving models, Grabowski (Citation1998) adopted the ɛ−N
c
relationship as (hereafter GB98)3
which is calculated from these two relations about ɛ=0.366 for maritime clouds with N c =50 cm−3 and ɛ=0.146 for continental clouds with N c =2000 cm−3, as suggested by Simpson and Wiggert (Citation1969).
From aircraft measurements, Daum et al. (Citation2007) gives the following relationship (hereafter DM07)4
here, the corresponding data were measured from low altitude marine stratus/stratocumulus clouds over the Eastern Pacific Ocean on 7 d during the month of July 2005.
displays these four relationships between the spectral dispersion and the cloud droplet number concentration (MG07, RL03, GB98 and DM07). As shown in , MG07 and RL03 reveal that the spectral dispersion are the increasing functions of the cloud droplet number concentration (the ɛ−N c positive relationship), whereas the decrease of ɛ with N c is revealed in GB98 and DM07 (the ɛ−N c negative relationship). Although these analytical results are mainly obtained from stratocumulus, stratiform or shallow cumulus clouds, we would apply them to a deep convective system to check the importance of ɛ−N c relationships due to the lack of observational evidences from deep convective clouds. It is noted that other observational and modelling studies also show the existences of ɛ−N c positive relationship (Miles et al., Citation2000; Pawlowska and Brenguier, Citation2000; Peng and Lohmann, Citation2003; Pawlowska et al., Citation2006) and negative relationship (Lu and Seinfeld, Citation2006; Ma et al., Citation2010; Chen et al., Citation2011; Wang et al., Citation2011).
Fig. 1. Variations in the cloud droplet spectral dispersion as the functions of cloud droplet number concentration for MG07, RL03, GB98 and DM07.
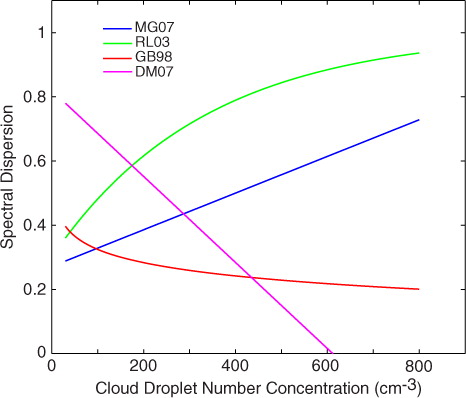
In addition, some results have also shown different relationships between ɛ and N c (Brenguier et al., Citation2011; Zhao et al., Citation2006). Zhao et al. (Citation2006) pointed out that the range in the spectral dispersion is large (0.2 to 0.8) when the cloud droplet number concentration is low, and converges towards a narrow range of 0.4 to 0.5 when the cloud number concentration is higher. The analysis shows that there is no detectable relationship between the spectral dispersion and the cloud droplet concentration (Brenguier et al., Citation2011). Many studies shows that the change of cloud droplet spectral dispersion is very complex, depending on aerosol physical properties, aerosol chemical composition, dynamical process and other environment factors (Khain et al., Citation2000; Yum and Hudson, Citation2005; Lu and Seinfeld, Citation2006; Liu et al., Citation2006b; Peng et al., Citation2007). For example, Liu et al. (Citation2006b) pointed out that the ɛ−N c relationships is dependent on cloud dynamics, and the variation in cloud updraft can lead to a negative relationship.
The available observations show that there are both positive and negative relationships between the spectral dispersion and the cloud droplet number concentration. However, only numerical models with ɛ−N c positive relationships were tested to evaluate aerosol indirect effects until now (Peng and Lohmann, Citation2003; Rotstayn and Liu, Citation2003; Chen and Penner, Citation2005). In addition, the Morrison two-moment bulk microphysics scheme also adopted the ɛ−N c positive relationship as MG07 relationship (Morrison and Grabowski, Citation2007; Morrison et al., Citation2009). Our study couples these two opposite types of ɛ−N c relationships (including MG07, RL03, GB98 and DM07) with autoconversion parameterisations to investigate aerosol indirect effects on clouds and precipitation on a case study of Beijing deep convective clouds.
2.2. Parameterisations of autoconversion process and WRF simulations
Autoconversion process of cloud droplets to rain drops is a key microphysical process, which determines the onset of precipitation in warm clouds, and influences the precipitation amount. The autoconversion parameterisation used in our study is written as (Liu and Daum, Citation2004; Liu et al., Citation2005)5
6
where P (g cm−3 s−1), P
0 and T represent the autoconversion rate, the rate function and the threshold function, respectively. N
c
(cm−3) and L
c
(g cm−3) represent the total cloud droplet number concentration and the total cloud water content. x
c
can be written as a formula . In a previous study (Xie and Liu, Citation2011), a similar autoconversion parameterisation was adopted where the cloud droplet spectral dispersion is a fixed constant (ɛ=0.1, 0.2, 0.3, 0.4, 0.5, 0.6, 0.7, 0.8, 0.9, 1.0). However, in this article, ɛ is parameterised as the function of the cloud droplet number concentration N
c
, described by the functions eq. (1), (2), (3) and (4).
depicts the variation of the autoconversion rate P with N c , showing a decreasing P with increasing N c . The dependence of P on N c illustrates that higher cloud droplet concentration results in a lower autoconversion rate at given liquid water content for all the four ɛ−N c relationships. It is suggested that smaller droplets resulting from higher droplet number concentration (given liquid water content) can suppress the autoconversion processes by increasing colloidal stability (Squires, Citation1958).
Fig. 2. Dependence of autoconversion rate P on the cloud droplet number concentration for the different ɛ−N c relationships: MG07, RL03, GB98 and DM07 (at given L c = 1 g m−3).
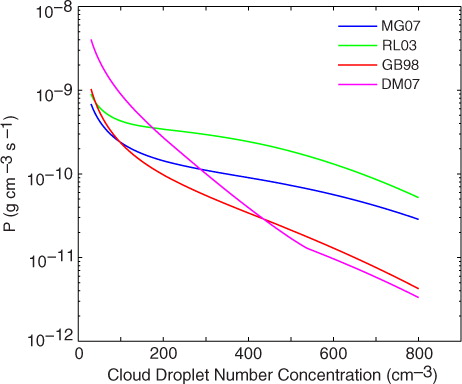
At the same time, it should be pointed out that there is a significant difference in the autoconversion rate between these two types of ɛ−N c relationships. At lower values of cloud drop number concentration, the autoconversion rates P of all the ɛ−N c relationships are similar, except that of DM07, which is greater owing to its larger spectral dispersion (as shown in ). However, the autoconversion rates become quite different with an increase in the cloud droplet number concentration. For the ɛ−N c positive relationships (MG07 and RL03), P are much larger than that of the ɛ−N c negative relationships (GB98 and DM07). The negative formulations make the slope of the relationship between autoconversion rate and cloud droplet number concentration much steeper because the decreasing spectral dispersion can enhance the suppressive effect on the autoconversion processes induced by higher cloud droplet number concentration. These results could be responsible for the distinct aerosol-induced changes on precipitation for these two types of the ɛ−N c relationships. In the following section, we have mainly concentrated on analysing the difference in the modelled cloud microphysical properties, cloud dynamic properties, as well as the surface cumulative precipitation between the ɛ−N c positive and negative relationships.
The model used in this study is the WRF model version 2.2, which was released in December 2006. The WRF model is a state-of-the-art mesoscale numerical weather prediction system, which can be suitable for a broad spectrum of applications across scales ranging from metres to thousands of kilometres, and can serve both operational forecasting and atmospheric research needs (Skamarock et al., Citation2005). The microphysics scheme used is the Morrison two-moment bulk microphysics scheme version V2.0 (Morrison et al., Citation2005; Morrison et al., Citation2009), which is provided directly by Morrison. Note that this bulk scheme is different from the version in the standard released WRF model in which the cloud droplet number concentration N c is a fixed number (e.g. N c =250 cm−3). The scheme can predict mass mixing ratio and number concentration of five classes, including cloud droplets, rain drops, ice crystals, snow and graupel. The ɛ−N c relationship is described by MG07 relationship (1). Here, we used MG07 (1), RL03 (2), GB98 (3) and DM07 (4) relationships to parameterise the cloud droplet spectral dispersion. Because the autoconversion parameterisation (Khairoutdinov and Kogan, Citation2000) does not consider spectral dispersion in this two-moment bulk microphysics scheme, the analytical autoconversion parameterisation (5) is used instead of the existing parameterisation.
In the bulk microphysics schemes, the precipitation rate PR (kg m−2 s−1) can be represented as7
where ρ air is the density of air (kg m−3), q is the water content of precipitation particles and V t is the terminal mass-weighted velocity, which is generally estimated as power functions of the particle size. Hence, the precipitation rate and the precipitation amount are mainly dependent on the water content of precipitation particles and their volume radius. For rain drops, more water content and larger radius can both increase the surface precipitation. This formula can help us to understand the distinct effects of aerosols on precipitation for the different ɛ−N c relationships.
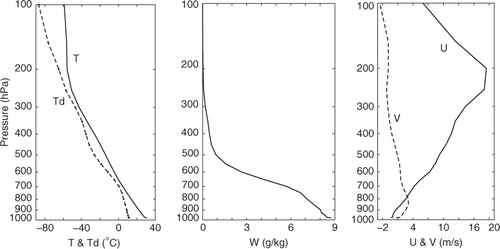
In this article, the WRF model with the Morrison two-moment bulk parameterisation scheme is used to simulate a deep convective cloud system. For simulations of the convective cloud system on 31 March 2005 in Beijing, the thermodynamic conditions used by Xie and Liu (Citation2011) are chosen. Soundings used are presented in , including the vertical profiles of temperature and dew point, water vapour mixing ratio and horizontal wind velocities. The vertical temperature and dew point profiles reveal a moderate instability in the atmosphere, with a convective available potential energy (CAPE) of 1133 J kg−1 integrated from the surface. The surface temperature is about 31°C and the water vapour mixing ratio has a maximum value of 9 g kg−1 (the corresponding relative humidity is about 32%), decreasing continuously with height. Wind shear of U component of wind fields is not strong (about 11 m s−1 calculated by max(U) minus min(U) within 7 km from ground), while the wind shear of V component is very small. Because of the moderate atmosphere instability and wind shear, these clouds did not produce secondary clouds in our simulation.
Fig. 3. Initial profiles of temperature (T), dew point (Td), water vapour mixing ratio (W) and horizontal winds U and V.
All the simulations have a domain with 80 km for both the east–west (x) and north–south (y) directions with a 1 km grid spacing. It has the 41 vertical sigma levels, and the top height of the model computational area is 20 km. The time step for integration was 6 s, and the model was integrated for 3 hours, with 5-min output. Periodic boundary conditions were applied on horizontal boundaries. The WRF model was run with a standard set up. Subgrid-scale (TKE) 1.5 turbulence closure was adopted (following Tao et al., Citation2007; Morrison, Citation2012). The convection was triggered by a temperature pulse of 3 K, decreased exponentially both horizontally and vertically with distance from the triggering location and was similar in all the simulations. In addition, we also performed a suite of sensitivity experiments with small perturbations to the thermal to initiate convection ±0.5 K) to make our results more robust in subsection 3.3.
The initial aerosol size distribution was calculated by an empirical formula: N ccn =C 0 S k (Pruppacher and Klett, Citation1997), where S is supersaturation with respect to water. In this study, we adopt C 0=120 cm−3 and k=0.4 for the maritime (‘clean’) background, C 0=1000 cm−3 and k=0.5 for the continental (‘polluted’) background. In these two aerosol backgrounds, we performed the four experiments with the different ɛ−N c relationships, respectively (summarised in ).
Table 1. Summary of the experiments
3. Model results and discussions
3.1. Liquid cloud microphysical properties
In this subsection, we mainly discuss the variations of warm cloud microphysical properties from two aspects: the different aerosol backgrounds (maritime vs. continental) and the distinct types of ɛ−N c relationships (positive vs. negative relationships). The results of liquid cloud microphysical properties with the different ɛ−N c relationships in the maritime and continental backgrounds are all given in . This table includes the number concentration and the content of cloud water, rain water, as well as the mean volume radius for cloud droplets and rain drops.
Table 2. Liquid cloud microphysical properties obtained from whole domain-averaged values during a 3-hour integration time period
As shown in , the liquid cloud microphysical properties can be significantly changed by aerosols. The cloud droplet number concentration and the cloud water content both increase with an increase in aerosol concentrations. At the same time, the mean volume radius of cloud droplets shows a significant decrease with increasing aerosols. This table demonstrates evidence of the first aerosol indirect effect (aerosols can produce clouds containing larger number of smaller cloud drops). The properties of rain drops show a different behaviour with an increase in aerosol concentrations, which is totally opposite to the case of cloud drops. The number concentration and the water content of rain drops decrease with aerosols from the clean background to the polluted background. The enhanced activation of aerosols forms much more cloud droplets with a smaller size, which can hinder the autoconversion processes of cloud droplets to rain drops, as shown in for PRC (also see e.g. Wang, Citation2005). The rain drop mean volume radius shows an increase with increasing aerosol concentrations. It is suggested that, compared with the autoconversion rate, there is relatively more efficient accretion growth with higher cloud water contents in the polluted backgrounds (see for PRA), which eventually results in larger radius of rain drops. Aerosols can increase the rain drop size, which is in general good agreement with previous studies (Cheng et al., Citation2007; Altaratz et al., Citation2008; Berg et al., Citation2008; Li et al., Citation2008; Li et al., Citation2009; Lim and Hong, Citation2010; Storer et al., Citation2010; Lim et al., Citation2011; Xie and Liu, Citation2011).
Table 3. Rates of the microphysical processes obtained from whole domain-averaged values during a 3-hour integration time period
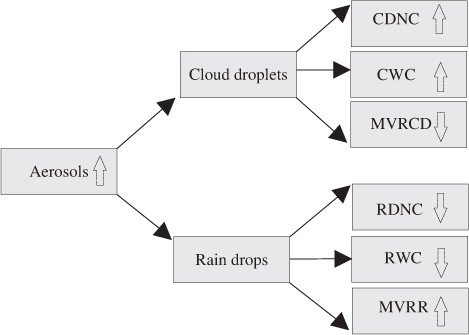
The aerosol-induced changing trends of the liquid cloud microphysical properties (including cloud droplets and rain drops) are consistent with these four ɛ−N c relationships, as summarised in . Increased aerosol concentrations can result in more and smaller cloud droplets with higher cloud water content; they can also lead to fewer and larger rain drops with lower rain water content. These results are consistent with our current understanding about the aerosol indirect effects on cloud microphysical properties (e.g. Li et al., Citation2008; Li et al., Citation2009; Lim and Hong Citation2010; Lim et al. Citation2011; Xie and Liu Citation2011). However, it is worth pointing out that there is a significant difference in the values of the liquid cloud microphysical properties between the ɛ−N c positive and negative relationships, especially in the polluted continental backgrounds. This is due to the fact that, at higher cloud droplet number concentrations induced by increasing aerosols, the evident differences exist in the cloud droplet spectral dispersion () and the autoconversion rates () for the ɛ−N c positive and negative relationships.
Fig. 4. Schematic diagram showing the aerosol-induced changing trends of liquid cloud microphysical properties, including cloud droplet number concentration (CDNC), cloud water content (CWC), mean volume radius of cloud droplet (MVRCD), rain drop number concentration (RDNC), rain water content (RWC) and mean volume radius of raindrops (MVRR).
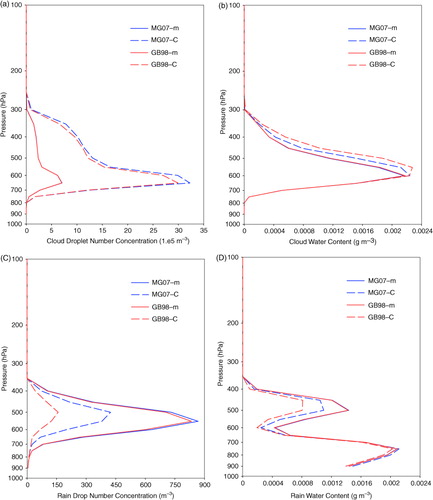
For the above reasons, we have mainly concentrated on analysing the difference in the modelling results between the two types of ɛ−N c relationships in the polluted continental backgrounds. The corresponding values of liquid cloud microphysical properties are similar for the same type of ɛ−N c relationships (see from ), and therefore MG07 represents the results of positive relationships, and GB98 represent the results of negative relationships in . This figure shows vertical profiles of horizontally averaged values for liquid cloud microphysical properties for the two types of ɛ−N c relationships. b shows that the cloud water content of the ɛ−N c positive relationship is less than that of the ɛ−N c negative relationship. It is suggested that, for the ɛ−N c positive relationship, larger spectral dispersion represents a higher degree of mixture of small and large cloud droplets, leading to a more efficient autoconversion process, therefore more cloud water can be converted to the rain water. At the same time, the cloud droplet number concentration is enhanced (a), and the cloud droplet radius is decreased slightly () with the ɛ−N c relationships changing from the negative to positive relationships. The number concentration and the water content of rain drops are both decreased significantly in the ɛ−N c negative relationships (see c and d) because the much steeper slope of the autoconversion rate () leads to lower efficiency of autconversion processes (as shown in ). These results may make the change of precipitation induced by aerosols quite different (see the following section for details). In addition, compared with the ɛ−N c negative relationships, the mean volume radius of rain drops is reduced for the ɛ−N c positive relationships (). This suggests that there is relatively a less efficient accretion process because of the existence of lower cloud water contents for the ɛ−N c positive relationships.
Fig. 5. Vertical profiles of liquid cloud microphysical properties obtained from the horizontal domain-averaged values during a 3-hour integration time period, including (a) cloud droplet number concentration, (b) cloud water content, (c) rain drop number concentration and (d) rain water content for the different types of the ɛ−N c relationships. Note that MG07-m and MG07-c cases represent the results of ɛ−N c positive relationships, while GB98-m and Gb98-c cases represent the results of the ɛ−N c negative relationships.
3.2. Ice cloud microphysical properties and dynamic properties
Some differences also exist among ice cloud microphysical properties of the simulations due to aerosol loading. shows the content, including ice, snow water, graupel water and total water content of ice phase in the maritime and continental backgrounds. Ice content in the continental backgrounds is less than that in the maritime backgrounds, suggesting that ice production process is small owing to inefficient immersion freezing of cloud droplets in the continental backgrounds (see For PIMMI). Immersion freezing and subsequent anvil cloud formation could be suppressed by the formation of more droplets with a smaller size in the high aerosol concentration condition, which is also indicated by previous studies (Li et al., Citation2008; Lim et al., Citation2011). In addition, aerosols may have important effects on mixed-phase or ice-phase cloud properties by serving as ice nuclei (IN) (e.g. van den Heever et al., Citation2006), but it is noted that the concentration of heterogeneous ice nuclei (IN) does not vary between pristine and polluted conditions in this study. It is clear that the snow water content increases with increasing aerosol concentration on account of more extensive riming at higher cloud water contents induced by aerosols through accretion processes (see for PSACWS). On the contrary, the graupel water content decreases with increasing aerosol concentrations, likely because fewer rain drops can be transported and frozen to form graupel through accretion processes in the cold cloud regimes (see for PRACG). In addition, the total water content of ice phase is increased with increasing aerosols because of a significant increase in snow water content. Due to the complexity of the ice cloud microphysical processes and the influence of dynamic factors, it is difficult to isolate specific mechanism to explain changes in ice-phase properties with increasing aerosols.
Table 4. Hydrometeor species of ice phase obtained from whole domain-averaged values during a 3-hour integration time period
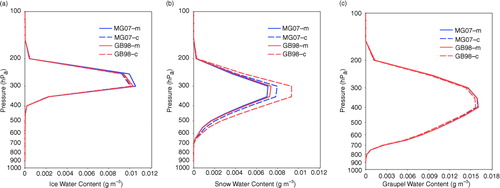
With respect to the results for different types of ɛ−N c relationships, we also make comparisons of the ice cloud microphysical properties in the continental backgrounds in . Similarly to , MG07 represents the results of positive relationships, and GB98 represents the results of negative relationships. It shows that the ice content is not sensitive to the ɛ−N c relationships, as shown in . As a comparison with the ɛ−N c positive relationships, the snow water content increases and the graupel water content decreases for the ɛ−N c negative relationships, as shown in b and c. It is understood that more extensive riming at higher cloud water contents for the ɛ−N c negative relationships forms snow, and fewer rain drops can be transported and frozen in the cold cloud regimes to form graupel (also see for PSACWS and PRACG).
Fig. 6. Same as , but for (a) ice content, (b) snow water content and (c) graupel water content.
For the dynamic properties, shows the domain-maximum vertical velocity as time in the maritime and continental backgrounds for the four ɛ−N c relationships. The domain-maximum vertical velocity increases rapidly over time, and it reaches its maximum value almost 27 m s−1 for the time at 0.5 hour. Then the value begins to decrease, and it becomes very small at the time after 1.5 hour. Correspondingly, the surface precipitation occurs mainly in the stage during the first 1.5 hour integration time (see ). To separately analyse the vertical wind over different periods of integration, the averaged domain-maximum vertical velocity and the corresponding relative differences between polluted and clean backgrounds are given over the total integration time () and over the first 1.5 hour (). The averaged domain-maximum vertical velocity over the total integration time is 6.40±0.03 m s−1, while the average value over the first 1.5 hour is 11.21±0.06 m s−1. These results show that the extent of the averaged domain-maximum vertical velocity variation is small for all the cases, including the different aerosol backgrounds and the various ɛ−N c relationships. We also give the average convective mass flux MF c within convective cores (convective cores are defined using a threshold where the vertical velocity is greater than 2 m s−1) at 0.5 hour in maritime and continental backgrounds (). It shows a weakening of the convective mass flux in polluted compared to clean backgrounds by −2.10% for MG07, −2.30% for RL03, −4.21% for GB98 and −5.23% for DM07 (see from ). Hence, the Morrison bulk microphysics scheme shows the weaker convection in polluted backgrounds relative to clean backgrounds, likely because of more latent heating for the clean background (Lebo and Seinfeld, Citation2011; Lebo et al., Citation2012; Morrison, Citation2012).
Fig. 7. Domain-maximum vertical velocity (m s−1) as functions of time in maritime and continental backgrounds for MG07, RL03, GB98 and DM07.
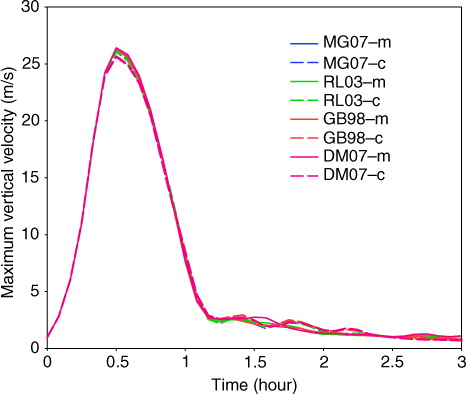
Fig. 8. Vertical profiles of the horizontally averaged convective mass flux MF c within convective cores at 0.5 hours in the clean maritime and polluted continental backgrounds for (a) MG07, (b) RL03, (c) GB98 and (d) DM07.
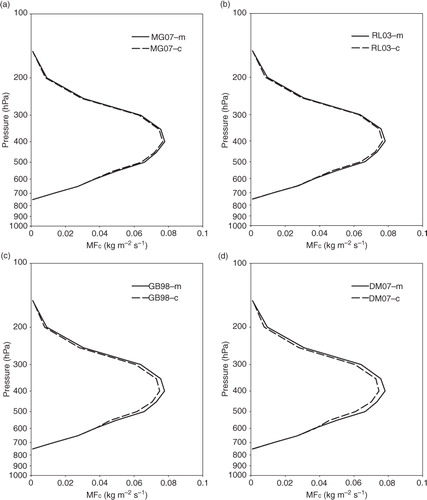
Table 5. Averaged domain-maximum vertical velocity (Wmax, m s−1) over the whole simulation time (3 hours) in maritime and continental backgrounds
Table 6. Averaged domain-maximum vertical velocity (Wmax, m s−1) during the first 1.5-hour integration time in maritime and continental backgrounds
Table 7. Average convective mass flux MF c within convective cores between 700 hPa and 200 hPa (0.01×kg m−2 s−1) at 0.5 hours in maritime and continental backgrounds
However, it should be noted that many previous studies demonstrate significant increases in the stronger convection owing to increasing release of latent heat of condensation and freezing associated with the activation and freezing of more cloud droplets with increasing aerosol number concentration (Khain et al., Citation2005; van den Heever et al., Citation2006; van den Heever and Cotton, Citation2007; Khain et al., Citation2008; Lebo and Seinfeld, Citation2011). In addition, the increased aerosol loadings can lead to invigoration or weakening of secondary convection, as suggested by Khain et al. (2005); Lynn et al. (Citation2005); van den Heever and Cotton (Citation2007); Tao et al. (Citation2007). Because of the moderate atmosphere instability and wind shear in this case study, these clouds did not produce secondary clouds in our simulation. So we do not consider aerosol effects on the convection of secondary clouds in this study. It is also shown that a slight change in the maximum vertical velocities and the average convective mass flux for the different ɛ−N c relationship. Several studies claimed that the slower autoconversion into rain drops of cloud drops leads to stronger convection because of the increased latent heat release above the freezing level (Tao et al., Citation2007; Rosenfeld et al., Citation2008). Nevertheless, our result does not predict stronger convection for the negative ɛ−N c relationship with low autoconversion rate relative to the positive ɛ−N c relationship.
3.3. Accumulated precipitation
Precipitation is the product of many microphysical processes of the classes of hydrometeors in clouds that falls under gravity. Generally, the precipitation amount (or the precipitation rate) can be determined by the two factors: the water content of precipitation particles and the corresponding mean volume radius from eq. (7). With respect to rain drops, more water content can enhance surface precipitation at a given mean volume radius. Similarly, at given water content, larger mean volume radius also shows an increase in the surface precipitation. The distinct effects of aerosols on precipitation for the two types of ɛ−N c relationships can be attributed to these two factors, which will be explained in the following.
The temporal evolution of the model-estimated domain average accumulated precipitation in the maritime and continental backgrounds for the different ɛ−N c relationships are shown in a (MG07), b (RL03), c (GB98) and d (DM07). a and b show that the cumulative precipitation in the maritime background is less than that in the continental background. Relative differences in domain-averaged accumulated precipitation between polluted and clean backgrounds is 3.89% for MG07 and 8.83% for RL03 (see ). The surface precipitation amount decreases with aerosol concentrations from the clean maritime background to the polluted continental background in c and d. Relative differences between polluted and clean backgrounds in precipitation are −3.51% for GB98, and −2.00% for DM07, as shown in . These results are consistent with the most recent findings by Morrison (Citation2012), who pointed out that aerosol impacts on cumulative surface precipitation are small (generally less than 15%).
Fig. 9. Temporal evolution of the model-estimated domain average accumulated precipitation (mm) in the clean maritime and polluted continental backgrounds for (a) MG07, (b) RL03, (c) GB98 and (d) DM07. The point for time=0 is referred to the start time of simulation.
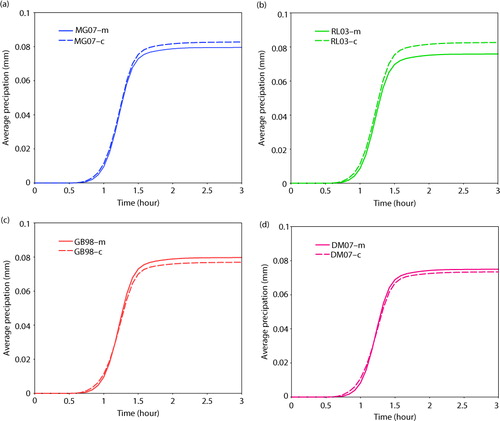
Table 8. Model-estimated domain average accumulated precipitation (mm) obtained during 3 hours of simulations
Hence, one can see that the sign of the surface precipitation response induced by aerosols is dependent on the relationships between the spectral dispersion and the cloud droplet number concentration. When the cloud droplet spectral dispersion is the increasing function of the cloud droplet number concentration (MG07 and RL03), the accumulated total precipitation shows an increase with increasing aerosol concentrations. However, the surface accumulated precipitation is evidently reduced with increasing aerosol concentrations when the spectral dispersion is the decreasing function of the cloud droplet number concentration (including GB98 and DM07).
The mechanisms of the precipitation change with increasing aerosols can be stated as following for these two types of ɛ−N c relationships. The surface cumulative precipitation is increased with increasing aerosols for the ɛ−N c positive relationship. This occurs because the precipitable particles (rain drops) are larger in the continental backgrounds, as compared with that in the maritime background (), which allows these particles to reach the surface faster, decrease the evaporation of the hydrometeors and ultimately increase the surface precipitation. For the ɛ−N c negative relationships, it shows a decreasing precipitation with an increase in aerosols. It should be pointed that the precipitable particles (rain drops) in the continental backgrounds are also larger, but the rain water content are much smaller than that of the ɛ−N c positive relationships (see d). In the polluted background with higher cloud droplet number concentrations, the much steeper slope of the autoconversion rate for the ɛ−N c negative relationships decreased the efficiency of the autoconversion processes (), substantially reduced the rain water (summarised in ) and eventually decreased the surface precipitation.
It is noted that there is a small relative difference of precipitation (−2.0%) between DM07-m and DM07-c cases (d), although for DM07, the corresponding cloud droplet spectral dispersion and autoconversion rate at higher cloud droplet number concentrations are much smaller than those at lower concentrations. It is suggested that, in the clean maritime background, the smaller size of rain drops owing to relatively low efficiency of accretion processes causes a decrease in the surface precipitation and reduces the corresponding difference with that in the polluted continental background.
In order to investigate the robustness of the simulated results about the precipitation change induced by aerosols, we performed a suite of sensitivity experiments with small perturbations to the initial conditions (following Lebo et al., Citation2012 and Morrison, Citation2012). We only made the initial perturbation in the potential temperature (θ′) within the bubble (±0.5 K). shows the model-estimated domain average accumulated precipitation from simulations with maximum θ′ of the thermal to initiate convection of 2.5, 3 and 3.5 K. The results show our results present in this section are robust in a qualitative sense. The small perturbations of the initial thermal only change the magnitude of differences in surface precipitation, but do not affect the sign of these differences. For example, relative difference in precipitation between polluted and clean backgrounds varies from 2.42 to 3.89% for MG07 relationship, and from −3.51 to −5.43% for GB98 relationship.
Table 9. Model-estimated domain average accumulated precipitation (mm) from simulations with maximum θ′ of the thermal to initiate convection of 2.5, 3 and 3.5 K
It is noted that the threshold function T in eq. (5) also can be the Sundqvist-type threshold functions given by8
where the parameter µ (≥0) is introduced as an empirical constant (Liu et al., Citation2006a). Hence, we also carried out a few additional tests with different threshold functions, including µ=2 (Sundqvist et al., Citation1989) and µ= 4 (Del Genio et al., Citation1996). Our results indicate that the surface accumulated precipitation is not sensitive to these different threshold functions, and our above results about the precipitation change induced by aerosols for the different types of ɛ−N c relationships are also true (Figures not shown).
4. Conclusions
The WRF model with the Morrison two-moment bulk microphysics scheme was used to investigate aerosol effects on cloud microphysical properties and surface precipitation, based on the initial sounding data on 31 March 2005 in Beijing. Considering the different ɛ−N c relationships (MG07, RL03, GB98 and DM07), two microphysical situations were conducted: the first with low concentration aerosols (the maritime background), and the second with high concentration aerosols (the continental background).
Results of this study demonstrate that the variation trends of the microphysical properties especially for liquid clouds induced by aerosols are consistent with these four relationships between the spectral dispersion and the cloud droplet number concentration (as summarised in ). Increased aerosol concentrations result in more and smaller cloud droplets with higher cloud water content; aerosols also lead to fewer and larger rain drops with lower rain water content. These results presented here are in good agreement with our current understanding about the impacts of aerosols on cloud microphysical properties (e.g. Li et al., Citation2008; Li et al., Citation2009; Lim and Hong Citation2010; Lim et al. Citation2011; Xie and Liu Citation2011). On the other hand, it is shown that the sign of the surface precipitation response induced by aerosols is also dependent on the ɛ−N c relationships, which can affect the autoconversion processes from cloud droplets to rain drops. The surface cumulative precipitation is increased by 3.89% and 8.83% with aerosol concentrations from the clean maritime background to the polluted continental background when the cloud droplet spectral dispersion is the increasing function of the cloud droplet number concentration (MG07 and RL03). It is suggested that the large-sized rain drops at high aerosol concentrations enhance the surface precipitation. When the spectral dispersion is the decreasing function of N c , including GB98 and DM07, the surface precipitation is slightly reduced by 3.51 and 2.00%, respectively, with increasing aerosols. The mechanisms that lead to this decreasing precipitation with an increase in aerosols can be stated as follows. Under conditions of a higher aerosol concentration, the smaller spectral dispersion lowered the efficiency of autoconversion processes, reduced the rain water content and eventually caused a decrease in the surface precipitation. The mechanism controlling the surface precipitation response to aerosols here is speculative, there are many other interactions that could be involved (e.g. via the ice phase). In addition, our results presented here are consistent with the latest research findings, which show differences in the surface precipitation between polluted and pristine conditions are small, with relative differences generally less than 15% (Morrison, Citation2012). However, it is important to point out that additional simulations with small perturbations to the initial thermal (±0.5 K) show that our findings are robust in a qualitative sense.
It has been suggested that various environmental parameters, for example, CAPE (Storer et al., Citation2010), relative humidity (Khain et al., Citation2005; Lynn et al., Citation2007; Tao et al., Citation2007; Fan et al., Citation2007a; Lee, Citation2011) and vertical wind shear (Fan et al., Citation2009) may influence the aerosol-induced effect on the surface precipitation. However, this study does not focus on the different environmental conditions on aerosol-cloud-precipitation interactions. In addition, the variations of CAPE, relative humidity and wind shear may lead to the distinct effect of aerosols on precipitation for the various ɛ−N c relationships.
It is also noteworthy that the cloud droplet spectral dispersion is better parameterised in terms of the specific cloud water content (described as the ratio of the liquid water content to the droplet concentration) than the cloud droplet number concentration in some observational studies (Wood, Citation2000; Liu et al., Citation2008; Martins and Silva Dias, Citation2009). It will be interesting to carry out the corresponding numerical experiments with the relationships between the spectral dispersion and the specific cloud water content.
The results presented here indicate the importance of ɛ−N c relationship in the sign of the aerosols-induced precipitation change. However, we do not test which kind of the ɛ−N c relationships (including MG07, RL03, GB98, DM07 or other relationships) can better describe the nature of these convective clouds used here. For any cloud type, including convective clouds, it is believed that using the in-situ aircraft observations for cloud droplet size distribution (Brenguier et al., Citation2011) and bin model results (Lu and Seinfeld, Citation2006; Chen et al., Citation2011) are good ways to derive the accurate ɛ−N c relationships, which may improve the understanding of aerosol-cloud-precipitation interactions.
Acknowledgements
The authors acknowledge the two anonymous reviewers for their constructive comments that helped greatly to improve the manuscript. This work was jointly supported by the CAS Strategic Priority Research Program (XDA05110101), the National Basic Research Program of China (2011CB403406) and the National Natural Science Foundation of China (41105071, 41290255).
References
- Albrecht B. A. Aerosols, cloud microphysics and fractional cloudiness. Science. 1989; 245: 1227–1230. 10.3402/tellusb.v65i0.19054.
- Altaratz O, Koren I, Reisin T, Kostinski A, Feingold G, co-authors. Aerosols’ influence on the interplay between condensation, evaporation and rain in warm cumulus cloud. Atmos. Chem. Phys. 2008; 8: 15–24. 10.3402/tellusb.v65i0.19054.
- Berg, W, L'Ecuyer, T and van den Heever, S. 2008. Evidence for the impact of aerosols on the onset and microphysical properties of rainfall from a combination of satellite observations and cloud-resolving model simulations. J. Geophys. Res. 113: D14S23. DOI: 10.3402/tellusb.v65i0.19054.
- Brenguier, J.-L, Burnet, F and Geoffroy, O. 2011. Cloud optical thickness and liquid water path does the k coefficient vary with droplet concentration?. Atmos. Chem. Phys. 11: 9771–9786. DOI: 10.3402/tellusb.v65i0.19054.
- Chen Y, Penner J. E. Uncertainty analysis for estimates of the first indirect aerosol effect. Atmos. Chem. Phys. 2005; 5: 2935–2948. 10.3402/tellusb.v65i0.19054.
- Chen, Y.-C, Xue, L, Lebi, Z. J, Wang, H, Rasmussen, R. M. and co-authors. 2011. A comprehensive numerical study of aerosol-cloud-precipitation interactions in marine stratocumulus. Atmos. Chem. Phys. 11: 9749–9769. DOI: 10.3402/tellusb.v65i0.19054.
- Cheng, C.-T, Wang, W.-C and Chen, J.-P. 2007. A modeling study of aerosol impacts on cloud microphysics and radiative properties. Q. J. R. Meteorol. Soc. 133: 283–297. DOI: 10.3402/tellusb.v65i0.19054.
- Cui, Z, Carslaw, K. S, Yin Y and Davies, S. 2006. A numerical study of aerosol effects on the dynamics and microphysics of a deep convective cloud in a continental environment. J. Geophys. Res. 111: D05201. DOI: 10.3402/tellusb.v65i0.19054.
- Daum, P. H, Liu, Y, McGraw, R. L, Lee, Y, Wang, J. and co-authors. 2007. Microphysical properties of stratus/stratocumulus clouds during the 2005 marine stratus/stratocumulus experiment (MASE). Report BNL-77935-2007-JA, Brookhaven National Laboratory, Upton, NY.
- Del Genio A. D, Yao M, Kovari W, Lo K. K. A prognostic cloud water parameterization for climate models. J. Clim. 1996; 9: 270–304.
- Fan, J, Yuan, T, Comstock, J. M, Ghan, S, Khain, A. and co-authors. 2009. Dominant role by vertical wind shear in regulating aerosol effects on deep convective clouds. J. Geophys. Res. 114: D22206. DOI: 10.3402/tellusb.v65i0.19054.
- Fan, J, Zhang, R, Li, G and Tao, W.-K. 2007a. Effects of aerosols and relative humidity on cumulus clouds. J. Geophys. Res. 112: D14204. DOI: 10.3402/tellusb.v65i0.19054.
- Fan, J, Zhang, R, Li, G, Tao, W.-K and Li, X. 2007b. Simulations of cumulus clouds using a spectral microphysics cloud-resolving model. J. Geophys. Res. 112: D04201. DOI: 10.3402/tellusb.v65i0.19054.
- Grabowski W. W. Toward cloud resolving modeling of large-scale tropical circulations: a simple cloud microphysics parameterization. J. Atmos. Sci. 1998; 55: 3283–3298.
- van den Heever S. C, Carrió G. G, Cotton W. R, DeMott P. J, Prenni A. J. Impacts of nucleating aerosol on florida storms. Part I: Mesoscale simulations. J. Atmos. Sci. 2006; 63: 1752–1775. 10.3402/tellusb.v65i0.19054.
- van den Heever S. C, Cotton W. R. Urban aerosol impacts on downwind convective storms. J. Appl. Meteorol. Clim. 2007; 46: 828–850. 10.3402/tellusb.v65i0.19054.
- van den Heever, S. C, Stephens, G. L and Wood, N. B. 2011. Aerosol indirect effects on tropical convection characteristics under conditions of radiative-convective equilibrium. J. Atmos. Sci. 68: 699–718. DOI: 10.3402/tellusb.v65i0.19054.
- Hobbs, P. V. 1993. Aerosol-Cloud-Climate Interactions. Academic Press, San Diego, Calif,.233. pp.
- Khain, A, Ovtchinnikov, M, Pinsky, M, Pokrovsky, A and Krugliak, H. 2000. Notes on the state-of-the-art numerical modeling of cloud microphysics. Atmos. Res. 55: 159–224. DOI: 10.3402/tellusb.v65i0.19054.
- Khain A, Pokrovsky A. Simulation of effects of atmospheric aerosols on deep turbulent convective clouds using a spectral microphysics mixed-phase cumulus cloud model. Part II: sensitivity study. J. Atmos. Sci. 2004; 61: 2983–3001. 10.3402/tellusb.v65i0.19054.
- Khain A, Pokrovsky A, Pinsky M, Seifert A, Phillips V. Simulation of effects of atmospheric aerosols on deep turbulent convective clouds using a spectral microphysics mixed-phase cumulus cloud model. Part I: model description and possible applications. J. Atmos. Sci. 2004; 61: 2963–2982. 10.3402/tellusb.v65i0.19054.
- Khain A, Rosenfeld D, Pokrovsky A. Aerosol impact on the dynamics and microphysics of deep convective clouds. Q. J. R. Meteorol. Soc. 2005; 131: 2639–2663. 10.3402/tellusb.v65i0.19054.
- Khain, A. P, BenMoshe, N and Pokrovsky, A. 2008. Factors determining the impact of aerosols on surface precipitation from clouds: an attempt at classification. J. Atmos. Sci. 65: 1721–1748. DOI: 10.3402/tellusb.v65i0.19054.
- Khairoutdinov M, Kogan Y. A new cloud physics parameterization in a large-eddy simulation model of marine stratocumulus. Mon. Wea. Rev. 2000; 128: 229–243.
- Lebo, Z. J, Morrison, H and Seinfeld, J. H. 2012. Are simulated aerosol-induced effects on deep convective clouds strongly dependent on saturation adjustment?. Atmos. Chem. Phys. 12: 9941–9964. DOI: 10.3402/tellusb.v65i0.19054.
- Lebo, Z. J and Seinfeld, J. H. 2011. Theoretical basis for convective invigoration due to increased aerosol concentration. Atmos. Chem. Phys. 11: 5407–5429. DOI: 10.3402/tellusb.v65i0.19054.
- Lee, S. S. 2011. Dependence of aerosol-precipitation interactions on humidity in a multiple-cloud system. Atmos. Chem. Phys. 11: 2179–2196. DOI: 10.3402/tellusb.v65i0.19054.
- Li, G, Wang, Y, Lee, K.-H, Diao, Y and Zhang, R. 2009. Impacts of aerosols on the development and precipitation of a mesoscale squall line. J. Geophys. Res. 114: D17205. DOI: 10.3402/tellusb.v65i0.19054.
- Li, G, Wang, Y and Zhang, R. 2008. Implementation of a two-moment bulk microphysics scheme to the WRF model to investigate aerosol-cloud interaction. J. Geophys. Res. 113: D15211. DOI: 10.3402/tellusb.v65i0.19054.
- Lim, K.-S. S and Hong, S.-Y. 2010. Development of an effective double-moment cloud microphysics scheme with prognostic Cloud Condensation Nuclei (CCN) for weather and climate models. Mon. Wea. Rev. 138: 1587–1612. DOI: 10.3402/tellusb.v65i0.19054.
- Lim, K.-S. S, Hong, S.-Y, Yum, S. S, Dudhia, J and Klemp, J. B. 2011. Aerosol effects on the development of a supercell storm in a double-moment bulk-cloud microphysics scheme. J. Geophys. Res. 116: D02204. DOI: 10.3402/tellusb.v65i0.19054.
- Liu Y, Daum P. H. Indirect warming effect from dispersion forcing. Nature. 2002; 419: 580–581. 10.3402/tellusb.v65i0.19054.
- Liu Y, Daum P. H. Parameterization of the autoconversion process. Part I: analytical formulation of the Kessler-type parameterizations. J. Atmos. Sci. 2004; 61: 1539–1548.
- Liu, Y, Daum, P. H, Guo, H and Peng, Y. 2008. Dispersion bias, dispersion effect and aerosol-cloud conundrum. Environ. Res. Lett. 3: 045021. DOI: 10.3402/tellusb.v65i0.19054.
- Liu, Y, Daum, P. H and McGraw, R. L. 2005. Size truncation effect, threshold behavior, and a new type of autoconversion parameterization. Geophys. Res. Lett. 32: L11811. DOI: 10.3402/tellusb.v65i0.19054.
- Liu Y, Daum P. H, McGraw R, Miller M. Parameterization of the autoconversion process. Part II: generalization of Sundqvist-type parameterizations. J. Atmos. Sci. 2006a; 63: 1103–1109. 10.3402/tellusb.v65i0.19054.
- Liu, Y, Daum, P. H and Yum, S. S. 2006b. Analytical expression for the relative dispersion of the cloud droplet size distribution. Geophys. Res. Lett. 33: L02810. DOI: 10.3402/tellusb.v65i0.19054.
- Lu, M.-L and Seinfeld, J. H. 2006. Effect of aerosol number concentration on cloud droplet dispersion: a large-eddy simulation study and implications for aerosol indirect forcing. J. Geophys. Res. 111: D02207. DOI: 10.3402/tellusb.v65i0.19054.
- Lynn B, Khain A, Dudhia J, Rosenfeld D, Povrovsky A, co-authors B. Spectral (bin) microphysics coupled with a mesoscale model (MM5). Part I: model description and first results. Mon. Weather Rev. 2005; 133: 44–58. 10.3402/tellusb.v65i0.19054.
- Lynn, B, Khain, A, Rosenfeld, D and Woodley, W. L. 2007. Effects of aerosols on precipitation from orographic clouds. J. Geophys. Res. 112: D10225. DOI: 10.3402/tellusb.v65i0.19054.
- Ma, J, Chen, Y, Wang, W, Yan, P, Liu, H. and co-authors. 2010. Strong air pollution causes widespread haze-clouds over china. J. Geophys. Res. 115: D18204. DOI: 10.3402/tellusb.v65i0.19054.
- Martin G. M, Johnson D. W, Spice A. The measurement and parameterization of effective radius of droplets in warm stratocumulus clouds. J. Atmos. Sci. 1994; 51: 1823–1842.
- Martins, J. A and Silva Dias, M. A. F. 2009. The impact of smoke from forest fires on the spectral dispersion of cloud droplet size distributions in the Amazonian region. Environ. Res. Lett. 4: 015002. DOI: 10.3402/tellusb.v65i0.19054.
- Miles N, Verlinde J, Clothiaux E. Cloud droplet size distributions in low-level stratiform clouds. J. Atmos. Sci. 2000; 57: 295–311.
- Morrison, H. 2012. On the robustness of aerosol effects on an idealized supercell storm simulated with a cloud system-resolving model. Atmos. Chem. Phys. 12: 7689–7705. DOI: 10.3402/tellusb.v65i0.19054.
- Morrison H, Curry J. A, Khvorostyanov V. I. A new double-moment microphysics parameterization for application in cloud and climate models. Part I: description. J. Atmos. Sci. 2005; 62: 1665–1677. 10.3402/tellusb.v65i0.19054.
- Morrison H, Grabowski W. W. Comparison of bulk and bin warm-rain microphysics models using a kinematic framework. J. Atmos. Sci. 2007; 64: 2839–2861. 10.3402/tellusb.v65i0.19054.
- Morrison H, Thompson G, Tatarskii V. Impact of cloud microphysics on the development of trailing stratiform precipitation in a simulated squall line: comparison of one- and two-moment schemes. Mon. Weather Rev. 2009; 137: 991–1007. 10.3402/tellusb.v65i0.19054.
- Pawlowska H, Brenguier J.-L. Microphysical properties of stratocumulus clouds during ACE-2. Tellus B. 2000; 52: 868–887. 10.3402/tellusb.v65i0.19054.
- Pawlowska, H, Grabowski, W. W and Brenguier, J.-L. 2006. Observations of the width of cloud droplet spectra in stratocumulus. Geophys. Res. Lett. 33: L19810. DOI: 10.3402/tellusb.v65i0.19054.
- Peng, Y and Lohmann, U. 2003. Sensitivity study of the spectral dispersion of the cloud droplet size distribution on the indirect aerosol effect. Geophys. Res. Lett. 30(10): 1507. DOI: 10.3402/tellusb.v65i0.19054.
- Peng, Y, Lohmann, U, Leaitch, R and Kulmala, M. 2007. An investigation into the aerosol dispersion effect through the activation process in marine stratus clouds. J. Geophys. Res. 112: D11117. DOI: 10.3402/tellusb.v65i0.19054.
- Pruppacher, H. R and Klett, J. D. 1997. Microphysics of Clouds and Precipitation. Kluwer Academic, Dordrecht and Boston.,954. pp.
- Ramanathan V, Crutzen P. J, Kiehl J. T, Rosenfeld D. Aerosols, climate, and the hydrological cycle. Science. 2001; 294: 2119–2124. 10.3402/tellusb.v65i0.19054.
- Rosenfeld, D. 1999. TRMM observed first direct evidence of smoke from forest fires inhibiting rainfall. Geophys. Res. Lett. 26: 3105–3108. DOI: 10.3402/tellusb.v65i0.19054.
- Rosenfeld, D, Lohmann U, Raga, G. B, O'Dowd, C. D, Kulmala, M. and co-authors. 2008. Flood or drought: how do aerosols affect precipitation?. Science. 321: 1309., DOI: 10.3402/tellusb.v65i0.19054.
- Rotstayn L. D, Liu Y. Sensitivity of the first indirect aerosol effect to an increase of cloud droplet spectral dispersion with droplet number concentration. J Clim. 2003; 16: 3476–3481.
- Rotstayn, L. D and Liu, Y. 2005. A smaller global estimate of the second indirect aerosol effect. Geophys. Res. Lett. 32: L05708. DOI: 10.3402/tellusb.v65i0.19054.
- Rudich, Y, Rosenfeld, D and Khersonsky, O. 2002. Treating clouds with a grain of salt. Geophys. Res. Lett. 29(22): 2060. DOI: 10.3402/tellusb.v65i0.19054.
- Seifert, A and Beheng, K. D. 2006. A two-moment cloud microphysics parameterization for mixed-phase clouds. Part II: maritime vs. continental deep convective storms. Meteorol. Atmos. Phys. 92: 67–82. DOI: 10.3402/tellusb.v65i0.19054.
- Shepherd J. M, Burian S. J. Detection of urban-induced rainfall anomalies in a major coastal city. Earth Interactions. 2003; 7: 1–14.
- Simpson J, Wiggert V. Models of precipitating cumulus towers. Mon. Wea. Rev. 1969; 97: 471–489.
- Skamarock, W. C, Klemp, J. B, Dudhia, J, Gill, D. O, Barker, D. M. and co-authors. 2005. A description of the advanced research WRF Version 2. NCAR Tech. Note NCAR-TN-468+STR, 113. pp.
- Squires P. The microstructure and colloidal stability of warm clouds. I. The relation between structure and stability. Tellus. 1958; 10: 256–271. 10.3402/tellusb.v65i0.19054.
- Storer, R. L, van den Heever, S. C and Stephens, G. L. 2010. Modeling aerosol impacts on convective storms in different environments. J. Atmos. Sci. 67: 3904–3915. DOI: 10.3402/tellusb.v65i0.19054.
- Sundqvist H, Berge E, Kristjansson J. E. Condensation and cloud parameterization studies with a mesoscale numerical weather prediction model. Mon. Wea. Rev. 1989; 117: 1641–1657.
- Tao, W.-K, Chen, J.-P, Li, Z, Wang, C and Zhang, C. 2012. Impact of aerosols on convective clouds and precipitation. Rev. Geophys. 50: RG2001. DOI: 10.3402/tellusb.v65i0.19054.
- Tao, W.-K, Li, X, Khain, A, Matsui, T, Lang, S. and co-authors. 2007. Role of atmospheric aerosol concentration on deep convective precipitation: Cloud-resolving model simulations. J. Geophys. Res. 112: D24S18. DOI: 10.3402/tellusb.v65i0.19054.
- Teller A, Levin Z. The effects of aerosols on precipitation and dimensions of subtropical clouds: a sensitivity study using a numerical cloud model. Atmos. Chem. Phys. 2006; 6: 67–80. 10.3402/tellusb.v65i0.19054.
- Twomey S. A. The influence of pollution on the shortwave albedo of clouds. J. Atmos. Sci. 1977; 34: 1149–1152.
- Wang, C. 2005. A modeling study of the response of tropical deep convection to the increase of cloud condensation nuclei concentration: 1. Dynamics and microphysics. J. Geophys. Res. 110: D21211. DOI: 10.3402/tellusb.v65i0.19054.
- Wang, X, Xue, H, Fang, W and Zheng, G. 2011. A study of shallow cumulus cloud droplet dispersion by large eddy simulations. Acta Meteor. Sinica. 25(2): 166–175. DOI: 10.3402/tellusb.v65i0.19054.
- Wood R. Parametrization of the effect of drizzle upon the droplet effective radius in stratocumulus clouds. Q. J. R. Meteorol. Soc. 2000; 126: 3309–3324. 10.3402/tellusb.v65i0.19054.
- Xie, X. N and Liu, X. D. 2009. Analytical three-moment auto conversion parameterization based on generalized gamma distribution. J. Geophys. Res. 114: D17201. DOI: 10.3402/tellusb.v65i0.19054.
- Xie, X. N and Liu, X. D. 2011. Effects of spectral dispersion on clouds and precipitation in mesoscale convective systems. J. Geophys. Res. 116: D06202. DOI: 10.3402/tellusb.v65i0.19054.
- Yin Y, Levin Z, Reisin T, Tzivion S. The effects of giant cloud condensational nuclei on the development of precipitation in convective clouds: a numerical study. Atmos. Res. 2000; 53: 91–116. 10.3402/tellusb.v65i0.19054.
- Yin, Y, Wurzler, S, Levin, Z and Reisin, T. G. 2002. Interactions of mineral dust particles and clouds: effects on precipitation and cloud optical properties. J. Geophys. Res. 107(D23): 4724. DOI: 10.3402/tellusb.v65i0.19054.
- Yum S. S, Hudson J. G. Adiabatic predictions and observations of cloud droplet spectral broadness. Atmos. Res. 2005; 73: 203–223. 10.3402/tellusb.v65i0.19054.
- Zhao, C, Tie, X, Brasseur, G, Noone, K. J, Nakajima, T. and co-authors. 2006. Aircraft measurements of cloud droplet spectral dispersion and implications for indirect aerosol radiative forcing. Geophys. Res. Lett. 33: L16809. DOI: 10.3402/tellusb.v65i0.19054.