
Abstract
The effectiveness of DNA damaging chemotherapy drugs can be limited by activation of survival signaling pathways and cell cycle checkpoints that allow DNA repair. Targeting survival pathways and inhibiting cell cycle checkpoints may increase chemotherapy-induced cancer cell killing. AKT and Chk1 are survival and cell cycle checkpoint kinases, respectively, that can be activated by DNA damage. Cisplatin (CP) is a standard chemotherapy agent for osteosarcoma (OS). CP induced apoptosis to varying extents and activated AKT and Chk1 in multiple p53 wild-type and p53-null OS cell lines. A Chk1 inhibitor increased CP-induced apoptosis in all OS cell lines regardless of p53 status. In contrast, an AKT inhibitor increased CP-induced apoptosis only in p53 wild-type OS cells, but not p53 nulll cells. The increased apoptosis in p53 wild-type cells was coincident with decreased p53 protein levels, but increased expression of p53-responsive apoptotic genes Noxa and PUMA. Further studies revealed the inability of AKT inhibitor to CP-sensitize p53-null OS cells resulted from 2 things: 1) AKT inhibition stabilized/maintained p27 levels in CP-treated cells, which then mediated a protective G1-phase cell cycle arrest, 2) AKT inhibition increased the levels of activated Chk1. Finally, schedule dependent inhibition of AKT and Chk1 evaded the protective G1 arrest mediated by p27 and maximized CP-induced OS cell killing. These data demonstrate AKT and Chk1 activation promote survival in CP-treated OS cells, and that strategic, scheduled targeting of AKT and Chk1 can maximize OS cell killing by CP.
Abbreviations
| Chk1 | = | Checkpoint kinase 1 |
| CDC2 | = | cell division cycle kinase 2 |
| mTORC1 and mTORC2 | = | mammalian target of rapamycin complex 1 and 2 |
Introduction
Radiation and most anti-cancer therapy agents damage, modify, and/or break DNA. Highly proliferative cancer cells are especially sensitive to these agents since cell-cycle progression and division with damaged/broken chromosomes can trigger and/or amplify apoptotic pathways and post-mitotic death.Citation1,2 However, DNA damage can also activate survival signaling pathways that may limit cancer cell killing by counteracting apoptosis.Citation3-5 In addition, DNA damage can activate cell cycle checkpoint responses that arrest cells in G1 and G2-phase.Citation6 These arrests can limit killing by DNA damaging agents by allowing cancer cells time to repair damage to their DNA before proceeding with either replicative DNA synthesis or mitosis.Citation1,6 Thus, targeting survival pathways or blocking cell cycle arrest can enhance cancer cell killing by DNA damaging therapies.
Cellular responses to DNA damage are coordinated the p53 tumor suppressor protein and 2 distinct kinase signaling cascades, the ATM-Chk2 and ATR-Chk1 pathways. DNA double strand breaks activate the ATM-Chk2 pathway and trigger the stabilization and activation of p53.Citation6 Activated p53 can promote a G1 cell cycle arrest by activating expression of p21, a potent inhibitor of G1-phase cyclin-Cdk complexes.Citation7,8 P53 can also trigger apoptosis when DNA damage is excessive or irreparable.Citation9,10 The ATR-Chk1 pathway is activated in response to stalled DNA replication forks and DNA damaging stresses that expose single-strand DNA tracts.Citation6 Chk1 is thought to function in the S-phase checkpoint by blocking DNA synthesis and preventing DNA replication fork collapse in DNA damaged cells.Citation11,12 Chk1 also plays an important role in the G2 arrest activated by DNA damage.Citation13,14 Passage from G2 into mitosis requires Cyclin B/Cdc2 activity. Cdc2 is inactivated through phosphorylation at Tyrosine 15 (Tyr15) by Wee1 kinase.Citation15 The phosphatase Cdc25 activates Cdc2 by dephosphorylating Tyr15. Chk1 phosphorylation activates Wee1 and inhibits Cdc25,Citation16,17 thus inhibiting Cyclin B/Cdc2 activity and arresting cells in G2 phase. While p53 is not required to initiate a G2 arrest after DNA damage, it can help maintain the G2 arrest by contributing to Cyclin B/Cdc2 inhibition via induction of p21 and 14-3-3.Citation18-20 A number of small molecule Chk1 inhibitors have been developed and tested in combination with DNA damaging therapeutics. By abrogating the Chk1-dependent S-phase and G2-phase arrests, these inhibitors can inappropriately force therapy-treated cells to replicate their DNA and/or enter mitosis with damaged and/or broken chromosomes, culminating in cell death.Citation21 P53-null cells are especially sensitive to therapeutic strategies that combine DNA damaging agents with Chk1 inhibitors.Citation22
AKT is a key regulator of cell survival activated downstream of growth factor receptors by phosphorylation at 2 sites: Threonine 308 (T308) in AKT is phosphorylated by PDK1, and Serine 473 (S473) is phosphorylated by mTORC2.Citation23 Activated AKT promotes survival by phosphorylating and inhibiting/promoting the activity of various pro- and anti-apoptotic factors.Citation24-27 DNA damage can also activate AKT. For example, DNA-PK activated by DNA double strand breaks can activate AKT by direct phosphorylation at S473.Citation28 DNA damage has also been reported to activate growth factor signaling (e.g., EGFR, IGFR) and EGFR/IGFR-dependent phosphorylation and activation of AKT.Citation29-31 Small molecule inhibitors of AKT have been developed and shown to enhance cancer cell killing by various DNA damaging therapeutic agents.Citation32 Notably, however, there is crosstalk between AKT and both the ATR-Chk1 pathway and the G1-arrrest machinery that could influence the effectiveness of AKT inhibitors. For example, activated AKT can phosphorylate Chk1 at Serine-280 (S280) and inhibit Chk1 activity.Citation33,34 This suggests AKT inhibition could increase the activity of Chk1 in DNA damaged cells, potentially increasing the cell protective G2 arrest mediated by Chk1. In addition, activated AKT can phosphorylate and promote the degradation of p27,Citation35,36 a protein that like p21 can bind and potently inhibit the activity of G1 cyclin-cdk complexes, leading to G1 arrest. In light of this, one possibility is that AKT inhibition could stabilize p27 in therapy treated cancer cells, leading to a G1 arrest that could limit cancer cell killing.
Osteosarcoma (OS) is an aggressive bone cancer that primarily affects children and young adults. Standard OS treatment includes pre- and post-operative chemotherapy and aggressive surgical resection.Citation37 Nonetheless, nearly 30% of patients with localized disease and 80% of patients with metastatic disease at diagnosis will fail therapy and die due to tumor recurrence/relapse.Citation37 The primary reason for treatment failure is the development of tumor therapy resistance. Thus, it is important to develop treatment strategies that enhance killing of primary and therapy-resistant OS. Cisplatin (CP) is a standard OS therapy agent that causes DNA crosslinks, stabilizes p53, and activates the ATM-Chk2 and ATR-Chk1 DNA damage response pathways. In this study, CP induced apoptosis to varying extents and activated AKT and Chk1 in multiple p53 wild-type and p53-null OS cell lines. A Chk1 inhibitor increased CP-induced apoptosis in all OS cell lines regardless of p53 status. In contrast, an AKT inhibitor increased CP-induced apoptosis only in p53 wild-type OS cells, but not p53-nulll cells. The increased apoptosis in p53 wild-type cells was coincident with increased expression of p53-responsive apoptotic genes Noxa and PUMA. In p53-null OS cells, CP treatment alone caused a pronounced decrease in p27 protein levels. The inability of AKT inhibitor to CP-sensitize p53-null OS cells appeared to result from 2 things: 1) AKT inhibition stabilized/maintained p27 levels in CP-treated cells, which then mediated a protective G1 arrest, 2) AKT inhibition increased the levels of activated Chk1. Finally, we found that schedule dependent inhibition of AKT and Chk1 prevented the protective G1 arrest mediated by p27 and maximized CP-induced killing. These data demonstrate AKT and Chk1 activation promote survival in CP-treated OS cells, and that strategic, scheduled targeting of AKT and Chk1 can maximize OS cell killing by CP.
Materials and Methods
Cells and reagents
SJSA1, MHM, U2OS, MG63, and SAOS cells were obtained from ATCC. SJSA1 and MHM cells were grown in RPMI medium, U2OS and MG63 in DMEM medium, and SAOS cells in McCoy's 5A medium with 10% fetal bovine serum (FBS), penicillin (100 U/mL) and streptomycin (100 μg/mL). Cells were plated 48 h before being treated with Cisplatin (Bedford Laboratory) at the indicated concentrations. MK2206 and LY2603618 were obtained from Selleck Chemicals. For colony formation studies, U2OS cells were plated at 1.0 × 10⁶ cells/100 mm dish for 24 hrs, and then treated with 7.5, 10, or 15 μM CP, 10 μM MK2206, and/or 0.2 μM LY2603618 simultaneously or 24 hours after CP treatment for a total of 72 hrs. After 72 hrs, the cells were rinsed 3 times with PBS and then complete media was added. Cells were allowed to grow for 2 weeks and the plates were then stained with 0.05% Crystal Violet to demonstrate colony formation. MG63 and SAOS cells were plated at 1.0 × 10⁵ cells/well in 6-well dishes and allowed to attach for 48 hrs. MG63 were then treated with 2.5 or 5 μM CP with the above mentioned MK-2206 and LY2603618. SAOS were treated with 1 or 2 μM CP with the above mentioned MK-2206 and LY2603618 doses.
Immunoblotting
Whole cell extracts were prepared by scraping cells in lysis buffer (150 mM NaCl, 5 mM EDTA, 0.5% NP40, 50 mM Tris, pH 7.5), resolved by sodium dodecyl sulfate polyacrylamide gel electrophoresis (SDS-PAGE) and transferred to polyvinylidene difluoride membranes (NEN Life Science Products). Antibodies to p-AKT (S473), pan AKT, p-Chk1 (S296 and S345), Chk1 (2G1D5), p-Chk2, Chk2 (D9C6), and p27kip were from Cell Signaling; p53 (DO-1) was from Santa Cruz. Primary antibodies were detected with goat anti-mouse or goat anti-rabbit secondary antibodies conjugated to horseradish peroxidase (Jackson ImmunoResearch), using enhanced chemiluminescence (BIO-RAD).
Flow cytometry
For cell cycle analysis, cells were harvested and fixed in 25% ethanol overnight. The cells were then stained with propidium iodide (25 μg/mL,Calbiochem). Flow cytometry analysis was performed on a GalliosTM Flow Cytometer (Becton Dickinson), analyzed with CellQuest (Becton Dickinson) and FlowJo 108.7 (Treestar Inc.). For each sample, 10,000 events were collected.
siRNA-mediated transient knockdown
Noxa, Puma, p53, p27 RNAi (On-target plus smart pool) and Control RNAi (On-target plus siControl non-targeting pool) were purchased from Dharmacon and were transfected according to the manufacturer's guidelines using DharmaFECT I reagent.
shRNA-mediated stable knockdown
The lentiviral pLKO p53 shRNA was describedCitation38 (Addgene plasmid 25637 deposited by Dr. Waldman); the lentiviral packaging and envelop vectors psPAX2 and pMD2G (Addgene plasmid 12260 and 12259 deposited by Dr. Didier Trono) and the pLKO-control shRNACitation39 (Addgene plasmid 1864 deposited by Dr. David M. Sabatini) were obtained from Addgene plasmid repository. Lentiviral supernatants for the expression of shRNAs were generated from 293FT cells using psPAX2 and pMD2G packaging and envelope vectors according to the OpenBiosystems protocol. U2OS cells were infected and selected with puromycin (2 μg/ml) for 3 d to establish polyclonal lines.
RNA isolation and real-time quantitative PCR analysis
Total RNA was prepared using Total RNA Mini Kit (IBI Scientific, IA); the first cDNA strand was synthesized using High Capacity cDNA Reverse Transcription Kit (Applied Biosystems, CA). Manufacturers’ protocols were followed in each case. The PCR primers for NOXA are TGGAAGTCGAGTGTGCTACTCAACT and AGATTCAGAAGTTTCTGCCGGAA, for PUMA are GACCTCAACGCACAGTA and CTAATTGGGCTCCATCT, for β-actin are TCGTGCGTGACATTAAGGAG and GTCAGGCAGCTCGTAGCTCT. SYBR green PCR kit (Applied Biosystems) was used according to the manufacturer's instructions. AB7500 system (in 9600 emulation mode) was used as follows: activation at 95°C; 2 minutes, 40 cycles of denaturation at 95°C; 15 seconds and annealing/extension at 60°C; 60 seconds, followed by melt analysis ramping from 60°C to 95°C. Relative gene expression was determined by the ΔΔCt method using β-Actin to normalize.
Results
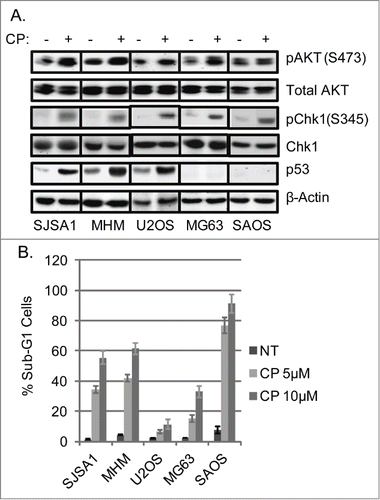
AKT is activated by phosphorylation at S473 and Chk1 is activated by phosphorylation at S345.Citation40,41 We wished to ask if Cisplatin (CP) treatment activates AKT and Chk1 in osteosarcoma (OS) cell lines. To this end, we monitored levels of activated AKT and Chk1 in 5 different OS cell lines treated with CP. This included cell lines that express wild-type p53 (U2OS, MHM, SJSA1) and cell lines that lack p53 expression (MG63, SAOS). pAKT(S473) and pChk1(S345) levels were increased by CP treatment in each of the 5 cell lines (), demonstrating CP promotes activation of AKT and Chk1 in OS cells. Notably, pAKT(S473) levels were only subtly induced by CP in SAOS cells, and these cells were also the most sensitive to CP-induced apoptosis (), implying AKT activation may enhance survival in CP treated OS cells.
Figure 1. Cisplatin (CP) activates AKT and Chk1 in OS cells. (A) OS cells lines were treated with CP (5 μM for SJSA1 and MG63, 10 μM for MHM and U2OS, 2 μM for SAOS) for 48 hours. Whole cell lysates were immunoblotted for pAKT (S473), total AKT, pChk1 (S345), Chk1, p53, and β-actin. (B) The cells were treated with indicated doses of CP for 72 hours and analyzed with FACS for sub-G1 apoptosis. Average percent apoptotic cells from triplicate were presented as a graph with standard deviation indicated. (Representative of at least 3 independent experiments).
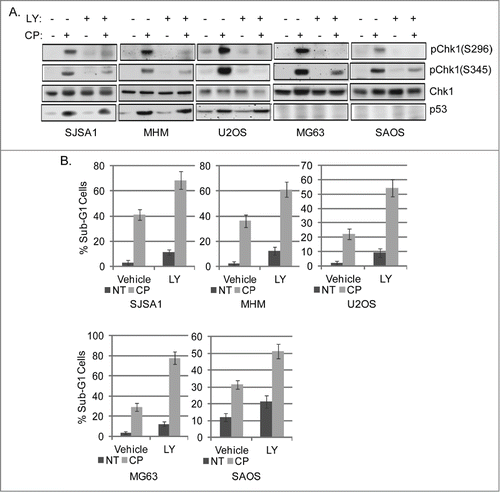
Current models suggest Chk1 activation occurs through sequential phosphorylations: ATR initiates Chk1 activation by phosphorylating Chk1 at S345 and S317, and this is followed by autophosphorylation at S296, which further stimulates Chk1 activity.Citation42 We wished to ask if Chk1 and/or AKT activation promote survival in CP-treated OS cells. First, OS cells were treated with CP alone or in combination with the Chk1 inhibitor LY260318 (hereafter referred to as LY). Apoptosis was monitored by the percent sub-G1 cells, and pChk1(S345) and pChk1(S296) levels were monitored by immunoblotting. As shown in , LY blocked/reduced levels of pChk1(S345) and pChk1(S296), and increased CP-induced killing in all 5 OS cell lines. These results suggest Chk1 activation promotes survival in CP treated OS cells, and that inhibiting Chk1 can increase CP-induced apoptosis.
Figure 2. Chk1 inhibitor sensitizes OS cells to cisplatin. (A) OS cells lines were treated with CP (5 μM for SJSA1 and MG63, 10 μM for MHM and U2OS, 2 μM for SAOS) for 48 hours. Whole cell lysates were immunoblotted for pChk1 (S296 and S345), Chk1, p53, and β-actin. (B) The cells were treated with CP (5 μM for SJSA1 and MG63, 10 μM for MHM, 15 μM for U2OS, 2 μM for SAOS) and LY2603618 (LY, 0.2 μM) singly or combined for 72 hours and analyzed with FACS for sub-G1 apoptosis. Average percent apoptotic cells from triplicate were presented as a graph with standard deviation indicated. There is significant difference between CP and CP plus LY (p < 0.001) in all the cell lines. (Representative of at least 3 independent experiments).
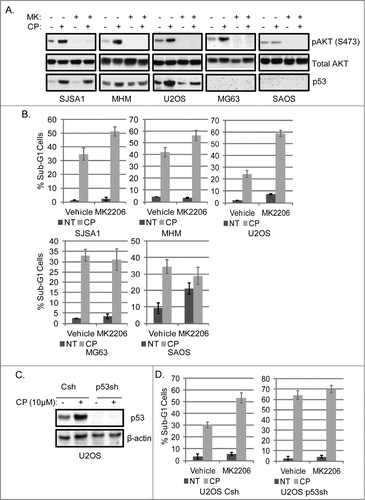
Next, OS cells were treated with CP alone or in combination with CP and the AKT inhibitor MK2206. MK2206 is an allosteric inhibitor of AKT that blocks its phosphorylation at S473.Citation32 The results showed in each OS cell line that MK2206 blocked/reduced the basal and CP-induced levels of pAKT(S473) (). P53 induction by CP was also partially reduced in cells treated with CP plus MK2206 compared to cells treated with CP alone (). Interestingly, however, MK2206 increased CP-induced apoptosis only in the p53 wild-type OS cell lines (SJSA1, MHM, U2OS) but did not increase CP-induced apoptosis in p53-null OS cells (MG63, SAOS) (). This suggested that MK2206 may increase CP-induced apoptosis, in part, through a p53-dependent mechanism. To examine this possibility further, U2OS cells were infected with lentiviruses expressing control (non-targeting) shRNA or p53 shRNA. The cells were then tested for apoptosis induction after treatment with CP alone or CP plus MK2206. In control cells (U2OS Csh), MK2206 markedly increased CP-induced killing/apoptosis (). p53 knockdown cells (p53sh) were more susceptible to CP-induced apoptosis than controls, but MK2206 either failed to increase CP-induced killing or caused only a very slight increase in killing by CP (). These results support the notion that AKT inhibition sensitizes cells to CP in part by increasing p53-dependent apoptosis.
Figure 3. Inhibition of AKT increases CP-induced apoptosis in OS cells expressing WT p53 but not p53-null cells. (A) OS cells lines were treated with CP alone (5 μM for SJSA1 and MG63, 10 μM for MHM and U2OS, 2 μM for SAOS) or CP plus MK2206 (MK, 10 μM) for 48 hours. Whole cell lysates were immunoblotted for pAKT (S473), p53, and β-actin. (B) The cells were treated with CP and MK2206 (doses as above) singly or combined for 72 hours and analyzed with FACS for sub-G1 apoptosis. Average percent apoptotic cells from triplicate experiments is graphed with standard deviation indicated. There is significant difference between CP and CP plus MK (p < 0.01) in SJSA1, MHM, and U2OS cell lines and no significant difference (p > 0.5) in MG63 and SAOS cells. (C) U2OS cells expressing control shRNA (Csh) or p53 shRNA (p53sh) were treated with 15 μM CP for 48 hours and whole cell lysates immunoblotted for p53 and β-actin. (D) U2OS cells expressing control shRNA (Csh) or p53 shRNA (p53sh) were treated with 15 μM CP and 10 μM MK singly or combined for 72 hours and analyzed with FACS for sub-G1 apoptosis. Average percent apoptotic cells from triplicate were presented as a graph with standard deviation indicated. There is significant difference between CP and CP plus MK (p < 0.01) in Csh cells but not in p53 sh cells (Representative of at least 3 independent experiments).
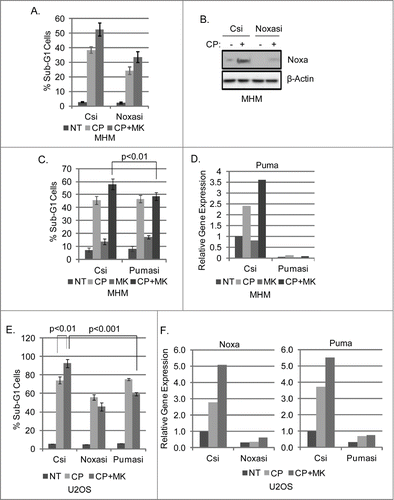
P53 can induce apoptosis by activating expression of genes like Noxa and PUMA whose gene products disrupt mitochondrial membrane potential and trigger cytochrome-c release.Citation43,44 We monitored Noxa and PUMA mRNA levels in control MHM and U2OS cells, or in cells in which p53 was depleted by either siRNA (p53si) or shRNA (p53sh). As shown in , CP induced Noxa and PUMA mRNA expression in MHM and U2OS cells, and the combination of CP plus MK2206 induced Noxa and PUMA to even higher levels. Noxa and PUMA mRNA were less induced by CP or CP plus MK2206 in p53 knockdown cells (p53si, p53sh), suggesting MK2206 increased p53-induced expression of these apoptotic genes. Immunoblots showed p53 was largely depleted in the knockdown cells (). Finally, Noxa and PUMA were depleted by siRNA, and apoptosis after treatment with CP or CP plus MK2206 was determined. As shown in , Noxa depletion by siRNA partially reduced CP and CP plus MK2206 induced apoptosis in MHM cells. In contrast, PUMA depletion did not reduce apoptosis by CP alone, but did reduce the increase in apoptosis seen in cells co-treated with CP plus MK2206 (). Similar experiments were done in U2OS cells. As shown in , Noxa siRNA reduced apoptosis by CP and CP plus MK in U2OS cells, while PUMA siRNA did not reduce apoptosis by CP alone, but did prevent the increase in apoptosis seen when U2OS were co-treated with CP plus MK. mRNA analysis showed Noxa and PUMA expression were inhibited by siRNA (). In total, the results in – indicate AKT inhibition by MK2206 increases CP-induced apoptosis in p53 wild-type OS cells, and this is associated with increased expression of p53-dependent apoptotic genes (Noxa and PUMA) and p53-dependent death.
Figure 4. P53 knockdown reduces Noxa and Puma gene expression in cells treated with CP or CP plus MK2206. (A) MHM cells were transiently transfected with control siRNA (Csi) or p53 siRNA (p53si) were treated with CP (10 μM) or CP plus MK for 48 hours. Relative Noxa and Puma gene expression was analyzed by qTPCR and presented as graphs. (B) Whole cell lysates were immunoblotted for p53 and β-actin. (C) U2OS cells expressing control shRNA (Csh) or p53 shRNA (p53sh) were treated with CP (15 μM) or CP plus MK for 48 hours. Relative Noxa and Puma genes were analyzed by qTPCR and presented as graphs. (D) Whole cell lysates were immunoblotted for p53 and β-actin.
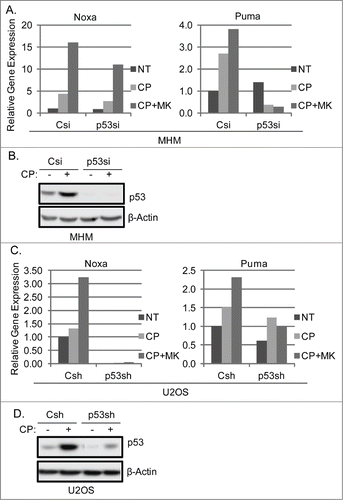
Figure 5. Knockdown of Noxa and Puma reduces MK2206 sensitization of OS cells to CP. MHM and U2OS cells were transfected with control siRNA (Csi), Noxa siRNA (Noxasi), or Puma siRNA (Pumasi) and treated with CP (10 μM for MHM, 15 μM U2OS) or CP plus MK. 72 hours later cells were analyzed for apoptosis (A, C and E). Cells were also harvested after 48 hour treatment and analyzed by immunoblotted for Noxa protein (B) or Noxa and Puma gene expression (D and F).
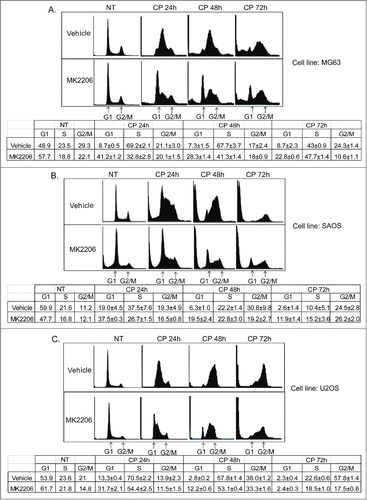
The fact that AKT inhibition failed to increase CP-induced killing in p53-null OS cells led us to speculate that AKT inhibition in these cells might trigger survival mechanisms that limit killing. Activated AKT can promote the phosphorylation and degradation of p27.Citation35,36 Thus, we considered AKT inhibition might stabilize p27 in CP-treated cells, and that this might lead to a p27-dependent G1 arrest that protects cells from killing by CP. To examine this possibility, we first monitored cell cycle profiles in MG63, SAOS, and U2OS cells treated with CP alone or CP plus MK2206 (). CP treatment for 24–48 hrs in each cell line caused an S-phase arrest/delay, evidenced by a near complete depletion of G1-phase cells and their accumulation in S-phase. This was followed by a slow progression through S-phase into G2/M at the 48 and 72 hr time points and the appearance of sub-G1 (apoptotic) cells. In contrast, cells treated with CP plus MK2206 showed a clear G1-phase peak at all time-points that was not present or less present in cells treated with CP alone. This G1 peak was most evident at 24 hrs and slowly diminished at the 48 and 72 hr time-points ().
Figure 6. MK2206 causes a G1 arrest/delay in CP treated cells. MG63 cells (A), SAOS cells (B), and U2OS cells (C) were treated with CP (5 μM for MG63, 2 μM for SAOS, 15 μM for U2OS) or CP plus MK2206 (MK, 10 μM). The cells were harvested at the indicated time points and analyzed by FACS for cell cycle. Representative cell cycle profile histograms are shown. The tables below the histograms show the average percent G1, S, and G2/M populations from triplicate experiments +/− s.e.m.
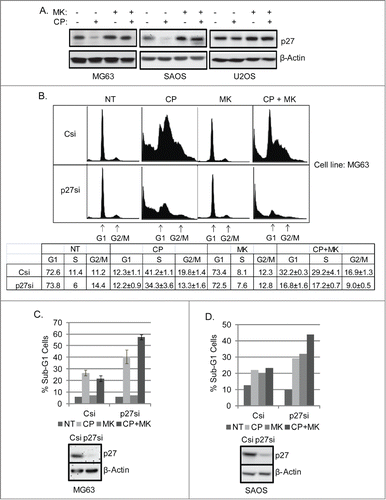
We wished to ask if the apparent G1 arrest/delay in CP plus MK2206 treated cells was mediated by p27 and if it promoted survival/reduced CP-induced killing. To this end, we first monitored p27 levels in cells treated with CP alone or co-treated with CP plus MK2206 (). The results showed p27 levels were markedly reduced in MG63 and SAOS cells treated with CP alone, and also partially reduced in U2OS cells treated with CP alone though to a lesser extent than in MG63 and SAOS. In contrast, p27 levels were not reduced or were less reduced in cells co-treated with CP plus MK2206. These results support the idea that p27 levels are regulated by AKT, and p27 might indeed mediate a protective G1 arrest/delay in cells co-treated with CP plus MK2006. To examine this notion directly, MG63 cells were transfected with control (non-target) siRNA or p27 siRNA, and subsequently treated with CP alone, MK2206 alone, or the combination CP plus MK2206. Cell cycle profiles were monitored 72 hrs after treatment (). In control siRNA transfected cells (Csi) treated with CP and MK2206 (CP+MK, ) there was an obvious G1-phase peak that was not evident in cells treated with CP alone, consistent with the results of . However, this G1 peak was clearly diminished in the p27 knockdown cells (p27si) treated with CP plus MK2206, indicating the G1 peak is mediated in part by p27. Finally, MK2206 did not increase CP-induced apoptosis in control siRNA-transfected (Csi) MG63 or SAOS cells, but did increase CP-induced apoptosis in MG63 and SAOS cells with p27 knockdown (). These results indicate that AKT inhibition stabilizes/maintains p27 levels in CP-treated OS cells, leading to a p27-dependent G1 arrest/delay that protects cells from CP-induced killing.
Figure 7. CP induces loss of p27 which is prevented by MK2206. Knockdown of p27 reduces MK2206-mediated G1 arrest and sensitized p53-null cells to apoptosis in response to CP plus MK. (A) MG63, SAOS, U2OS cells were treated with CP and/or MK2206 for 24 hours. Whole cell lysates were immunoblotted for p27 and β-actin. (B) MG63 cells were transiently transfected with control siRNA (Csi) or p27kip siRNA (p27si) and treated with CP (5 μM) and/or MK2206 for 72 hours. The cells were stained by PI and analyzed for cell cycle. Representative cell cycle profiles are shown. The table below the cell cycle profiles shows the average percent G1, S, and G2/M populations from triplicate experiments +/− s.e.m. (C) Upper Percent sub-G1 cell (+/− s.e.m.) is shown for control and p27 knockdown MG63 cells treated with CP, MK, or CP plus MK for 72 hrs. There is significant difference in Sub-G1 and G1 population between Csi and p27si (p < 0.01) cells treated with CP plus MK2206. Lower Immunoblots show efficient knockdown of p27 by siRNA. (D) Upper Percent sub-G1 cell (+/− s.e.m.) is shown for control and p27 knockdown SAOS cells treated with CP, MK, or CP plus MK for 72 hrs. There is significant difference in Sub-G1 and G1 population between Csi and p27si (p < 0.01) cells treated with CP plus MK2206. Lower Immunoblots show efficient knockdown of p27 by siRNA.
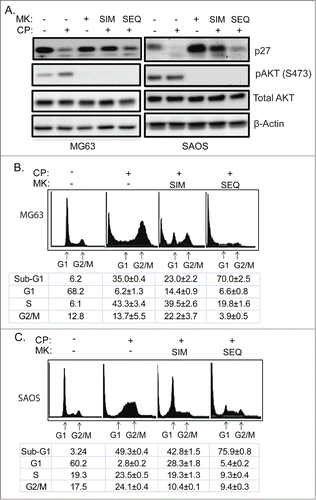
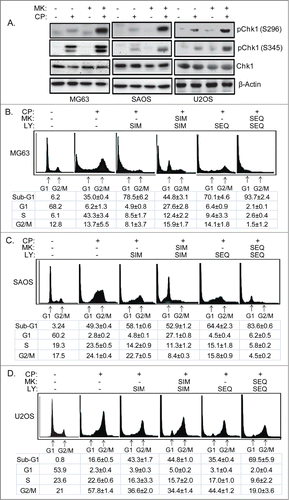
Results in and indicate that AKT inhibition can limit CP-induced killing by maintaining p27 levels. CP treatment alone for 24 hrs caused a pronounced depletion of p27 in MG63 and SAOS cells, most likely by promoting p27 degradation (). Thus, we considered a schedule-dependent approach that reduced p27 levels prior to inhibition of AKT might maximize CP-induced killing. Specifically, we considered that if AKT inhibitor was added 24 hrs after CP treatment it would inhibit AKT-mediated survival pathways but fail to trigger a protective G1 arrest because p27 would already be depleted/degraded. To test this possibility, we first treated MG63 and SAOS with CP alone or CP plus MK2206. In these experiments, MK2206 was either given at the same time as CP (simultaneously, SIM) or given 24 hrs after CP treatment (sequentially; SEQ). p27 and pAKT levels were determined by immunoblot. As shown in , pAKT was completely depleted by MK2206 under all conditions and, consistent with the results of , p27 was depleted/reduced in cells treated with CP alone but maintained/not reduced in cells treated simultaneously with CP plus MK2206 (SIM lanes, ). Importantly, however, p27 levels were reduced in cells treated sequentially with CP for 24 hrs followed by MK2206 treatment (SEQ lanes ). We used cell cycle analysis to ask if this sequential treatment with CP for 24 hrs followed by MK2206 treatment would avoid the p27-mediated protective G1 arrest and enhance CP-induced killing (). MG63 and SAOS cells treated simultaneously with CP plus MK2206 (SIM) again showed an obvious G1 peak not evident in cells treated with CP alone, and simultaneous treatment with CP plus MK2206 did not increase sub-G1 apoptosis. However, the protective G1 arrest was not present in cells treated sequentially with CP for 24 followed by MK2206 and, under these conditions, the cells underwent much higher levels of apoptosis. The results indicate schedule-dependent inhibition of AKT 24 hrs after CP treatment can avoid the protective G1 arrest mediated by p27 and increase CP-induced killing.
Figure 8. Scheduled inhibition of AKT reduces p27, abrogates G1 arrest, and sensitizes p53-null cells to CP-induced apoptosis. (A) Cells were treated with CP (5 μM for MG63, 2 μM for SAOS) alone, CP plus MK2206 simultaneously (SIM), or CP first for 24 hrs followed by MK2206 (sequentially; SEQ) for 48 hrs. Whole cells lysates were immunoblotted for p27, pAKT, total AKT, and β-actin. (B and C) MG63 and SAOS cells were treated as indicated for 72 hours, and cell cycle determined by FACS. Representative histograms are shown. The tables below the histograms shows the average percent sub-G1, G1, S, and G2/M populations from triplicate experiments +/− s.e.m. There is significant difference in sub-G1 and G1 population (p < 0.01) between CP plus MK (SIM) and CP plus MK (SEQ) in both MG63 and SAOS cells.
AKT has been reported to phosphorylate and inhibit Chk1.Citation33,34 Given that Chk1 activation promotes survival in CP-treated OS cells (), we speculated MK2206 might increase activated Chk1 levels, and this might also reduce killing by CP. Consistent with this, levels of activated pChk1(S345) and pChk1(S296) were increased in MG63, SAOS, and U2OS cells treated with CP plus MK2206 compared to cells treated with CP alone (). Given that AKT and Chk1 both promote survival in CP-treated OS cells, these findings provide a rationale for combining AKT and Chk1 inhibitors to increase CP-induced killing. However, our results suggest maximum killing might not be achieved in this case because AKT inhibition may stabilize/maintain p27 levels and promote a p27-dependent G1 arrest. Therefore, we wished to test if AKT inhibition can limit OS cell killing by CP and the Chk1 inhibitor LY and, if yes, whether a schedule-dependent inhibition of AKT and Chk1 can overcome this effect. To this end, we monitored apoptosis in cells treated with CP, MK2206, and LY (Chk1 inhibitor) given either simultaneously (SIM) or sequentially (SEQ). As shown in , LY given simultaneously with CP increased sub-G1 apoptosis in all 3 OS cell lines. However, simultaneous treatment with CP, LY, and MK2206 either did not increase apoptosis (U2OS cells), or decreased apoptosis (MG63 and SAOS) compared to treatment with CP and LY alone and, under these conditions, there was a marked accumulation of G1-phase cells. These results suggest that MK2206 may promote a G1-phase arrest/delay and reduce apoptosis in cells treated with simultaneously with CP plus LY. Next, we tested if sequential addition of MK2206 and LY could avoid the apparent G1 arrest/delay and maximize OS cell killing by CP. As shown in , maximum apoptosis was observed in MG63 and SAOS cells (80–95%) and in U2OS cells (∼70% apoptosis) when MK2206 and LY were given sequentially 24 hrs after CP treatment (), and under these conditions the apparent G1 arrest/delay was not evident.
Figure 9. Scheduled inhibition of AKT abrogates G1 arrest/delay, and together with inhibition of Chk1 maximally sensitizes OS cells to CP-induced apoptosis. (A) Cells were treated with CP alone (5 μM for MG63, 2 μM for SAOS, 15 μM for U2OS) or CP plus MK for 48 hrs and immunoblotted for pChk1 (S296 and S345), total Chk1, and β-actin. (B–D) Cells were treated with CP alone (doses as above), or CP plus LY and/or MK either simultaneously (SIM) or sequentially (SEQ). Cells were harvested after 72 hours cell cycle profiles determined. Representative cell cycle histograms are shown. The tables below the histograms shows the average percent sub-G1, G1, S, and G2/M populations from triplicate experiments +/− s.e.m. There is significant difference in sub-G1 and G1 population (p < 0.01) between CP plus LY (SIM) and CP plus LY/MK (SIM), and between CP plus LY/MK (SIM) and CP plus LY/MK (SEQ) in MG63 and SAOS cells. In U2OS cell there is no significant difference in sub-G1 and G1 population (p > 0.5) between CP plus LY (SIM) and CP plus LY/MK (SIM) while there is significant difference (p < 0.01) between CP plus LY/MK (SIM) and CP plus LY/MK (SEQ).
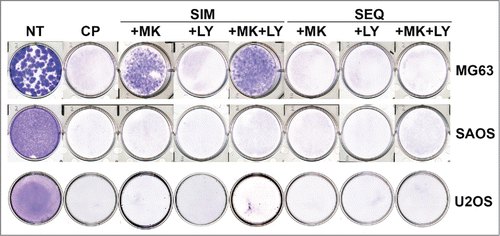
While apoptosis is an important mode of cell death, other mechanisms of cell death may also contribute to the CP-mediated therapeutic effect. We therefore performed clonogenic survival assays to complement the apoptosis studies (). In MG63 cells, CP alone inhibited colony forming ability completely at all doses tested. Strikingly, however, MK2206 or MK2206 plus LY when given simultaneously with CP promoted survival in MG63 cells, and this survival effect was lost when the drugs were given sequentially 24 hrs after CP treatment. These results suggest MK2206 promotes long-term survival in MG63 cells treated simultaneously with CP or CP plus LY, perhaps by promoting a p27-dependent G1 arrest and DNA repair. In SAOS cells colony forming ability was completely inhibited under all treatment conditions and CP doses. We speculate the protective effect of MK2206 when given simultaneously with CP results from both a p27-dependent G1 arrest and DNA repair. Thus, while MK2206 caused a G1 arrest that could reduce apoptosis in CP-treated SAOS cells, we speculate these cells may be inefficient or unable to repair the DNA and therefore are unable to survive and form colonies. In U2OS cells CP alone inhibited colony formation (). MK2206 increased apoptosis in CP-treated U2OS cells () and did not increase long-term survival significantly, though we did observe rare surviving colonies (1–5 colonies) in U2OS simultaneously treated with CP plus MK2206 or CP plus MK2206 and LY (). Finally, we noted there often appeared more surviving colonies in cells simultaneously treated with CP plus MK2206 and LY compared to cells treated with CP plus MK2206 alone (for example, compare MG63 treated simultaneously with CP plus MK2206 only or CP plus MK2206 plus LY, ). Chk1 inhibition can force G2 arrested cells to enter mitosis with damaged DNA. While this can lead to cell death it, alternatively, may lead to rare cells that divide successfully and enter the subsequent G1 phase. In the presence of AKT inhibitor, these cells may undergo a p27-dependent G1 arrest that allows them to repair their DNA and survive. We speculate this may explain why in some cases we observed an apparent increased colony formation in cells treated simultaneously with CP plus MK2206 and LY compared to CP plus MK2206 alone.
Figure 10. Colony forming ability in OS cells treated with CP, MK2206, and LY either simultaneously or sequentially. U2OS cells were plated at 1.0 × 10⁶ cells/100 mm dish. MG63 and SAOS cells were plated at 1.0 × 10⁵ cells/ well in 6-well dishes, except for the MG63 no treat (NT) condition in which 100 cells were plated. Cells were treated with CP alone (5 μM for MG63, 2 μM for SAOS, 10 μM for U2OS), CP plus 10 μM MK2206, CP plus 0.2 μM LY2603618 or CP plus MK2206 plus LY2603618 eiher simultaneously (SIM) or sequentially (SEQ; MK2206 and LY2603618 added 24 hrs after CP. After 72 hrs, the cells were rinsed 3 times with PBS and then complete media (minus drugs) was added. Cells were allowed to grow for 2 weeks and the plates were then stained with 0.05% Crystal Violet to demonstrate colony formation.
Discussion
The effectiveness of anti-cancer chemotherapy agents can be limited by activation of survival signaling pathways, or checkpoints that halt the cell cycle to allow DNA repair. Thus, targeting survival pathways and/or cell cycle checkpoints may increase chemotherapy-induced cancer cell death. Cisplatin (CP) induced apoptosis to varying extents in multiple osteosarcoma (OS) cell lines. However, CP treatment also activated Chk1 and AKT, survival factors that could limit CP-induced killing. Chk1 inhibition sensitized p53 wild-type and p53-null OS cells to CP-induced apoptosis. In contrast, an AKT inhibitor increased CP-induced apoptosis only in p53 wild-type OS cells, but not p53 null cells. The increased apoptosis in p53 wild-type cells was coincident with decreased p53 protein levels, but increased expression of p53-responsive apoptotic genes Noxa and PUMA. The inability of AKT inhibitor to CP-sensitize p53-null OS cells resulted from 2 things: 1) AKT inhibition stabilized/maintained p27 levels in CP-treated cells, which then mediated a protective G1-phase cell cycle arrest, 2) AKT inhibition increased the levels of activated Chk1. Finally, schedule dependent inhibition of AKT and Chk1 evaded the protective G1 arrest mediated by p27 and maximized CP-induced OS cell killing. These data demonstrate AKT and Chk1 activation promote survival in CP-treated OS cells, and that strategic, scheduled targeting of AKT and Chk1 can maximize CP-induced apoptosis in OS cells.
CP induces intra- and inter-strand DNA crosslinks that stall DNA replication forks (RFs) in S-phase cells and induce DNA double strand breaks (DSBs).Citation45 Stalled RFs activate the ATR-Chk1 cell cycle checkpoint pathway, which can promote cell survival in 2 ways: First, collapse of stalled RFs can trigger apoptosis. ATR-Chk1 stabilizes stalled RFs (prevents fork collapse), thus increasing survival.Citation11,46 Second, ATR-Chk1 induces a G2-phase cell cycle arrest that promotes survival by allowing cells time to undergo DNA repair before proceeding with cell division.Citation6 Chk1 was activated by CP treatment in all OS cell lines, evidenced by increased expression of Chk1 phosphorylated at S345 (an ATR phosphorylation site) and S296 (an autophosphorylation site). The predominant cell cycle responses to CP were S-phase delay, G2 arrest, and sub-G1 apoptosis. Chk1 inhibition increased CP-induced apoptosis in all OS cell lines, regardless of p53 status. The most likely scenario is that the Chk1 inhibitor increased CP-induced apoptosis by destabilizing RFs in S-phase and/or abrogating the G2-phase cell cycle arrest mediated by Chk1.
AKT is a kinase and key regulator of cell survival that can be activated by growth factor signaling and DNA damage. Activated AKT promotes survival by phosphorylating and inhibiting/activating the activity of various pro/anti-apoptotic factors.Citation35-38 In the current study, wild-type p53 was induced to a lower level in cells treated with CP and an AKT inhibitor compared to cells treated with CP alone (). In ongoing experiments (not shown) we found the decreased level of p53 protein does not result from decreased p53 mRNA levels or increased p53 protein degradation. mTORC1 is a kinase complex activated downstream of AKT that promotes/regulates protein synthesis and cancer cell growth and therapy responses.Citation47 Previous studies showed mTORC1 can promote p53 protein translation/synthesis.Citation48,49 Thus, we speculate AKT inhibition may reduce p53 protein levels in CP-treated cells by blocking or reducing p53 synthesis that is mediated by mTORC1. However, despite p53 protein levels being lower in AKT inhibitor treated cells, the apoptotic function of p53 appeared to increase. This was evidenced by the finding that AKT inhibitor increased p53-dependent apoptotic gene expression (PUMA, Noxa) and p53-dependent death in CP-treated cells (–). This raises the question of how AKT inhibition increases p53 apoptotic function. The apoptotic activity of p53 is regulated, in part, by specific post-translational modifications that can increase p53 binding to apoptotic gene promoters. Of particular interest with regard to AKT is acetylation of p53 at lysine-120 (K120). GSK3b is a kinase and AKT substrate that can regulate K120 acetylation and p53 activity.Citation50 Charvet et al reported GSK3b stimulates p53 apoptotic function (PUMA expression) by phosphorylating TIP60 and promoting TIP60 dependent acetylation of p53 at K120.Citation50 AKT inhibits GSK3b by phosphorylation at serine-9. One possibility is that AKT inhibition increases p53 apoptotic activity by activating GSK3b and thus promoting K120 acetylation of p53 by TIP60.
P27 is a potent inhibitor of G1-phase cyclin-CDK complexes that can arrest cells in G1. Previous studies showed AKT can phosphorylate p27 and this can lead to its degradation and cytoplasmic sequestration.Citation35,36 In the current study, CP activated AKT and caused a reduction in p27 protein levels that was blocked by the AKT inhibitor MK2206. These results indicate the reduction in p27 levels required AKT and most likely resulted from AKT-mediated p27 degradation. Earlier studies showed G1 arrest can protect cancer cells from cisplatin induced apoptosis and death.Citation51-53 In the current study, we found that AKT inhibitor given simultaneously with CP induced a p27-dependent G1 arrest in OS cells that protected p53-null cells from CP-induced apoptosis. We therefore tested if schedule-dependent inhibition of AKT could avoid the p27-dependent G1 arrest and maximize killing. OS cells treated with CP alone for 24 hrs were accumulated in S and G2/M phases and p27 levels were depleted/reduced. Thus, we speculated AKT inhibition at this time point would block the survival activity of AKT but not induce a protective G1 arrest, since p27 levels were already depleted at this time point and the majority of cells were not in G1. Indeed, cells treated with AKT inhibitor or AKT inhibitor plus Chk1 inhibitor 24 hrs after treatment with CP failed to arrest in G1 phase and, under these conditions, maximum levels apoptosis were achieved. The fact that AKT inhibition increased CP-induced apoptosis in p53-null OS cells only when administered after CP treatment raises the question of what AKT may be doing in “late” phases of the cell cycle that protects cells from killing by CP. In this regard, AKT is known to phosphorylate multiple S- and G2-phase regulators, including Wee1, CDC25, and CDK2.Citation54 The effect of these phosphorylations is to promote cell cycle progression, in some cases, even in the face of DNA damage.Citation33 Tonic et al. (2010) reported AKT can inhibit Chk1 and overcome a Chk1 dependent G2 arrest.Citation33 However, Chk1 inhibition can increase CP-induced apoptosis, and therefore inhibiting Chk1 and overcoming a G2 checkpoint would decrease rather than increase survival. The ability of AKT to promote survival from CP induced apoptosis most likely results from AKT-mediated phosphorylation and activation of pro-survival factors such as XIAP and Bcl-xL and inhibition by AKT of Foxo and other factors that promote apoptosis.Citation54,55 It remains possible that AKT also has specific substrates in late cell cycle phases that mediate survival and inhibition of these contributed to death when MK2206 was added sequentially rather than simultaneously with CP.
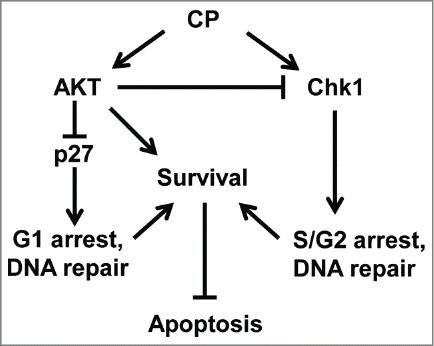
In sum, our results support the model shown in . In this model, CP induces apoptosis/death in OS cells while also activating pro-survival kinases AKT and Chk1. Activated Chk1 increases survival by promoting S- and G2-phase arrests and DNA repair. AKT activation has 2 effects: first, AKT promotes survival by phosphorylating pro- and anti-apoptotic factors and decreasing/increasing their activity. Second, AKT inhibits p27 by promoting its degradation, and also inhibits Chk1. Inhibitors of AKT and Chk1 can increase CP-induced apoptosis. However, inhibition of AKT has the undesired effects of 1) stabilizing p27, which promotes survival through a G1 arrest and DNA repair and 2) activating Chk1. P27 is depleted (degraded) in an AKT dependent manner in OS cells treated with CP alone for 24 hrs. AKT and Chk1 inhibition at this time point thus maximizes killing by blocking the survival activity of both proteins without inducing a protective G1 arrest. To our knowledge AKT and Chk1 inhibitors have not been tested clinically for their ability to increase therapy responsiveness in OS. Based on our results, we would suggest sequential addition of AKT and Chk1 inhibitors after CP could be an effective treatment strategy for OS patients. Moreover, we predict a similar treatment strategy may be effective for other cancer types such as ovarian cancer in which cisplatin is a first line therapy agent and cisplatin resistance is a major problem.Citation56
Figure 11. Proposed model (see discussion for details).
Disclosure of Potential Conflicts of Interest
No potential conflicts of interest were disclosed.
Funding
This work was supported, in whole or in part, by National Institutes of Health Grant 1R01CA137598-01A1 from the National Cancer Institute (NCI) (to C. G. M.).
References
- Eastman A. Cell cycle checkpoints and their impact on anticancer therapeutic strategies. J Cell Biochem 2004; 91:223-31; PMID:14743382; http://dx.doi.org/10.1002/jcb.10699
- Mitchison TJ. The proliferation rate paradox in antimitotic chemotherapy. Mol Biol Cell 2012; 23:1-6; PMID:22210845; http://dx.doi.org/10.1091/mbc.E10-04-0335
- Lu C, Fu W, Zhao D, Mattson MP. The DNA damaging agent etoposide activates a cell survival pathway involving alpha-amino-3-hydroxy-5-methylisoxazole-4-propionate receptors and mitogen-activated protein kinases in hippocampal neurons. J Neurosci Res 2002; 70:671-9; PMID:12424735; http://dx.doi.org/10.1002/jnr.10413
- Wang X, McCullough KD, Franke TF, Holbrook NJ. Epidermal growth factor receptor-dependent Akt activation by oxidative stress enhances cell survival. J Biol Chem 2000; 275:14624-31; PMID:10799549; http://dx.doi.org/10.1074/jbc.275.19.14624
- Li HF, Kim JS, Waldman T. Radiation-induced Akt activation modulates radioresistance in human glioblastoma cells. Radiation Oncol 2009; 4:43; http://dx.doi.org/10.1186/1748-717X-4-43
- Smith J, Tho LM, Xu N, Gillespie DA. The ATM-Chk2 and ATR-Chk1 pathways in DNA damage signaling and cancer. Adv Can Res 2010; 108:73-112; PMID:21034966; http://dx.doi.org/10.1016/B978-0-12-380888-2.00003-0
- el-Deiry WS, Tokino T, Velculescu VE, Levy DB, Parsons R, Trent JM, Lin D, Mercer WE, Kinzler KW, Vogelstein B. WAF1, a potential mediator of p53 tumor suppression. Cell 1993; 75:817-25; PMID:8242752; http://dx.doi.org/10.1016/0092-8674(93)90500-P
- Xiong Y, Hannon GJ, Zhang H, Casso D, Kobayashi R, Beach D. p21 is a universal inhibitor of cyclin kinases. Nature 1993; 366:701-4; PMID:8259214; http://dx.doi.org/10.1038/366701a0
- Carvajal LA, Manfredi JJ. Another fork in the road–life or death decisions by the tumour suppressor p53. EMBO Rep 2013; 14:414-21; PMID:23588418; http://dx.doi.org/10.1038/embor.2013.25
- Oda K, Arakawa H, Tanaka T, Matsuda K, Tanikawa C, Mori T, Nishimori H, Tamai K, Tokino T, Nakamura Y, et al. p53AIP1, a potential mediator of p53-dependent apoptosis, and its regulation by Ser-46-phosphorylated p53. Cell 2000; 102:849-62; PMID:11030628; http://dx.doi.org/10.1016/S0092-8674(00)00073-8
- Zachos G, Rainey MD, Gillespie DA. Chk1-dependent S-M checkpoint delay in vertebrate cells is linked to maintenance of viable replication structures. Mol Cell Biol 2005; 25:563-74; PMID:15632059; http://dx.doi.org/10.1128/MCB.25.2.563-574.2005
- Feijoo C, Hall-Jackson C, Wu R, Jenkins D, Leitch J, Gilbert DM, Smythe C. Activation of mammalian Chk1 during DNA replication arrest: a role for Chk1 in the intra-S phase checkpoint monitoring replication origin firing. J Cell Biol 2001; 154:913-23; PMID:11535615; http://dx.doi.org/10.1083/jcb.200104099
- Chen T, Stephens PA, Middleton FK, Curtin NJ. Targeting the S and G2 checkpoint to treat cancer. Drug Discov Today 2012; 17:194-202; PMID:22192883; http://dx.doi.org/10.1016/j.drudis.2011.12.009
- Taylor WR, Stark GR. Regulation of the G2/M transition by p53. Oncogene 2001; 20:1803-15; PMID:11313928; http://dx.doi.org/10.1038/sj.onc.1204252
- Norbury C, Blow J, Nurse P. Regulatory phosphorylation of the p34cdc2 protein kinase in vertebrates. EMBO J 1991; 10:3321-9; PMID:1655417
- Iliakis G, Wang Y, Guan J, Wang H. DNA damage checkpoint control in cells exposed to ionizing radiation. Oncogene 2003; 22:5834-47; PMID:12947390; http://dx.doi.org/10.1038/sj.onc.1206682
- Kawabe T. G2 checkpoint abrogators as anticancer drugs. Mol Can Ther 2004; 3:513-9; PMID:15078995
- Bunz F, Dutriaux A, Lengauer C, Waldman T, Zhou S, Brown JP, Sedivy JM, Kinzler KW, Vogelstein B. Requirement for p53 and p21 to sustain G2 arrest after DNA damage. Science 1998; 282:1497-501; PMID:9822382; http://dx.doi.org/10.1126/science.282.5393.1497
- Hermeking H, Lengauer C, Polyak K, He TC, Zhang L, Thiagalingam S, Kinzler KW, Vogelstein B. 14-3-3 sigma is a p53-regulated inhibitor of G2/M progression. Mol Cell 1997; 1:3-11; PMID:9659898; http://dx.doi.org/10.1016/S1097-2765(00)80002-7
- Levesque AA, Fanous AA, Poh A, Eastman A. Defective p53 signaling in p53 wild-type tumors attenuates p21waf1 induction and cyclin B repression rendering them sensitive to Chk1 inhibitors that abrogate DNA damage-induced S and G2 arrest. Mol Can Ther 2008; 7:252-62; http://dx.doi.org/10.1158/1535-7163.MCT-07-2066
- Thompson R, Eastman A. The cancer therapeutic potential of Chk1 inhibitors: how mechanistic studies impact on clinical trial design. Br J Clin Pharmacol 2013; 76:358-69; PMID:23593991; http://dx.doi.org/10.1111/bcp.12139
- Origanti S, Cai SR, Munir AZ, White LS, Piwnica-Worms H. Synthetic lethality of Chk1 inhibition combined with p53 and/or p21 loss during a DNA damage response in normal and tumor cells. Oncogene 2013; 32:577-88; PMID:22430210; http://dx.doi.org/10.1038/onc.2012.84
- Bhaskar PT, Hay N. The two TORCs and Akt. Dev Cell 2007; 12:487-502; PMID:17419990; http://dx.doi.org/10.1016/j.devcel.2007.03.020
- Zhang X, Tang N, Hadden TJ, Rishi AK. Akt, FoxO and regulation of apoptosis. Biochim Biophys Acta 2011; 1813:1978-86; PMID:21440011; http://dx.doi.org/10.1016/j.bbamcr.2011.03.010
- Datta SR, Dudek H, Tao X, Masters S, Fu H, Gotoh Y, Greenberg ME. Akt phosphorylation of BAD couples survival signals to the cell-intrinsic death machinery. Cell 1997; 91:231-41; PMID:9346240; http://dx.doi.org/10.1016/S0092-8674(00)80405-5
- Ogawara Y, Kishishita S, Obata T, Isazawa Y, Suzuki T, Tanaka K, Masuyama N, Gotoh Y. Akt enhances Mdm2-mediated ubiquitination and degradation of p53. J Biol Chem 2002; 277:21843-50; PMID:11923280; http://dx.doi.org/10.1074/jbc.M109745200
- Mayo LD, Donner DB. A phosphatidylinositol 3-kinase/Akt pathway promotes translocation of Mdm2 from the cytoplasm to the nucleus. Proc Natl Acad Sci USA 2001; 98:11598-603; PMID:11504915; http://dx.doi.org/10.1073/pnas.181181198
- Stronach EA, Chen M, Maginn EN, Agarwal R, Mills GB, Wasan H, Gabra H. DNA-PK mediates AKT activation and apoptosis inhibition in clinically acquired platinum resistance. Neoplasia 2011; 13:1069-80; PMID:22131882
- Rodemann HP, Dittmann K, Toulany M. Radiation-induced EGFR-signaling and control of DNA-damage repair. Int J Rad Oncol 2007; 83:781-91; PMID:18058366
- Cosaceanu D, Budiu RA, Carapancea M, Castro J, Lewensohn R, Dricu A. Ionizing radiation activates IGF-1R triggering a cytoprotective signaling by interfering with Ku-DNA binding and by modulating Ku86 expression via a p38 kinase-dependent mechanism. Oncogene 2007; 26:2423-34; PMID:17043647; http://dx.doi.org/10.1038/sj.onc.1210037
- Valerie K, Yacoub A, Hagan MP, Curiel DT, Fisher PB, Grant S, Dent P. Radiation-induced cell signaling: inside-out and outside-in. Mol Can Ther 2007; 6:789-801; http://dx.doi.org/10.1158/1535-7163.MCT-06-0596
- Hirai H, Sootome H, Nakatsuru Y, Miyama K, Taguchi S, Tsujioka K, Ueno Y, Hatch H, Majumder PK, Pan BS, et al. MK-2206, an allosteric Akt inhibitor, enhances antitumor efficacy by standard chemotherapeutic agents or molecular targeted drugs in vitro and in vivo. Mol Can Ther 2010; 9:1956-67; http://dx.doi.org/10.1158/1535-7163.MCT-09-1012
- Tonic I, Yu WN, Park Y, Chen CC, Hay N. Akt activation emulates Chk1 inhibition and Bcl2 overexpression and abrogates G2 cell cycle checkpoint by inhibiting BRCA1 foci. J Biol Chem 2010; 285:23790-8; PMID:20495005; http://dx.doi.org/10.1074/jbc.M110.104372
- Shtivelman E, Sussman J, Stokoe D. A role for PI 3-kinase and PKB activity in the G2/M phase of the cell cycle. Curr Biol 2002; 12:919-24; PMID:12062056; http://dx.doi.org/10.1016/S0960-9822(02)00843-6
- Liang J, Zubovitz J, Petrocelli T, Kotchetkov R, Connor MK, Han K, Lee JH, Ciarallo S, Catzavelos C, Beniston R, et al. PKB/Akt phosphorylates p27, impairs nuclear import of p27 and opposes p27-mediated G1 arrest. Nature Med 2002; 8:1153-60; PMID:12244302; http://dx.doi.org/10.1038/nm761
- Rassidakis GZ, Feretzaki M, Atwell C, Grammatikakis I, Lin Q, Lai R, Claret FX, Medeiros LJ, Amin HM. Inhibition of Akt increases p27Kip1 levels and induces cell cycle arrest in anaplastic large cell lymphoma. Blood 2005; 105:827-9; PMID:15374880; http://dx.doi.org/10.1182/blood-2004-06-2125
- O'Day K, Gorlick R. Novel therapeutic agents for osteosarcoma. Expert Rev Anticancer Ther 2009; 9:511-23; PMID:19374604; http://dx.doi.org/10.1586/era.09.7
- Kim JS, Lee C, Bonifant CL, Ressom H, Waldman T. Activation of p53-dependent growth suppression in human cells by mutations in PTEN or PIK3CA. Mol Cell Biol 2007; 27:662-77; PMID:17060456; http://dx.doi.org/10.1128/MCB.00537-06
- Sarbassov DD, Guertin DA, Ali SM, Sabatini DM. Phosphorylation and regulation of AKT/PKB by the rictor-mTOR complex. Science 2005: 307:1098-1101; PMID:15718470; http://dx.doi.org/10.1126/science.1106148
- Alessi DR, Andjelkovic M, Caudwell B, Cron P, Morrice N, Cohen P, Hemmings BA. Mechanism of activation of protein kinase B by insulin and IGF-1. EMBO J 1996; 15:6541-51; PMID:8978681
- Capasso H, Palermo C, Wan S, Rao H, John UP, O'Connell MJ, Walworth NC. Phosphorylation activates Chk1 and is required for checkpoint-mediated cell cycle arrest. J Cell Sci 2002; 115:4555-64; PMID:12415000; http://dx.doi.org/10.1242/jcs.00133
- Okita N, Minato S, Ohmi E, Tanuma S, Higami Y. DNA damage-induced CHK1 autophosphorylation at Ser296 is regulated by an intramolecular mechanism. FEBS Lett 2012; 586:3974-9; PMID:23068608; http://dx.doi.org/10.1016/j.febslet.2012.09.048
- Shibue T, Suzuki S, Okamoto H, Yoshida H, Ohba Y, Takaoka A, Taniguchi T. Differential contribution of Puma and Noxa in dual regulation of p53-mediated apoptotic pathways. EMBO J 2006; 25:4952-62; PMID:17024184; http://dx.doi.org/10.1038/sj.emboj.7601359
- Shibue T, Taniguchi T. BH3-only proteins: integrated control point of apoptosis. Int J Cancer 2006; 119:2036-43; PMID:16572413; http://dx.doi.org/10.1002/ijc.21751
- Galluzzi L, Senovilla L, Vitale I, Michels J, Martins I, Kepp O, Castedo M, Kroemer G. Molecular mechanisms of cisplatin resistance. Oncogene 2012; 31:1869-83; PMID:21892204; http://dx.doi.org/10.1038/onc.2011.384
- Katou Y, Kanoh Y, Bando M, Noguchi H, Tanaka H, Ashikari T, Sugimoto K, Shirahige K. S-phase checkpoint proteins Tof1 and Mrc1 form a stable replication-pausing complex. Nature 2003; 424:1078-83; PMID:12944972; http://dx.doi.org/10.1038/nature01900
- Kelsey I, Manning BD. mTORC1 status dictates tumor response to targeted therapeutics. Sci Signaling 2013; 6:pe31; http://dx.doi.org/10.1126/scisignal.2004632
- Lee CH, Inoki K, Karbowniczek M, Petroulakis E, Sonenberg N, Henske EP, Guan KL. Constitutive mTOR activation in TSC mutants sensitizes cells to energy starvation and genomic damage via p53. EMBO J 2007; 26:4812-23; PMID:17962806; http://dx.doi.org/10.1038/sj.emboj.7601900
- Alimonti A, Nardella C, Chen Z, Clohessy JG, Carracedo A, Trotman LC, Cheng K, Varmeh S, Kozma SC, Thomas G, et al. A novel type of cellular senescence that can be enhanced in mouse models and human tumor xenografts to suppress prostate tumorigenesis. J Clin Invest 2010; 120:681-93; PMID:20197621; http://dx.doi.org/10.1172/JCI40535
- Charvet C, Wissler M, Brauns-Schubert P, Wang SJ, Tang Y, Sigloch FC, Mellert H, Brandenburg M, Lindner SE, Breit B, et al. Phosphorylation of Tip60 by GSK-3 determines the induction of PUMA and apoptosis by p53. Mol Cell 2011; 42:584-96; PMID:21658600; http://dx.doi.org/10.1016/j.molcel.2011.03.033
- Evans DL, Dive C. Effects of cisplatin on the induction of apoptosis in proliferating hepatoma cells and nonproliferating immature thymocytes. Cancer Res 1993; 53:2133-9; PMID:8481916
- Fan S, Chang JK, Smith ML, Duba D, Fornace AJ Jr, O'Connor PM. Cells lacking CIP1/WAF1 genes exhibit preferential sensitivity to cisplatin and nitrogen mustard. Oncogene 1997; 14:2127-36; PMID:9174048; http://dx.doi.org/10.1038/sj.onc.1201052
- Fan S, Smith ML, Rivet DJ 2nd, Duba D, Zhan Q, Kohn KW, Fornace AJ Jr, O'Connor PM. Disruption of p53 function sensitizes breast cancer MCF-7 cells to cisplatin and pentoxifylline. Cancer Res 1995; 55:1649-54; PMID:7712469
- Xu N, Lao Y, Zhang Y, Gillespie DA. Akt: a double-edged sword in cell proliferation and genome stability. J. Oncol. 2012: 2012:951724; PMID:22481935; http://dx.doi.org/10.1155/2012/951724
- Parcellier A, Tintignac LA, Zhuravleva E, Hemmings BA. PKB and the mitochondria: AKTing on apoptosis. Cell Signaling 2008: 20:21-30; PMID:17716864; http://dx.doi.org/10.1016/j.cellsig.2007.07.010
- Ali AY, Farrand L, Kim JY, Byun S, Suh JY, Lee HJ, Tsang BK. Molecular determinants of ovarian cancer chemoresistance: new insights into an old conundrum. Annals New York Acad. Sci. 2012: 1271:58-67; PMID:23050965; http://dx.doi.org/10.1111/j.1749-6632.2012.06734.x