
Abstract
The autophagic system is involved in both bulk degradation of primarily long-lived cytoplasmic proteins as well as in selective degradation of cytoplasmic organelles. Autophagic flux is often defined as a measure of autophagic degradation activity, and a number of methods are currently utilized to assess autophagic flux. However, despite major advances in measuring various molecular aspects of the autophagic machinery, we remain less able to express autophagic flux in a highly sensitive, robust, and well-quantifiable manner. Here, we describe a conceptual framework for defining and measuring autophagosome flux at the single-cell level. The concept discussed here is based on the theoretical framework of metabolic control analysis, which distinguishes between the pathway along which there is a flow of material and the quantitative measure of this flow. By treating the autophagic system as a multistep pathway with each step characterized by a particular rate, we are able to provide a single-cell fluorescence live-cell imaging-based approach that describes the accurate assessment of the complete autophagosome pool size, the autophagosome flux, and the transition time required to turn over the intracellular autophagosome pool. In doing so, this perspective provides clarity on whether the system is at steady state or in a transient state moving towards a new steady state. It is hoped that this theoretical account of quantitatively measuring autophagosome flux may contribute towards a new direction in the field of autophagy, a standardized approach that allows the establishment of systematic flux databases of clinically relevant cell and tissue types that serve as important model systems for human pathologies.
The autophagic system is involved in both bulk degradation of primarily long-lived cytosolic proteins as well as in the selective degradation of cytoplasmic organelles. In the past few years the assessment and evaluation of this complete system including its dynamics has received growing attention, as our understanding of autophagosome turnover and kinetic behavior has progressed. Autophagic flux is often defined as a measure of autophagic degradation activity, and a number of methods are currently suggested for assessing autophagic flux, many of which infer whether or not autophagic flux is occuring.Citation1 However, although we have advanced in the methodological approach to assess whether or not a change in autophagic flux is occurring, and whether autophagic flux goes up or down, we remain less able to express this change in a sensitive, robust, and well-quantifiable manner. Moreover, although the development of novel reporter assays enabled the identification of pharmacological regulators of autophagy, highly sensitive assays that characterize the extent and dynamics of this regulation quantitatively remain a challenge in the in vitro, and even more so the in vivo, environment. Based on the well-established metabolic control analysis approach,Citation2,3 where the use of the term flux has been reserved for the rate of flow along a metabolic pathway, we describe a methodological concept that allows the definition and measurement of autophagosome flux at the single cell level in a sensitive and quantifiable manner. Here, we treat the autophagic system as a multistep pathway with each step characterized by a particular rate. We distinguish between the vesicular machinery of the autophagic system, and the cargo that is being degraded within this system. Autophagosome flux, the subject of this paper, is the rate of flow along the vesicular pathway, whereas substrate clearance flux is the rate of cargo degradation within the vesicular system. This distinction makes it possible not only to describe whether or not the vesicular part of the autophagic system is at steady state, but also to quantitatively assess autophagosome flux and to calculate the transition time of the system required to turn over its autophagosome pool. The concept described here makes it possible to quantify and to compare treatment interventions or different cellular systems with one another in terms of change in autophagosome pool size, autophagosome flux, and pool size turnover as well as in the responsiveness and sensitivity to the treatment intervention.
We will start with our quantitative definition of autophagosome flux and describe a methodological concept for measuring this flux. We will then briefly describe 3 of the major current and predominantly used approaches to measuring autophagic degradation activity, and, by juxtaposing them against our definition of autophagosome flux, attempt to indicate the major inherent challenges to these techniques. We will then describe a step-by-step methodology that describes the accurate assessment of i) the complete autophagosome pool size, ii) the steady state, iii) autophagosome flux, and iv) the transition time. Since our definition of autophagosome flux requires a dynamic assessment over time, this conceptual approach shows how to acquire data that describe both the existence of a steady state and the variables that characterize the steady state, such as the steady-state number of autophagosomes and the associated flux in terms of the change in this number per time per cell. We hope that this approach will provide a robust tool for generating numerical data that are sensitive enough to allow us to change flux incrementally, say by 5%, that allows a comparison of fluxes and steady states of different cellular systems, with the benefit of using data that directly reflect the intracellular autophagosome pool. It is moreover envisaged that the approach described here may contribute towards a standardized means for the establishment of flux databases of clinically relevant cell and tissue types that serve as important model systems for, for example, neurodegenerative disorders, cancer, or heart disease.Citation4-6 Finally, this concept may lay the foundation for future control analyses, to unravel the degree of control as opposed to regulation that the different steps in the autophagic pathway exert over the autophagosome flux.
Autophagic Flux: The Rate of Flow
Autophagic flux is defined as a measure of autophagic degradation activity.Citation1 This definition rightfully points to the hallmark of the meaning of flux, namely the rate of autophagic degradation. The higher (or lower) the degradation activity, the higher (or lower) is the respective rate of degradation. The systems that are most often utilized to assess autophagic degradation activity employ a combination of techniques, such as western blot analysis for specific key proteins, transmission electron microscopy, and fluorescence microscopy. These approaches are extremely valuable in the study of the autophagic pathway and continue to generate crucial data that reveal the molecular regulation of the autophagic machinery. Common to all 3 approaches is the direct or indirect assessment of the presence of autophagosomes with and without the utilization of suitable inhibitors. Upon activation of the autophagic pathway, the cytosolic, proteolytically processed form of MAP1LC3/LC3 (microtubule-associated protein 1 light chain 3), termed LC3-I, is lipidated to form LC3–phosphatidylethanolamine, LC3-II, which is specifically recruited to the phagophore membrane. During the subsequent steps of autophagosome maturation, the LC3-II on the outer surface is removed through deconjugation, whereas the LC3-II that is present within the inner vesicle remains associated with the completed autophagosome. LC3-II levels therefore correlate well with autophagosome number. Unlike in the yeast Saccharomyces cerevisae, where the Pho8Δ60 assay provides a unique and sensitive means of measuring autophagic flux,Citation7 in higher eukaryotes LC3 is currently still one of the few practical and reliable markers to assess change in autophagic activity and has thus far been utilized to probe for autophagic flux. However, this approach has largely been limited to a “yes or no” approach, revealing merely whether flux is occuring or whether autophagic flux is regulated up or down. Thus far, this approach may have sufficed for answering a variety of questions; however, with the increasing need for exploiting autophagic modulators in the clinical environment, it will become necessary to upregulate or downregulate autophagic flux in a sensitive and precise manner, preferably expressed in a percent unit change of choice for a defined duration. This asks for a conceptual approach, which will allow exactly that: to quantify autophagic flux as a rate. Especially in the case of neurodegenerative diseases, the time frames of tuning and maintaining a precisely defined flux may well lie in the order of decades. Although various experimental tools are available to measure autophagic activity, such as LC3-II turnover or SQSTM1/p62 degradation, it remains challenging to employ these techniques in a manner that uniformly expresses autophagic flux quantitatively, to report on the stability of the steady state, to assess the magnitude of change in autophagic flux, and to include data on the kinetics thereof.
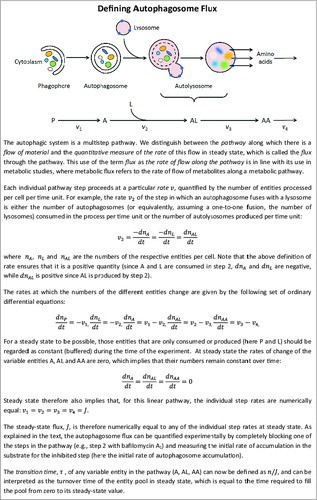
Here, we propose a theoretical account by which the autophagic system is treated as what it actually is, a multistep pathway as shown in . The text accompanying (Box 1) provides the theory behind the definition of the steady state and the steady-state autophagic flux. In addition, it shows that the variables used to describe the steady state, namely the number of autophagosomes per cell and the flux through the autophagic pathway (number of autophagosomes/cell/time) can be combined as a ratio to give the transition time,Citation8 which indicates how long it takes for the autophagosome pool to turn over at steady state.
Figure 1. Defining autophagosome flux. A, autophagosome; AA, amino acids; AL, autolysosome; L, lysosome; P, phagophore; v, rate.
It becomes therefore clear that the majority of techniques that are at first described below, all of which are commonly used for autophagic flux assessment, are not particularly suitable for measuring a rate, and are usually not applied in a manner that would allow the generation of data points for measuring the autophagic flux. As generally applied, they probe for a change in the number of autophagosomes at a single point in time, indicating indirectly whether or not there is autophagic flux occuring and whether this flux increases or decreases.
Western Blot—Indirect Analysis of Autophagosome Pool Size without Suitable Unit and Time Dimensions
Immunoblotting for endogenous LC3 is one of the crucial functional reporter assays that can be used to reliably monitor autophagosome synthesis or degradation, as LC3 associates with the lumenal and cytosolic surface of autophagosomes, with a degree of recycling taking place from the cytosolic surface.Citation9 However, western blotting poses 2 inherent challenges: First, it assesses the number of autophagosomes only indirectly, based on the presence of LC3-II in the lysate of a whole cell population. Second, a minor technical challenge is that blotting for LC3 often results in a high background, which makes it difficult to assess small changes in LC3 protein levels accurately. Third, and more important, is the fact that western blot does not measure a rate. Even with the concomitant use of compounds such as bafilomycin A1 or combinations of leupeptin and pepstatin that prevent fusion with the lysosome or inhibit lysosomal proteases, respectively, at saturating concentrations, a method which is now largely accepted to interpret data on LC3-II immunoblotting,Citation10 it only indicates whether an increase in LC3-II immunoblot signal reflects enhanced autophagosome synthesis or is due to decreased autophagosome degradation. This approach does not measure autophagic flux, but whether or not flux is occurring, increasing or decreasing. Unless the LC3-II signal is plotted over time during the bafilomycin A1 treatment, it cannot indicate a rate, as it would lack the time dimension. Although this kind of assessment, which is also frequently called an “autophagic flux assay,” indicates the extent of LC3-II synthesis or accumulation, it cannot, being based on a single time point with or without bafilomycin A1, indicate the flux per se, as the flux is a rate. Similarly, although used as a valuable additional indicator for measuring autophagic activity,Citation11 the increase in the amount of the ubiquitin and LC3 binding protein SQSTM1 that accompanies impaired autophagy does not measure autophagic flux if not plotted over time.
In addition, the above approach provides little information about whether the system is at steady state. Currently, steady state is most often assumed, which may be a fundamental problem, especially when perturbing the system metabolically with a given treatment intervention. To address these shortcomings, a time-lapse analysis of both LC3-II and SQSTM1 levels would be required without any fusion inhibition; however, this is technically challenging, labor intensive, and, importantly, it remains an indirect assessment because the number and pool size of autophagosomes is not quantified. Western blot analysis is therefore valuable and suitable for answering questions that depend on measuring the overall change of protein levels in a whole cell population, but less suitable for the quantitative measurement of autophagic flux.
Transmission Electron Microscopy—Partial Analysis of Autophagosome Pool Size without a Time Dimension
Microscopy techniques have the advantage of allowing a direct and quantitative assessment of the presence of autophagosomes in cells and tissues. In particular, transmission electron microscopy (TEM) is considered to be valuable for confirming the presence of autophagosomes, lysosomes, autolysosomes, or even endosomes due to its ability to provide highly resolved ultrastructural information. In addition TEM also allows the morphological evaluation of the cargo that is present within autophagosomes, based on the electron density, homogeneity, and ultrastructure of the intraorganellar signal. In that way, details about the nature of autophagy targets, e.g., bulk cytoplasm, lipophagy or mitophagy, or pathology such as cargo recognition impairment (e.g., Huntington disease) or myelin lamellae inclusions can be revealed. In addition, highly valuable morphometric methods have been developed that allow the extraction of numerical data such as diameter or percent area occupied by autophagosomes.Citation12 However, TEM analysis is less suitable for autophagic flux analysis since the measurement of a rate would be very difficult; fixation and embedding requirements associated with TEM sample processing do not allow for time-lapse analysis in the same sample. Although tissues could be collected at various time points upon treatment intervention with and without concomitant use of lysosomal protease inhibitors at saturating concentrations, such an approach would be extremely time and labor intensive, as well as costly. Most importantly, however, it would not allow direct quantification of dynamic turnover. Moreover, TEM-based image analysis is most often restricted to data derived from a single focal plane, providing an incomplete reflection of the autophagosome pool. Three-dimensional image acquisition would be required to accurately assess the intracellular autophagosome pool size. TEM-based analysis indicates whether there is a change in, for example, the autophagosome number, and it allows an assessment of whether this change is significant. It does, however, not provide a quantitative measure of the flux, as it does not measure the rate at which this change in number was brought about. TEM acquisition and analysis also does not provide information as to whether the system is at steady state. It does provide invaluable data on intracellular architecture and organellar ultrastructure of autophagosomes in context with intra-autophagosome cargo.
Fluorescence Microscopy—Potential for the Measurement of Autophagic Flux and Autophagosome Pool Size
Fluorescence microscopy techniques, based on wide-field fluorescence or confocal microscopy, fulfill the requirements for a quantitative flux analysis as they allow the measurement of a rate, and therefore also the flux. By optically sectioning and projecting the whole cell, they can also quantify the entities that participate in the multistep pathway accurately, such as a complete count of the number of autophagosomes (nA) in a single cell. Fluorescence microscopy is an extremely valuable tool as it allows the visualization of LC3-positive structures in living cells and tissues.Citation13,14 The quantitative assessment of the fluorescence signal of cells with numerous LC3-positive puncta or the number of LC3-positive structures per cell can be assessed accurately at a single-cell level. However, if not performed over time, the autophagosome pool size on its own cannot describe autophagic flux, as it does not describe the rate of entity turnover. The autophagic flux can be quantified only when completely blocking one of the steps in the pathway and measuring the initial rate of accumulation of the “substrate” for the inhibited step. Whether or not there is autophagic flux in the myocardium has successfully been estimated with the mCherry-LC3 transgenic mouse model.Citation15 Here, chloroquine was administered for 4 h via intraperitoneal injections after which cardiac tissue was harvested and the surface area of the fluorescence signal quantified by microscopy. The transgenic GFP-LC3 zebrafish also proved to be a potentially useful model for studying autophagic flux as its transparency enables direct monitoring of GFP-LC3 puncta by both wide field fluorescence or confocal microscopy.Citation16 Here, an indirect indication for a change in autophagic flux was given by using lysosomal protease inhibitors, added to the embryo water. However, for measuring the flux the rate of accumulation would have to be assessed. Fluorescence-based image data can additionally be strengthened by the utilization of a mRFP-GFP tandem fluorescent-tagged LC3, allowing the concomitant assessment of the total autophagosome pool size before and after fusion.Citation17 In this case the pH sensitivity of GFP is exploited, while mRFP remains stable when in contact with the acidic lysosomal environment. The extent of change in colocalization is thereby indicative of the rate of fusion between autophagosomes and lysosomes.Citation18 However, only an assessment over time can reveal the rate. Stably expressing GFP-LC3 cells assessed by fluorescence activated cell sorting offers a feasible means of quantifying autophagic activity by plotting the mean or geometric mean of a given cell population on an intensity histogram, normalized to its control signal.Citation19 This approach takes a large number of cells into account (usually a minimum of 10,000 events are acquired), and provides favorable statistical power. Although the above examples can potentially quantify flux by measuring the rate of accumulation, they are mostly used to infer whether or not autophagic flux is occuring and whether this flux increases or decreases.
Autophagic Flux Quantification Requires an Assessment of a Rate—for Example, the Autophagosome Accumulation Rate after Inhibition of Fusion
All the above described methods are extremely valuable in their own right, as they are able to indicate whether or not there is flux occuring in the system, and whether the flux increases or decreases, based on quantifying the change of a signal with and without fusion inhibition. However, being based on a single time point with or without, for example, bafilomycin A1 treatment, they cannot quantify the flux per se. It is very clear that, from all the methods discussed above, fluorescence microscopy has the greatest potential for measuring both the autophagosome pool size per cell as well as its change over time. One of the most direct ways recently employed to indicate autophagic flux is based on monitoring the decay of fluorescence signal of reporter proteins, using photoswitchable proteins. This has been successfully exploited in the context of macroautophagy,Citation20 chaperone-mediated autophagy (CMA)Citation21 and the proteasome,Citation22 and delivered invaluable information on the kinetics of the system under study. The primary strength of photoswitchable proteins, such as KFERQ-PS-CFP2 for CMA or Dendra2-LC3 for macroautophagy, lies in the assessment of fluorescence intensity over time, allowing the determination of half-lives for the specific protein.Citation20,21
Our concept complements this approach, allowing the calculation of autophagosome flux, J, based on the time-dependent change in total autophagosomal pool size after inhibition of autolysosomal fusion, as well as the transition time, τ, which, different from an intensity-based half-life, is derived from the flux and the total autophagosomal pool size. The transition time τ indicates the time of the system required to turn over its autophagosome pool, which provides an additional quantity that can be used to compare across systems. What is required to make this measurement? (i) A reliable means of counting the number of autophagosomes per cell at multiple points in time under control conditions, and (ii) distinct treatment conditions that completely block the fusion step (A, B) (for example, treatment with saturating concentrations of bafilomycin).Citation23 The change in autophagosome number, after complete inhibition of fusion is then plotted over time; the initial change in nA per time unit (e.g., hour) per cell is the autophagosome flux.
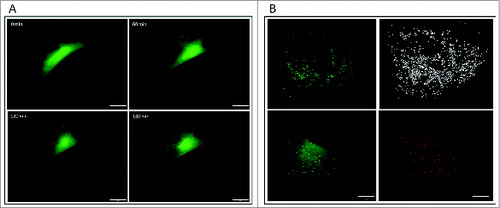
Figure 2. From a micrograph to a number. (A) Live-cell imaging of mouse embryonic fibroblasts stably expressing GFP-LC3 reveals accumulation of autophagosomes over time in the presence of bafilomycin A1. (B) Software solutions exist to assist in automated counting of the complete autophagosome pool. Scale bar: 20 μm (A) and 10 μm (B).
What Could a Methodological Approach for Quantitatively Measuring Autophagosome Flux Look Like?
First, it would require the measurement of the complete autophagosomal pool size per cell: all fluorescence image analysis must be based on z-stack acquisitions, in order to achieve an accurate measure of the complete intracellular autophagosome pool size. Hence, this requires the acquisition of images through optical sectioning, where a fluorescence microscope with automated z-stack control is needed. It is important to minimize acquisition time so as to avoid autophagosome movement during the acquisition process. In principle, the higher the resolution and the better the signal/noise ratio of the fluorescent signal, the more accurate the autophagosome count. Although a manual “touch count” per mouse click of autophagosomes can be performed on a projected stack, an automated count delivers an accurate count rapidly and objectively using an open source ImageJ plug-in based on a modified watershed algorithmCitation24 or the ‘particle count/analysis’ function. The parameter size for an image-based analysis approach should be optimized (here set to a voxel dimension of 0.07 for both x and y for the search parameters) in order to discern the actual signal from any background signal, which may be derived, for example, from cytosolic LC3-I (B).
Second, the counting of autophagosomes over time under control conditions without the presence of fusion inhibitors is required to show whether the system is at steady state, i.e., when the rate of change of the variable entity nA, the number of autophagomes/cell, is zero (A). It should be noted that autophagy is modulated by metabolic perturbations, nutrient availability and cell density, and the number of autophagosomes can therefore change moderately, especially over prolonged time periods. Feedback mechanisms that control MTOR activity, ATP availability, and amino acid pool size can all have an impact on autophagic flux.
Figure 3. Generation of progress curves I. (A) Counting of autophagosomes (nA) over time under control conditions is required to show whether the system is at steady state. (B) The quantitative measurement of the basal autophagosome flux, J, at steady state expressed as autophagosomes produced/cell/time. Here the autophagosome pool size differs (nA = 30, left and nA = 5, right), while the basal flux J = 5 is equal in both systems.
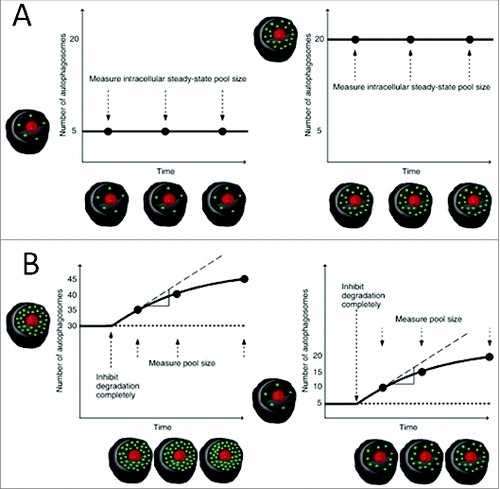
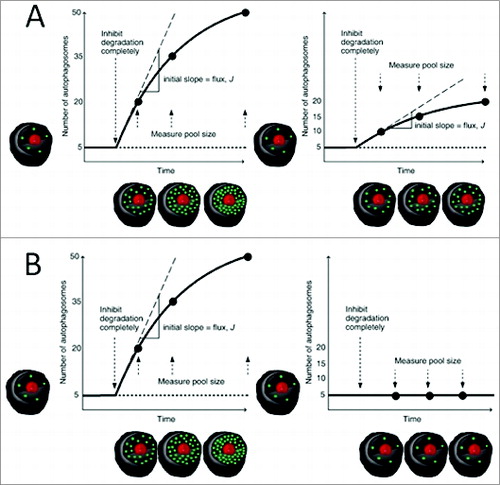
Third, in order to measure the basal autophagosome flux, cells are treated with a saturating concentration of a vacuolar-type H+-ATPase inhibitor such as bafilomycin A1,Citation23 and images acquired at a minimum of 3–5 time points. The saturating bafilomycin A1 has to be determined by fluorescence microscopy for each cell type separately prior to the flux analysis. Saturation is reached if upon further increase in inhibitor concentration no further increase in the initial rate of autophagosome accumulation is observed. The theoretical B, 4A and 4B show how the data should be plotted. The basal flux, J, is the initial slope of the progress curve at the point of inhibition of fusion. Since the slope provides the information required to derive the flux, how should the slope be calculated? It is the initial increase post-inhibition that needs to be carefully monitored for at least 2 h, but at smaller, i.e. 30 min, intervals, since only the initial slope reflects the autophagosome flux (dnA/dnt) given that other factors like changes in feedback mechanisms and protein synthesis will start taking effect. A major difference from currently established fluorescence-based methods lies in this approach to measure the slope after inhibition with bafilomycin A1, based on complete pool size analysis. Hence, flux can now be expressed as the change in the number of autophagosomes/cell/time. It is therefore very important to establish the bafilomycin A1 concentration that completely inhibits fusion of autophagosomes and lysosomes, i.e. no further slope increase with increasing inhibitor concentrations; otherwise a residual flux through the system will remain and mask the real flux data. Assessing fluorescence over time without this intervention and without focus on the slope post-inhibition will not provide these data. Note that the autophagosome flux data, as conceptualized here, should be derived from multiple cell images to offset inter-cell variability and cell cycle stage differences for proliferating cells. Moreover, the total experimental acquisition time can be matched with the cell cycle time for cells with a very short cell cycle time. Basal flux and increased/decreased flux data can be gathered within a 3–4 h time frame. After a short acquisition period to assess the steady state, the acquisition post inhibition with bafilomycin A1 can be minimized to 1 h, since the initial slope will provide the information required to calculate autophagosome flux. Note that the autophagosome pool size, nA, is not an indication of autophagosome flux (J): In B the steady-state autophagosome pool size differs between cellular systems (nA = 30 and nA = 5), but the basal flux J is equal in both (5 autophagosomes/cell/time). Likewise, in A nA in both systems is the same, but the flux J may differ and the extent of this difference can be calculated. Moreover, as explained by B, this approach not only measures J, but also shows whether there actually is a flux. Plotting of the data in this manner ( and ) allows the expression of the pool size as a relative difference, when comparing different systems or treatment conditions. In the example provided, the 2 cells are characterized by a 4-fold difference in autophagosome pool size (nA = 5 vs nA = 20), even though both of them are at steady state (A).
Figure 4. Generation of progress curves II. (A) The autophagosome pool is the same (nA = 5), while the basal flux J differs for the 2 systems (left J = 15; right J = 5). (B) A system with functional autophagosome synthesis (left) defined by its autophagosome pool size nA = 5 and a non-zero autophagosome flux J = 15 compared to a completely dysfunctional autophagosome maturation (right) with nA = 5 but no autophagosome flux (J = 0).
Fourth, the ratio nA/J of the autophagosome pool size and autophagosome flux is the transition time, τ, which should be calculated to indicate the turnover time of the autophagosome pool at steady state.Citation8 explains that autophagosome pool size per se does not indicate its turnover time, but rather that both flux and pool size determine the transition time. The smaller τ, the less time is required to completely replenish the autophagosome pool at steady state (). With these tools to quantitatively measure both the autophagosome pool, nA, and autophagosome flux, J, valuable additional information about the functional state of the autophagic system can be gained through direct comparison of relevant cell types or treatment interventions, such as the activation of the formation of autophagosomes by rapamycin.Citation25 It is important to note that different cell types, for example hepatocytes versus neurons, may have i) a different autophagosome number in basal state (nA) and ii) a different autophagosome flux (J) in basal state (dnA/dnt), and that an increase in the former is by no means necessarily accompanied by an increase in the latter. The transition time τ (nA/J) provides a robust measure of the relationship between autophagosome pool size and autophagosome flux and will allow the characterization of different cell types accordingly. The transition state τ could be of particular importance when assessing cells with either increased or dysfunctional autophagosome clearance behavior, such as degenerated neurons, cardiac myocytes, or cancer cells. When, for example, evaluating the response of a system to pharmacological regulators, the difference between the steady states of the treated and untreated (basal) system would be a distinguishing characteristic of that system. This difference is quantified by ΔnA, ΔJ, and Δτ, the changes in autophagosome pool size, flux and transition time upon intervention.
Figure 5. A comparison of 3 cellular systems that differ in terms of all 3 autophagic steady-state variables: flux J, autophagosome pool size nA, and transition time τ.
Concept or Reality?
In order to demonstrate the feasibility of the proposed conceptual framework, we performed preliminary experiments (Fig. S1 and S2), which not only indicate that the progress curves resemble those conceptualized in and , but also, that this approach can be easily implemented experimentally. In our preliminary experiments we tested 4 bafilomycin concentrations (Fig. S1) and chose 400 nM as the concentration required to completely inhibit fusion. Even 100 nM seemed to nearly fulfill this requirement, but with 400 nM we were confident that fusion was completely inhibited. Under these conditions the basal flux was measured to be 54 autophagosomes/cell/h and steady-state number of autophagosomes was approximately 45–50 (Fig. S1). Although an even higher flux seemed to be obtained at 800 nM, this bafilomycin A1 concentration clearly showed cytotoxic effects, leading to the cells shrinking and detaching from the plate. We also performed a set of preliminary experiments to measure changes in the autophagosome flux upon induction of autophagosome synthesis with rapamycin (Fig. S2). In these experiments the flux increased from its basal value of 54 to 135.5 autophagosomes/cell/h, and the number of autophagosomes doubled from ∼45–50 to ∼100. In addition, these results also show that, in the observed time frame, a new steady state is established 2 h after the addition of rapamycin. Figure S2 shows how nA, J and, concomitantly, τ, change upon experimental induction of autophagy. Upon rapamycin treatment, the transition time decreased from ∼1 h to 0.74 h. In order to perform statistical analyses, these data of course need to be obtained from multiple cells under multiple experimental conditions. Maximal autophagic capacities and response/sensitivity to pharmacological regulators may be tested in that way and values directly compared between different cellular model systems.
Summary and Concluding Remarks
The autophagic system is a multistep pathway along which primarily long-lived proteins are degraded. Although we have made major methodological advances in our approaches to dissecting molecular mechanisms that regulate the autophagic machinery, the measurement of autophagic flux in a sensitive, robust, and well-quantifiable manner has remained a challenge, partly because of different perceptions of what the concept of autophagic flux actually entails. Here we have provided a conceptual framework for defining autophagosome flux that is consistent with the concept of metabolic flux, and described an approach for measuring it quantitatively. Our conception of the autophagic pathway is analogous to that of a metabolic pathway, which consists of a sequence of steps each characterized by its own rate. Each step rate is quantified by the number of entities processed per cell per time unit. The variable entities (nA) that participate in the multistep autophagic pathway are the autophagosomes, the autolysosomes, and the amino acids (Box 1). The autophagosome flux J is the rate of flow of the cellular system at steady state. Autophagosome flux can be quantified experimentally by completely blocking one of the steps in the pathway and measuring the initial rate of accumulation in the substrate for the inhibited step, such as, for example, the rate of autophagosome accumulation upon complete inhibition of the lysosomal fusion step. Based on this definition, which has been utilized in the field of metabolic control analysis for decades, we provided a theoretical account that describes the assessment of i) a complete autophagosome pool size, ii) autophagosome flux and iii) the transition time of the autophagosome pool.
It should be noted that a time lag may exist between a change in autophagosome flux and the corresponding change in substrate clearance flux. It also needs to be taken into account that autophagosome flux may be different from substrate clearance flux, since cargo import into lysosomes can also be facilitated by, for example, CMA or microautophagy, and each cargo may have, depending on the kinetics of the degradative enzymes, its own cargo-specific clearance flux. The methodological approach conceptualized in this paper is only for quantifying autophagosome flux; it measures the autophagosome turnover, which may or may not be equal to the substrate clearance flux. This is especially true when the system is in a transient state where the individual rates of the autophagosome pathway are still changing. Whether or not cargo degradation flux equals autophagosome flux at steady state can be assessed by complementing autophagosome flux data with substrate clearance flux data, for example by using cargo-specific photoswitchable proteins such as Dendra2-SQSTM1/p62 or by assessing cycloheximide-induced cargo decay.Citation26 The rate of degradation of a particular cargo of course depends on the activity of a specific set of enzymes; a decrease in degradative enzyme activity could lead to the accumulation of a single cargo without any change in the autophagosome flux. An example is the mutation in the GLA (galactosidase, alpha) gene leading to a decreased lysosomal GLA activity with the resultant cargo (glycosphingolipids) accumulation.Citation27 It should also be noted that the protein expression levels of the cargo protein may be affected over time, and may itself be dependent on autophagically-generated amino acids.Citation26 Hence, a complementary assessment of amino acid pool size as well as MTOR activity state will provide additional information contextualizing the autophagosome flux data.
Based on this method to quantitatively measure autophagosome flux, valuable information about the functional state of the autophagic system can be gained: direct comparison of relevant cell types in terms of autophagosome pool size (nA), basal flux J, as well as the transition time τ = nA/J. Autophagic modulators can now in principle be used to titrate the autophagosome flux to a desired value. The method described here may complement and strengthen western blot analysis, TEM, and fusion construct data at selected time points. This concept may serve as a tool upon which to expand in the future with lysosomal and even endosomal pool size data and their respective fluxes, under the inclusion of colocalization as well as ratiometric signal data derived from LC3 tandem fluorescent constructs or luciferase-based assays.Citation28,29 A systematic implementation of the concept proposed may, however, require the modification of high-throughput imaging platformsCitation20,30,31 in order to quantify autophagosome flux by exchanging i) the measured GFP-LC3 spot intensity for an autophagosome pool size number, ii) single image frames for complete z-stacks, iii) a 20x objective with a high NA oil immersion-based 60x or 100x objective, and iv) fixation for a live-cell imaging approach. It would also be important to contextualize the data with methods that probe for endogenous markers, to control for overexpression-derived fluorescent signal. The concomitant analysis of LC3-II and SQSTM1/p62 through western blotting as well as EM-based morphometrics will therefore be advantageous. The application of this concept by using stably transfected mRFP-GFP-LC3 cell lines will contribute in addition to the stochiometry of autophagosome, autolysosome, and lysosome pool size.
This may enable us to generate data that i) characterize basal autophagosome flux quantitatively in key cell and tissue types of clinical/research model relevance, and ii) characterize deviations in autophagosome flux in cell and tissue types of key disease states or conditions with cell death manifestation.Citation32 In addition, it may assist in the scoring of MTOR-dependent and -independent autophagy inducers as well as autophagy inhibitors, in the screening for pharmacological regulators of autophagy such as the small molecule kinase inhibitors targeting the class I phosphoinosite 3-kinase-protein kinase B-MTORC1 axis.Citation31,33 and Citation34 Finally, this approach will be required to perform flux-control analyses, so as to identify the control over autophagosome flux as opposed to the homeostatic regulation of the autophagosome pool size.Citation35
Supplemental_Figures_and_Captions.zip
Download Zip (87.7 KB)Acknowledgements
We wish to thank DJ Klionsky, University of Michigan, US, for inspirational and fruitful discussions and for the helpful editing of the manuscript, N Mizushima, University of Tokyo, for the provision of the GFP-LC3 MEF cells as well as T Gniadek, Yale University, for valuable information related to the ImageJ Watershed plug-in. The authors acknowledge financial support from the South African National Research Foundation (NRF) and the Medical Research Council (MRC), South Africa. Any opinion, findings, and conclusions or recommendations expressed in this material are those of the authors, and therefore the NRF does not accept any liability in regard thereto.
References
- Klionsky DJ, Abdalla FC, Abeliovich H, Abraham RT, Acevedo-Arozena A, Adeli K, et al. Guidelines for the use and interpretation of assays for monitoring autophagy. Autophagy 2012; 8:445-544; PMID:22966490; http://dx.doi.org/10.4161/auto.19496
- Kacser, H, Burns, JA and Fell, DA. The control of flux: 21 years on. Biochem. Soc. Trans. 1995; 23:341-366; PMID:7672373
- Hofmeyr, J-HS Metabolic control analysis in a nutshell, in Proc. of the 2nd International Conference on Systems Biology (Yi TM, Hucka M, Morohashi M & Kitano H. (Eds.), Wisconsin: Omnipress, 2001; 291-300.
- Boland B, Kumar A, Lee S, Platt FM, Wegiel J, Yu WH, Nixon RA. Autophagy induction and autophagosome clearance in neurons: relationship to autophagic pathology in Alzheimer's disease. J Neurosci. 2008; 28:6926-37; PMID:18596167; http://dx.doi.org/10.1523/JNEUROSCI.0800-08.2008
- White E. Exploiting the bad eating habits of Ras-driven cancers. Genes Dev. 2013; 1;27(19):2065-71; PMID:24115766; .http://dx.doi.org/10.1101/gad.228122.113
- Przyklenk K, Reddy Undyala VV, Wider J, Sala-Mercado JA, Gottlieb RA, Mentzer, Jr. RM. Acute induction of autophagy as a novel strategy for cardioprotection: Getting to the heart of the matter. Autophagy 2011; 7:432-433; PMID:21187719; http://dx.doi.org/10.4161/auto.7.4.14395
- Noda T, Klionsky, DJ. The quantitative pho8Δ60 assay of nonspecific autophagy. Meth. Enzymol. 2008; 451, 33-42; PMID:19185711; http://dx.doi.org/10.1016/S0076-6879(08)03203-5
- Easterby JSA. A generalised theory of the transition time for sequential enzyme reactions. Biochem. J. 1981; 199:155-161; PMID:7337699
- Mizushima N, Yoshimori T. How to Interpret LC3 Immunoblotting. Autophagy 2007; 3:542-545; PMID:17611390
- Rubinsztein DC, Cuervo AM, Ravikumar B, Sarkar S, Korolchuk VI, Kaushik S, Klionsky DJ. In search of an “autophagomometer”. Autophagy 2009; 5:585-589; PMID:19411822; http://dx.doi.org/10.4161/auto.5.5.8823
- Tanida, I., Waguri, S. Measurement of autophagy in cells and tissues. Protein misfolding and cellular stress in disease and aging: concepts and protocols. Methods Mol. Biol. 2010; 648, 193-196; ISBN: 978-1-60761-755-6.
- Swanlund JM, Kregel KC, Oberley TD. Investigating autophagy: Quantitative morphometric analysis using electron microscopy. Autophagy 2010; 6:270-277; PMID:19923921; http://dx.doi.org/10.4161/auto.6.2.10439
- Bampton ETW, Goemans CG, Niranjan D, Mizushima N, Tolkovsky AM. The Dynamics of Autophagy Visualised in Live Cells: from Autophagosome Formation to Fusion with Endo/lysosomes. Autophagy 2005; 1:23-36; PMID:16874023; http://dx.doi.org/10.4161/auto.1.1.1495
- Ni H, Bockus A, Wozniak AL, Jones K, Weinman S, Yin X, Ding W. Dissecting the dynamic turnover of GFP-LC3 in the autolysosome. Autophagy 2011; 7:188-204; PMID:21107021; http://dx.doi.org/10.4161/auto.7.2.14181
- Iwai-Kanai E, Yuan H, Huang C, Sayen MR, Perry-Garza CN, Kim L, Gottlieb RA. A method to measure cardiac autophagic flux in vivo. Autophagy 2008; 4:322-329; PMID:18216495
- He C, Klionsky DJ. Analyzing autophagy in zebrafish. Autophagy 2010; 6:642-644; PMID:20495344; http://dx.doi.org/10.4161/auto.6.5.12092
- Kimura S, Noda T, Yoshimori T. Dissection of the Autophagosome Maturation Process by a Novel Reporter Protein, Tandem Fluorescent-Tagged LC3. Autophagy 2007; 3:452-460; PMID:17534139
- Furuta N, Amano A. Cellular machinery to fuse antimicrobial autophagosome with lysosome. Communicative & Integrative Biology 2010; 3:385-387; PMID:20798834; http://dx.doi.org/10.4161/cib.3.4.12030
- Shvets E and Elazar Z. Flow cytometric analysis of autophagy in living mammalian cells. Meth. Enzymol. 2009; 452:131-141; PMID:19200880; http://dx.doi.org/10.1016/S0076-6879(08)03609-4
- Tsvetkov AS, Arrasate M, Barmada S, Ando DM, Sharma P, Shaby BA and Finkbeiner S. Proteostasis of polyglutamine varies among neurons and predicts neurodegeneration. Nat Chem Biol 2013; 9:586-592; PMID:23873212; http://dx.doi.org/10.1038/nchembio.1308
- Koga H, Martinez-Vicente M, Macian F, Verkusha VV and Cuervo AM. A photoconvertible fluorescent reporter to track chaperone-mediated autophagy. Nat Commun 2011; 2:386. doi: 10.1038/ncomms1393; PMID:21750540
- Vilchez D, Morantte I, Liu Z, Douglas PM, Merkwirth C, Rodrigues APC et al. RPN-6 determines C.elegans longevity under proteotoxic stress conditions. Nature 2012; 489(7415):263-8. doi: 10.1038/nature11315; PMID:22922647
- Sarkar S, Davies JE, Huang Z, Tunnacliffe A and Rubinsztein DC. Trehalose, a novel mTOR-independent autophagy enhancer, accelerates the clearance of mutant huntingtin and alpha-synuclein. J Biol Chem. 2007; 282(8):5641-52; PMID:17182613; http:// dx.doi.org/10.1074/jbc.M609532200
- Gniadek TJ and Warren G. WatershedCounting3D: A New Method for Segmenting and Counting Punctate Structures from Confocal Image Data. Traffic 2007; 8: 339-346; PMID:17319897; http://dx.doi.org/10.1111/j.1600-0854.2007.00538.x
- Blommaart EF, Luiken JJ, Blommaart PJ, van Woerkom GM and Meijer AJ. Phosphorylation of ribosomal protein S6 is inhibitory for autophagy in isolated rat hepatocytes. J Biol Chem. 1995; 270(5):2320-6; PMID:7836465; http:// dx.doi.org/10.1074/jbc.270.5.2320
- Sahani MH, Itakura E and Mizushima N. Expression of the autophagy substrate SQSTM1/p62 is restored during prolonged starvation depending on transcriptional upregulation and autophagy-derived amino acids. Autophagy. 2014; 3;10(3), 431-441; http://dx.doi.org/10.4161/auto.27344; PMID:24394643
- Brady RO, Gal AE, Bradley RM, Martensson E, Warshaw AL, Laster L. Enzymatic defect in Fabry's disease-Ceramidetrihexosidase deficiency. N Engl J Med 1967; 276:1163-1167; doi: 10.1056/NEJM196705252762101; PMID:6023233
- Farkas T, Høyer-Hansen M, Jäättelä M. Identification of novel autophagy regulators by a luciferase-based assay for the kinetics of autophagic flux. Autophagy 2009; 5:1018-1025; PMID:19652534; http://dx.doi.org/10.4161/auto.5.7.9443
- Ketteler, R. and Seed, B. 2008. Quantitation of autophagy by luciferase release assay. Autophagy 2008; 16 (4), 801-806; PMCID: PMC2910585
- Sarkar S. Chemical screening platforms for autophagy drug discovery to identify therapeutic candidates for Huntington's disease and other neurodegenerative disorders. Drug Discov Today Technol 2013; 10:137-44; PMID:24050242; http://dx.doi.org/10.1016/j.ddtec.2012.09.010
- Zhang L, Yu J, Pan H, Hu P, Hao Y, Cai W et al. Small molecule regulators of autophagy identified by an image-based high-throughput screen. Proc Natl Acad Sci U S A. 2007; 104(48):19023-8; PMID:18024584
- Loos B, Engelbrecht A, Lockshin RA, Klionsky DJ and Zakeri Z. The variability of autophagy and cell death susceptibility: Unanswered questions. Autophagy 2013; 9:1270-1285; PMID:23846383; http://dx.doi.org/10.4161/auto.25560
- Balgi AD, Fonseca BD, Donohue E, Tsang TC, Lajoie P, Proud CG et al. Screen for chemical modulators of autophagy reveals novel therapeutic inhibitors of mTORC1 signaling. PLoS One 2009; 22;4(9); PMID:19771169; http://dx.doi.org/10.1371/journal.pone.0007124
- Renna M, Jimenez-Sanchez M, Sarkar S, Rubinsztein DC. Chemical inducers of autophagy that enhance the clearance of mutant proteins in neurodegenerative diseases. J Biol Chem 2010; 9;285(15):11061-7; PMID:20147746; http://dx.doi.org/ 10.1074/jbc.R109.072181
- Hofmeyr J-H S and Cornish-Bowden A. Regulating the cellular economy of supply and demand. FEBS Lett. 2000; 476: 47-51; PMID:10878248