
Abstract
The hypoxia inducible transcription factor HIF1 activates autophagy, a general catabolic pathway involved in the maintenance of cellular homeostasis. Dysfunction in both autophagy and HIF1 has been implicated in an increasing number of human diseases, including inflammatory bowel disease (IBD), such as Crohn disease (CD). Adherent invasive E. coli (AIEC) colonize ileal mucosa of CD patients and strongly promote gastrointestinal inflammatory disorders by activation of HIF-dependent responses. Here, we aim to characterize the contribution of HIF1 in xenophagy, a specialized form of autophagy involved in the degradation of intracellular bacteria. Our results showed that endogenous HIF1A knockdown increased AIEC survival in intestinal epithelial cells. We demonstrate that the increase in survival rate correlates with a dramatic impairment of the autophagic flux at the autolysosomal maturation step. Furthermore, we show that AIEC remained within single-membrane LC3-II-positive vesicles and that they were unable to induce the phosphorylation of ULK1. These results suggested that, in the absence of HIF1A, AIEC were found within LC3-associated phagosomes. Using blocking antibodies against TLR5 and CEACAM6, the 2 well-known AIEC-bound receptors, we showed that downstream receptor signaling was necessary to mediate ULK1 phosphorylation. Finally, we provide evidence that HIF1 mediates CEACAM6 expression and that CEACAM6 is necessary to recruit ULK1 in a bacteria-containing signaling hub. Collectively, these results identify a new function for HIF1 in AIEC-dedicated xenophagy, and suggest that coactivation of autophagy and HIF1A expression may be a potential new therapy to resolve AIEC infection in CD patients.
Abbreviations:
- AIEC, adherent invasive E. coli
- AMPK, AMP-activated protein kinase
- ATG5, autophagy-related 5
- ATG16L1, autophagy-related 16-like 1
- BNIP3L, BCL2/adenovirus E1B 19kDa interacting protein 3-like
- BECN1, Beclin 1, autophagy-related
- CD, Crohn disease
- CEACAM6, carcinoembryonic antigen-related cell adhesion molecule 6 (nonspecific cross reacting antigen)
- CRTC1/TORC1, CREB regulated transcription coactivator 1
- EEA1, early endosome antigen 1
- GFP, green fluorescent protein
- HBSS, Hank's balanced salt solution
- HIF1A, hypoxia inducible factor 1, α subunit (basic helix-loop-helix transcription factor)
- IBD, inflammatory bowel disease
- IRGM, immunity-related GTPase family, M
- LAP, LC3-associated phagocytosis
- MAP1LC3-II (LC3-II), microtubule-associated protein 1 light chain 3-II
- MOI, multiplicity of infection
- SQSTM1/p62 (SQSTM1), sequestosome 1
- TEM, transmission electron microscopy
- TLR5, toll-like receptor 5
- ULK1, unc-51 like autophagy activating kinase 1
- VAV2, vav 2 guanine nucleotide exchange factor
Introduction
The HIF family is comprised of 3 members, HIF1, HIF2, and HIF3, composed of a specific oxygen-sensitive α subunit (HIF1A, EPAS1, or HIF3A, respectively) and a β-subunit (ARNT, ARNT2, or ARNTL). Both subunits are constitutively expressed, but the α subunit is degraded via an oxygen-dependent process involving prolyl hydroxylases, which have been described as oxygen sensors.Citation1 To date, HIF1A is the most studied α subunit. In response to a reduction in oxygen tension, stabilized HIF1A migrates to the nucleus, binds ARNT/HIF1B to form HIF1, which then binds to a hypoxic response element to trigger upregulation of a panel of genes which, in turn, maintain biological homeostasis.Citation2 A part of the well-described HIF1 activation under hypoxia, it is now understood that HIF1A accumulation and HIF1 transcriptional activation can result from growth factors or lipopolysaccharide challengeCitation3 and inflammatory conditions.Citation4 Further, we recently demonstrated that HIF1 promotes the induction of angiogenesis and inflammation in response to infection with E. coli entero-pathogenic strains.Citation5,6
Autophagy is an ancestral pathway which maintains cellular homeostasis by degrading long-lived proteins and removing unwanted or unnecessary intracellular components.Citation7 Many reports have highlighted multiple roles of autophagy in the regulation of cell death, differentiation, immunity, and antimicrobial response in mammals.Citation7,8 Autophagy is a multistep process starting with the formation of a double-membrane vesicle, named the phagophore, which sequesters cytosolic components. Once the vesicle is closed it becomes an autophagosome, which subsequently fuses with a lysosome to form an autolysosome where the content is degraded.Citation9 As a chief orchestrator of gene induction, HIF1 drives autophagy. Mechanisms underlying this regulation involve hypoxia-induced BNIP3 (BCL2/adenovirus E1B 19kDa interacting protein 3) and BNIP3L (BCL2/adenovirus E1B 19kDa interacting protein 3-like) which, by disrupting the BCL2–BECN1 (Beclin 1, autophagy-related) complex, increase the level of free BECN1 and therefore facilitate genesis of the phagophore.Citation10 Xenophagy is the type of autophagy that targets and degrades intracellular bacteria.Citation11 Some bacteria are able to impair this process or exploit it in order to survive in cells.Citation12 This is the case with AIEC, which can be found within autophagosomes of immuneCitation13,14 and epithelial cells;Citation15,16 intracellular survival of bacteria leads to increased production of inflammatory cytokines.
AIEC, which colonize ileal mucosa of CD patients,Citation17,18 participate in the pathogenesis of this inflammatory bowel disease by increasing proinflammatory and proangiogenic responses.Citation6 AIEC express several virulence factors that are involved in bacteria ability to adhere and to invade intestinal epithelial cells. Type 1 pili are essential to promote bacterial adhesion through the binding to CEACAM6 (carcinoembryonic antigen-related cell adhesion molecule 6 [nonspecific cross-reacting antigen]), a glycoprotein overexpressed on the apical surface of intestinal epithelial cells, whereas, outer membrane proteins (OmpC), outer membrane vesicles (OmpV) and flagella mediate the invasive properties of AIEC. In addition to mediating invasive properties, flagella regulate type 1 pili expression and activate, through the TLR5 (toll-like receptor 5) receptor, various signaling pathways.Citation6,19-21
In the past decade, genome-wide association studies revealed IBD as complex multigenic disorders and emphasized CD as an autophagy disease.Citation22 In particular, ATG16L1 (autophagy-related 16-like 1) and IRGM (immunity-related GTPase family, M), 2 autophagy genes, were related to CD; these observations were confirmed in mouse models where ATG16L1 and IRGM are required for bacterial clearance.Citation23 In agreement with these reports, we have recently demonstrated that a tight regulation of IRGM expression controls intracellular replication of AIEC by autophagy.Citation15
Evidence suggests that HIF1 participates in xenophagy. First, HIF1 induces autophagy and mitophagy, the latter corresponding to autophagic degradation of mitochondria, which are nothing other than ancestral proteobacteria. Second, AIEC induce HIF1A accumulation, and third, autophagy participates in the clearance of AIEC. Here we demonstrated that HIF1 regulates xenophagic degradation of AIEC in intestinal epithelial cells.
Results
Intracellular survival of AIEC depends on HIF1A in intestinal epithelial cells
We have previously demonstrated that AIEC LF82 bacteria promote gastrointestinal inflammatory disorders by activation of HIF-dependent responses.Citation6 HIF1 is described to induce the general macroautophagy pathway; we therefore aimed to characterize its contribution in the particular AIEC-dedicated xenophagy. For that purpose we used the HIF1A-silenced T84 intestinal epithelial cells (T84-ShHIF1A) previously described in Cane, et al.Citation5 and as illustrated in Fig. S7B. As shown in , the intracellular survival of AIEC LF82 bacteria was 2.5-fold higher in cells silenced for HIF1A compared to cells transduced with control empty vector (ShCTR). Further, we have analyzed AIEC LF82 intracellular survival in cells silenced for 2 proteins involved in the autophagic machinery, namely SQSTM1/p62 (sequestosome 1) and ATG5 (Fig. S1). We observed that AIEC survival was increased in both cell lines, with a 2.5-fold increase for SQSTM1 and 2-fold for ATG5 as compared to control-treated cells. To bring additional evidence to the role of HIF1A in AIEC intracellular survival, we examined intracellular bacteria via transmission electron microscopy (). Sixteen h after infection of T84-ShCTR cells, electron dense bacteria were present within multilamellar vesicles. Bacteria localized within double-membrane vesicles were likely being degraded, as we observed loss of bacterial membrane and regular round shape (Fig. S2). In contrast, in cells silenced for HIF1A, SQSTM1, or ATG5, round-shaped bacteria were surrounded by bacterial membrane. Further, we observed that healthy electron dense AIEC bacteria were intracytoplasmic in ShSQSTM1 and ShATG5 cells, whereas they were colocalized with cytoplasmic materials in intracellular vesicles in ShHIF1A cells.
Figure 1. Survival of AIEC is increased in cells silenced for HIF1A. (A) The survival of bacteria was measured by the gentamicin protection assay. After 2 h of infection (10 MOI), intestinal epithelial T84-ShCTR, -ShHIF1A, ShSQSTM1 and ShATG5 cells were incubated with gentamicin (100 μg/ml) for 1 and 5 h. Cells were washed with PBS and lysed with PBS 1% Triton X-100. The colony forming units were determined on LB agar plates and AIEC survival was expressed as indicated in Materials and Methods section. The data are representative of 4 independent experiments. *P < 0.05 as compared to T84-ShCTR cells. (B) Representative electron micrographs of T84-ShCTR, T84-ShHIF1A, T84-ShATG5 and T84-ShSQSTM1 cells infected with AIEC LF82 (MOI of 10) 16 h in presence of gentamycin. Arrows denoted degraded bacteria in an autolysosome (1), healthy bacteria in vesicles containing cytosolic material (2), healthy bacteria free in the cytosol (3) and healthy bacteria within single-membrane vesicle (4).
HIF1A allows AIEC targeting to functional autolysosomes
Since we provided evidence for the role of HIF1A in degradation of intracellular AIEC, we investigated whether HIF1A has an impact on AIEC LF82-induced autophagic machinery. Activation of autophagy was assayed by formation of LC3-II (microtubule-associated protein 1 light chain 3 conjugated to PE) by western blot experiments. As shown in and Fig. S3, infection of T84-ShCTR with AIEC LF82 bacteria induced the formation of LC3-II, confirming that live AIEC are efficient inducers of autophagy in intestinal epithelial cells. Interestingly, we observed that AIEC induced the formation of LC3-II in ShHIF1A cells, suggesting that HIF1A is not required for LC3 lipidation. Because autophagy is a dynamic process, the only way to check autophagy impairment is to analyze flux dynamics. Therefore, we assayed the accumulation of LC3-II in cells pretreated with a combination of E64d and pepstatin A, lysosomal protease inhibitors. Inhibition of the autophagic flux in T84-ShCTR cells resulted in the increase of LC3-II protein by 3.3 fold. As expected, when cells were further infected with bacteria the relative quantity of LC3-II was higher than that with bacteria or inhibitor alone. On the contrary, we observed that treatment of T84-ShHIF1A with E64d and pepstatin A resulted in a 1.8-fold accumulation of LC3-II as compared to the 3.3 fold observed in control cells. These results strongly support the hypothesis of a defect in the autophagic flux. In agreement with such a defect, LC3-II formation in response to bacteria and lysosomal protease inhibitors was not additive. Taken together, these results demonstrate that bacteria induce autophagic flux in intestinal epithelial cells and highlight a role of HIF1A in this process.
Figure 2. Inhibition of autophagic flux in cells silenced for HIF1A. Control and HIF1A-silenced T84 cells were infected with AIEC LF82 at a MOI of 10 for 2 h then gentamicin (100 μg/ml) was added for 4 h. Cells were processed for immunoblotting (A), ultra-structural TEM analysis (B) and immunofluorescence (C). (A) Autophagic flux was analyzed by immunoblot analysis with LC3-II antibody in cells infected for 6 h (2 + 4) with AIEC LF82 bacteria (MOI 10) in the absence or in the presence of E64d and pepstatin A. ACTB was used as a loading control. Results from 4 independent experiments were quantified as described in Materials and Methods; the values of untreated T84-ShCTR and ShHIF1A cell samples were then set to 1 and the fold increase was calculated. *P < 0.05 as compared to uninfected conditions. (B) Representative electron micrographs of T84-ShCTR and T84-ShHIF1A cells infected with AIEC LF82 (MOI of 10) 16 h in presence of gentamycin. Arrows denoted degraded bacteria characterized by loss of bacterial membrane and regular round shape (1), vesicle containing partially degraded rough endoplasmic reticulum (2), intact healthy bacteria (3) and intact cytoplasm (4). (C) Representative confocal microscopy examinations of GFP-LF82 infected ShCTR and ShHIF1A cells stained with anti-LC3-II (red, marker of autophagy vesicles) and anti-LAMP1 (blue, marker of mature lysosomes) antibodies showing that LF82 bacteria remained within LC3-II-positive vesicles in cells invalidated for HIF1A. Quantification was performed as described in the Materials and Methods section. Results from 3 independent experiments are shown. *P < 0.05 as compared to T84-ShCTR cells in the same condition.
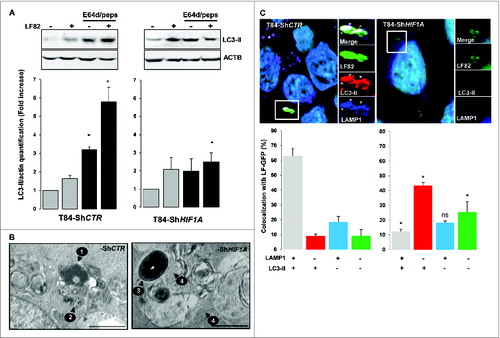
Autophagy is a multistep process that induces the formation of very specific cellular structures characterized by their limiting membranes and their intracellular content.Citation9 To determine which autophagy step is impaired in T84-ShHIF1A, we analyzed transmission electron microscopy images of infected-T84-ShCTR and infected-T84-ShHIF1A cells. In control cells, AIEC LF82 bacteria were present within vesicles containing partially degraded rough endoplasmic reticulum, characteristic of degradative autophagic vesicles ( and Fig. S2). Loss of bacterial membrane further confirmed the degradative nature of these vesicles. In infected cells silenced for HIF1A, healthy electron dense bacteria were compartmentalized in vesicles containing multilamellar structures and morphologic intact cytoplasm, which suggests that bacteria stay within early autophagic vesicles.
Autophagy is initiated by the formation of a phagophore that matures into an LC3-II-positive double membrane named autophagosome. The autophagosome further fuses with a lysosome to form an autolysosome allowing degradation of the autophagosome contents by lysosomal proteases. Single-membrane autolysosomes stain positive for LC3-II and LAMP1 (lysosomal-associated membrane protein 1). To gain insight into the role of HIF1A in the autophagic degradation of AIEC, we used immunofluorescence methods to characterize the nature of the vesicles containing bacteria. As shown in , 63% of AIEC were colocalized with LC3-II and LAMP1 vesicles in control cells whereas only 9% of the bacteria were localized in vesicles positive for LC3-II only. In contrast, in ShHIF1A cells the majority of the bacteria (43%) were colocalized within LC3-II-positive vesicles and only 12% of the bacteria were present in double-stained (LC3-II and LAMP1) vesicles. This result indicates that in the absence of HIF1A, bacteria stay within autophagosomes.
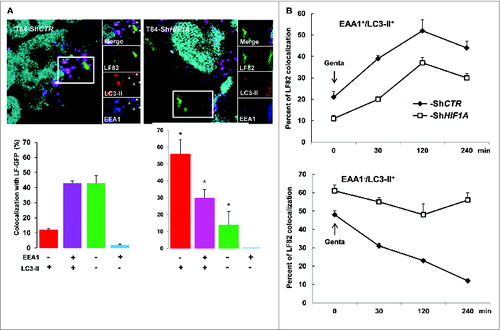
Autophagosomes sequentially mature to autolysosomes via fusion with endocytic early endosomes, tagged with EEA1 (early endosome antigen 1) and then late endosomes. We therefore questioned which step in the fusion process was affected by loss of HIF1A. For that purpose infected cells were stained with EEA1 and LC3-II (). In control cells 45% of LF82-GFP bacteria were colocalized with EEA1 and LC3-II, this value did not reach more than 30% in HIF1A-silenced cells. Quantification of AIEC adhesion and invasion into intestinal epithelial cells showed that this difference was due to a reduced ability of bacteria to adhere to and invade T84-ShHIF1A cells (data not shown). We observed in ShHIF1A cells that most bacteria (56%) remained in LC3-II-positive vesicles whereas they transited through LC3-II-positive vesicles in control cells. To address more precisely this difference, we further performed a timecourse analysis over a period of 4 h postinfection (). Interestingly, in both cell lines the number of vesicles positive for EEA1 and LC3-II increased during the first 2 h, then declined slowly. Despite a difference in the number of bacteria within vesicles (20% in control cells and 10% in HIF1A-silenced cells), the 2 curves have exactly the same profile, suggesting that fusion of autophagosomes with endocytic early endosomes was independent of HIF1A. By contrast, and as expected, most of the bacteria escaped LC3-II-positive vesicles during the 4-h time course in control cells, whereas they remained associated with LC3-II vesicles in ShHIF1A cells. Taken together, these results suggest that HIF1 participates in the maturation step of autolysosomes.
Figure 3. AIEC transit through vesicles positive for LC3 and EEA1. Control and HIF1A-silenced T84 cells were infected with AIEC LF82-GFP bacteria at a MOI of 10 for 2 h then gentamicin (100 μg/ml) was added for 4 h and cells were processed for immunofluorescence as described in Materials and Methods. (A) Representative confocal microscopy examinations of GFP-LF82-infected ShCTR and ShHIF1A cells stained with anti-LC3-II (red, marker of autophagic vesicles) and anti-EEA1 (blue, marker of early endosome) antibodies suggesting that LF82 bacteria are not retained within EEA1-positive vesicles in both cell lines. Results from 3 independent experiments are shown. *P < 0.05 as compared to T84-ShCTR cells in the same condition. (B) Time course of colocalization of LF82-GFP bacteria within early endocytosis vesicles. Control (full square) and HIF1A-silenced (empty square) cells were infected for 2 h with 10 MOI GFP-tagged LF82 bacteria and treated with gentamicin for the indicated time. After infection cells were fixed and stained with EEA1 and LC3-II antibodies. For each condition 30 to 50 bacteria were counted in order to investigate their localization. The data are representative of 2 independent experiments.
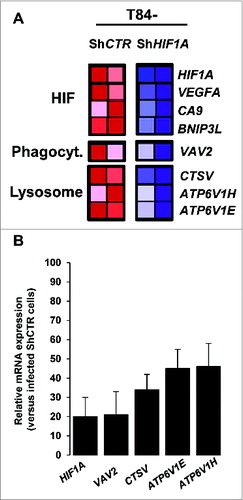
As a transcription factor, HIF1A regulates many genes. To investigate which of these genes may account for defective autolysosome maturation, AIEC-infected control and HIF1A-silenced cells were profiled using pangenomic microarrays. As a quality control we first verified that HIF1A and well-known HIF1-dependent genes (such as VEGFA [vascular endothelial growth factor A], CA9 [carbonic anhydrase 9] and BNIP3L), were downregulated in HIF1A-silenced cells (). As expected, control cells expressed high levels of HIF1A, VEGFA, CA9 and BNIP3L (red box), whereas HIF1A-deficient cells expressed lower levels (blue box). Further, among HIF1A-dependent downregulated genes, we focused our attention on those related to vesicle transport and lysosomal activity, considering that the default in autolysosome maturation observed in T84 ShHIF1A could be related to this particular cellular activity. As shown in , 4 potential candidates, namely, VAV2 (vav 2 guanine nucleotide exchange factors), CTSV/CTSL2 (cathepsin V) and ATP6V1H (ATPase, H+ transporting, lysosomal 50/57 kDa, V1 subunit H) and ATP6V1E (ATPase, H+ transporting lysosomal 31kDa, V1 subunit E1) were downregulated in infected-T84-ShHIF1A versus infected T84-ShCTR cells. These results were confirmed by quantitative PCR (). We then hypothesized that such a default in vesicle transport and lysosomal activity might have an impact on endocytosis, but we found that the endocytosis pathway was not impaired in cells silenced for HIF1A. Indeed, neither internalization of TRIC dextran (Fig. S4), nor EGFR (epidermal growth factor receptor) endocytosis (Fig. S5) were affected. Therefore, downregulated expression of those particular mRNAs does not affect endocytosis and cannot, by itself, explain the observed effect on autolysosome maturation.
Figure 4. Pangenomic microarray profiling HIF1A-induced xenophagic genes. (A) A microarray analysis reveals genes from the HIF and from phagocytosis and lysosome GSEA projection as a transcriptional target of HIF1A. Control and HIF1A-silenced cells were infected with AIEC LF82 bacteria for a 4 h-period and total RNA was extracted. The samples were then cohybridized to a pangenomic microarray. VAV2, CTSV, ATP6V1H and ATP6V1E downregulated expressions were detected by microarray. Hybridizations were performed in duplicate. (B) Quantification of the selected gene mRNA levels was measured by RT-PCR in AIEC LF82-infected T84-ShCTR and ShHIF1A cells. The inhibition of mRNA levels was confirmed for all the selected genes. Results shown are representative of 2 separate experiments made in duplicate.
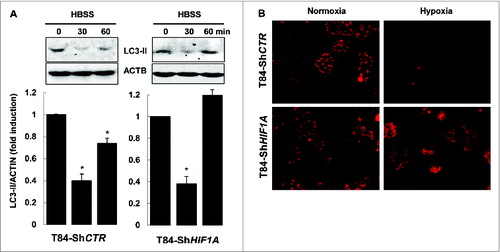
Finally, we demonstrated that only xenophagy was impaired in T84-ShHIF1A. First, by submitting cells to the nutrient starvation stress we showed that HBSS (Hank's balanced salt solution) triggered a decrease in the level of LC3-II in both control and HIF1A-silenced T84 cells. Such a decrease was transient; indeed LC3-II levels increased again after 1 h, suggesting that longer nutrient stress induced new LC3 conjugation (). This result demonstrated that the autophagic flux was normally induced by nutrient starvation in cells silenced for HIF1A. Second, we characterized mitophagy,Citation24 as this cellular response is dependent on HIF1.Citation25 For that purpose hypoxic vs. normoxic cells were incubated with MitoTracker Red. As expected, in control cells mitochondria were degraded under hypoxia, whereas MitoTracker Red staining was unchanged in cells silenced for HIF1A either in normoxia or hypoxia (). Taken together, these results highlighted a role for HIF1 in xenophagy, the specific autophagy involved in AIEC degradation.
Figure 5. HIF1A does not impair autophagy. (A) Nutrient stress-induced autophagy was characterized by immunoblot analysis with LC3-II antibody of cellular lysates from T84-ShCTR and T84-ShHIF1A incubated in HBSS for 0, 30 and 60 min, then lysed and subjected to sonication. The time course analysis indicates that the autophagic flux is functional in both cell lines. The data are representative of 3 independent experiments. (B) Mitophagy was assessed in T84-ShCTR and T84-ShHIF1A cells using a MitoTracker Red. Representative microscopy images show almost no mitochondria under hypoxia in control cells. By contrast, and as expected for a HIF1A-dependent response, mitochondria were stained by MitoTracker Red in HIF1A-silenced cells under normoxia and hypoxia.
In the absence of HIF1A, AIEC were localized in LC3-II-associated single-membrane phagosomes
Looking carefully at electron microscopy features of AIEC-infected ShHIF1A cells, we uncovered that live bacteria were within vesicles but none of those structures were double-membrane vesicles characteristic of autophagosomes ( and Fig. S2). Because bacteria remained within LC3-II-positive vesicles in ShHIF1A cells, we hypothesized that, in the absence of HIF1A, bacteria were localized within single-membrane phagosomes-conjugated to LC3-II, a process named LC3-associated phagocytosis or LAP. A convenient way to distinguish between autophagy and LAP is to study ULK (unc-51 like autophagy activating kinase 1) activation. Indeed, ULK kinases, the only Ser/Thr protein kinases among the ATG proteins, phosphorylate BECN1, an event that is required to induce autophagy.Citation26 There are 2 main ULK1 phosphorylation sites, Ser555 and Ser757.Citation27 Serine 555 (Ser555) phosphorylation is under the control of AMPK (AMP-activated protein kinase). In starved conditions, phosphorylated ULK1 (Ser555) induces autophagy.Citation28,29 First, we verified whether AIEC-LF82 bacteria stimulate AMPK phosphorylation. As shown in Fig. S6, a signal corresponding to phospho-AMPK increased in a time-dependent fashion in both control and HIF1A-depleted cells. Accordingly, the signal corresponding to phospho-ULK1 (Ser555) was increased in T84-ShCTR cells infected with LF82 bacteria (). By contrast, the level of phospho-ULK1 (Ser555) remained unchanged in ShHIF1A cells. Serine 757 phosphorylation (Ser757) is under the control of MTORC1. In the presence of glucose and other nutrients, ULK1 (Ser757) is phosphorylated preventing its association and activation by AMPK. Phosphorylation of ULK1 (Ser757) decreased on AIEC-LF82 infection independently of the presence of HIF1A, although basal phosphorylation levels were lower in T84-ShHIF1A (). The time-course analysis suggests that CRTC1/TORC1 (CREB regulated transcription coactivator 1) activity was repressed in response to LF82 infection with, as a consequence, a dephosphorylation of Ser757. However and in agreement with our previous observation,Citation6 phosphorylation of RPS6KB/S6K (another MTORC1 substrate) increased in both control and HIF1A-depleted cells (Fig. S6). Based on this apparently contradictory evidence, at least 2 potential scenarios can be proposed: LF82 induced an unknown specific ULK1 (Ser757) phosphatase or phosphorylation of MTORC1 substrates depends on their cellular localization. Taken together, the results on ULK1 phosphorylation sites demonstrate that AIEC-LF82 bacteria modify ULK1 phosphorylation and suggest that only phosphorylation of Ser555 is deregulated by HIF1A.
Figure 6. Lack of HIF1A favors LC3-associated phagocytosis. (A) Control and HIF1A-silenced T84 cells were infected with AIEC LF82 at a MOI of 10 for the indicated times. Cells were processed for immunoblotting using anti phospho- or total ULK1 antibodies. The time course indicated that bacteria induced ULK1 (Ser555) phosphorylation only in T84-ShCTR cells. Results from 3 independent experiments were quantified as described in Materials and Methods; signal corresponding to p-ULK/ULK normalized to ACTB was calculated for each condition. The values of T84-ShCTR infected 4 h with bacteria cell samples were set as 1 and the fold change was calculated. *P < 0.05 as compared to uninfected T84-ShCTR cells. (B) Prior to infection cells were incubated with both blocking TLR5 (Pab-hTLR5) and CEACAM6 (clone 9A6) antibodies or with anti CEACAM6 and anti TLR5 separately and further processed as described in (A). (C) Control, HIF1A-silenced T84 cells or control cells preincubated with both anti TLR5 and anti CEACAM6 blocking antibodies were infected with AIEC LF82 at a MOI of 10 for 2 h. Cells were then processed for immunofluorescence analysis in order to analyze the colocalization of LF82-GFP with ATG16L1 and ULK1. The data are representative of 2 independent experiments. *P < 0.05 as compared to the number of noncolocalized LF82-GFP bacteria.
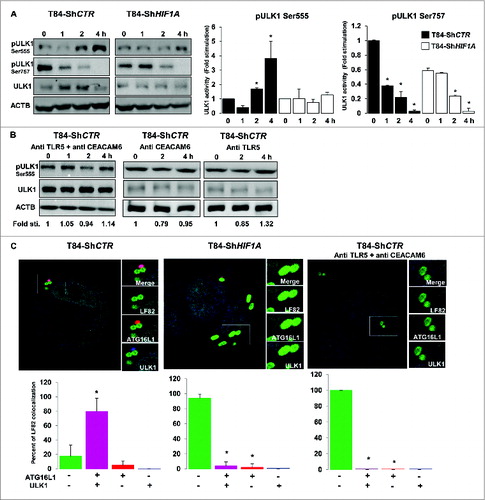
It was demonstrated that TLR signaling is linked to autophagy;Citation30 because we previously published that the binding of AIEC-LF82 type 1 pili to CEACAM6 enhances interaction of flagella with TLR5 which, in return, induces downstream signaling,Citation6 we questioned whether TLR5 and CEACAM6 could be involved in bacteria-induced ULK1 activation. For this purpose cells were preincubated with TLR5- and CEACAM6-blocking antibodies and phosphorylation of ULK1 (Ser555) was analyzed. As shown in , no phosphorylation was observed. Further, contribution of CEACAM6 and TLR5 was addressed separately. There was no phosphorylation of the Ser555 when cells were preincubated with the CEACAM6-blocking antibody, indicating that binding of bacteria to CEACAM6 was a prerequisite to stimulate ULK activity. Similarly, no phosphorylation was seen in cells preincubated with the TLR5-blocking antibody, suggesting that signaling elements downstream of TLR5 are necessary to mediate ULK activity. These results indicate that receptor signaling is required to mediate ULK phosphorylation in response to bacterial infection.
Keeping in mind that ULK phosphorylation requires TLR signaling,Citation44 we hypothesized that HIF1 may regulate the expression levels of AIEC-bound receptors, namely TLR5 and CEACAM6. First, we focused our attention on the toll receptor cascade, since AIEC express flagella and flagella bind to TLR5.Citation31,32 By contrast to HIF1-dependent genes, and except for TLR10 and TLR3, analysis of the code color indicated that TLRs expression was not clearly dependent on HIF1. In particular, the analysis showed that TLR5 expression was not different in ShCTR and ShHIF1A cells (Fig. S7A). Further, we focused on CEACAM6 expression as this protein plays a key role in adherence, invasion, and NFKB/NF-κB signaling.Citation6,31 As shown in Fig. S7B, loss of HIF1A expression correlated with loss of CEACAM6 expression. Indeed, it was shown that an increase in stability of HIF1 transcription factor triggered expression of CEACAM6.Citation33 Based on this result and on our previous observations on the role of CEACAM6 and TLR5 in LF82-induced proinflammatory responses, we reasoned that, in the absence of HIF1A (CEACAM6-depleted cells), the impairment of ULK1 Ser555 phosphorylation may be linked to a mislocalization of ULK. To test this hypothesis we performed immunofluorescence analysis to study the localization of ULK1 and ATG16L1, this latest being necessary to localize ULK1 to vesicles containing bacteria.Citation44 As shown in , in control cells 80% of AIEC were colocalized with ULK1 and ATG16L1 and only 18% of the bacteria were in vesicles negative for these 2 proteins. In contrast, in ShHIF1A cells the majority of the bacteria (94%) were localized within ULK1 and ATG16L1-negative vesicles whereas only 5% of the bacteria were present in double-stained vesicles. Recruitment of ATG16L1 to LF82-induced receptors likely precedes the relocalization of ULK1, since we observed a few bacteria with ATG16L1 and no bacteria with ULK1. Finally, there was no recruitment of ULK1 and ATG16L1 to AIEC-containing vesicles in control cells treated with TLR5- and CEACAM6-blocking antibodies.
All together, these results suggested the existence of a cooperative interaction between HIF1, CEACAM6 and TLR5 in inducing ULK1 activation and further mediating AIEC-induced xenophagy.
Discussion
In this study we provided a new basic understanding of the role of the hypoxic transcription factor HIF1 in autophagic degradation of AIEC within intestinal epithelial cells. Our cellular and molecular approaches provided evidence of a role for HIF1A in the degradation of invasive bacteria by xenophagy. One of the hallmarks of IBD being an alteration in the composition and diversity of the gut microbiota,Citation34 the observation that HIF1 controls bacterial degradation through xenophagy is of particular interest.
Phagocytosis is the most common innate immune mechanism allowing the removal of invading pathogens by professional phagocytic cells, mainly neutrophils and macrophages. Thus, pathogens have developed several strategies to escape lysosomal digestion. In return, cells have employed a second way of defense, xenophagy, which is a dedicated autophagy process involved in intracellular pathogen degradation. Some pathogens have further developed strategies to subvert autophagy and survive within intracellular vesicles or directly within the cytoplasm.Citation35 Some E. coli strains belong to this category, as their antigens have been found in the germinal centers of mesenteric lymph nodes and in macrophages from lamina propria of digestive biopsy of CD patients.Citation36-38 Further, and in agreement with the role for AIEC in CD pathogenesis, AIEC bacteria target M cells in the colitis mouse model, allowing a direct interaction with Peyer patches and macrophages within the lamina propria.Citation39 Finally, we and others have demonstrated that AIEC survival within macrophages, neutrophils, and intestinal epithelial cells lead to increased proinflammatory responses.Citation13,40 In parallel, genome-wide association studies have linked defects in autophagy (polymorphisms on ATG16L1 and IRGM, 2 autophagy-related genes) to CD pathogenesis.Citation22 Both in epithelial cells and macrophages, deregulated variant expression leads to altered antibacterial activity and abnormal persistence of AIEC with a substantial impact on the outcome of intestinal inflammation.Citation14,15
By deciphering molecular events linked to AIEC survival in intestinal epithelial cells deficient for HIF1A expression, we uncovered the role of ULK1 in AIEC-induced xenophagy. Although AIEC induced LC3 lipidation in both control and HIF1A-deficient cells, there are some differences between these 2 cell lines. One difference is that the autophagic flux is blocked, or largely impaired, in ShHIF1A cells. Another difference is that AIEC are found within single-membrane vesicles in ShHIF1A cells. The last difference, but not the least relevant, is that AIEC remain within LC3-II-positive vesicles, whereas they are targeted to autolysosomes (vesicles positive for LC3-II and LAMP1) in control cells. One possible explanation is that, in the absence of HIF1A, bacteria are sequestered via LAP. LAP is a type of phagocytosis observed in macrophages, where LC3 conjugates with single-membrane pathogen-containing phagosomes. In mammalian cells, this process promotes phagosome acidification and fusion with lysosomes.Citation41 We reported here that, in the absence of HIF1A, ULK1 is not phosphorylated by AIEC and bacteria remained within LC3-II-positive vesicles (, and ). These events correlate with an increase in AIEC survival (). Therefore, our results suggest that in intestinal epithelial cells bacteria degradation is less efficient via LAP vs. xenophagy. Such an observation can be explained in at least 2 ways. First, this noncanonical program facilitating lysosome fusion to single-membrane vacuoles is indeed less efficient than the classical autophagy pathway involving complex autophagy machinery to degrade intravesicular component. Second, in addition to its impact on ULK1 activity, HIF1 regulates the expression of proteins involved in vesicle trafficking or lysosome activity. In this context, screening of genes under the control of HIF1 revealed that VAV2, which belongs to the Dbl family of guanine exchange factors for Rho/Rac small GTPases, is downregulated in cells deficient for HIF1A expression.Citation42 With the Rho GTPase family as the actin cytoskeleton driver, it may be that the default in VAV2 expression correlates with an impairment in the phagocytosis process. We have also observed that CTSV is downregulated. Cathepsins are proteases involved in nonspecific bulk protein degradation within lysosomes. This protein family, which regulates a vast number of important biological functions, is involved in various pathological processes.Citation43 The result presented in , suggested that CTSV could play a role in AIEC degradation, a field of research that has not been extensively studied to date. Finally, the pangenomic microarray study has highlighted the potential function of proton-pumping V-type ATPase, with a downregulation of ATP6V1E (V1-E) and ATP6V1H (V1-H) subunits mRNA expression. By controlling the steady-state pH of the lysosome interior,Citation44 V-ATPase may be an important player in the xenophagic process. However, we should keep in mind that increased AIEC survival in cells deficient for HIF1A expression is undoubtedly the consequence of a combination of events, since neither endocytosis nor autophagy are defective in T84-ShHIF1A cells (, S4 and S5).
Here, we reported that AIEC-LF82 bacteria regulate ULK1 phosphorylation. Whereas a dephosphorylation of Ser757 is observed in both control and HIF1A-depleted cells, we provided evidence for an upregulation of Ser555 phosphorylation, which is indirectly dependent on HIF1A expression. Once phosphorylated by AMPK, activated ULK1 phosphorylates BECN1 at Ser41, a critical event in the formation of the phagophore.Citation26 As expected for the HIF1-dependent gene, we have shown that BNIP3L expression was downregulated in T84-ShHIF1A cells (). Thus, it could be that the quantity of BNIP3L present in the cells is not sufficient to disrupt the BCL2–BECN1 complex and, in return, there is not enough BECN1 to induce autophagy.Citation10 Even though we cannot rule out that such an explanation may participate in the observed autophagy impairment, it could not explain the lack of ULK1 phosphorylation. Having demonstrated that neither AMPK phosphorylation nor MTORC1 activity are affected by HIF1A deficiency (Fig. S6), we further demonstrated that TLR5- and CEACAM6-activated signaling pathways participate in the phosphorylation of ULK1 in response to AIEC infection as illustrated in . As previously described by Hara and coauthors,Citation45 we showed here that activation of ULK1 by AIEC-LF82 bacteria coincides with its colocalization with ATG16L1. It was previously known that ATG16L1 brings a link between invading pathogens, autophagy, and regulation of inflammation. Indeed, following induction of TLR4 signaling by lipopolysaccharide, macrophages from mice expressing an ATG16L1-deficient variant (the same mutation found in CD patients) produce high amounts of inflammatory cytokines.Citation46 Furthermore, Kuballa et al. have demonstrated that Atg16L1T300A-expressing cells are defective in the capture of internalized Salmonella within autophagosomes.Citation23 Our study extends this observation to AIEC-LF82 bacteria, an invading E. coli strain involved in the pathogenesis of CD.
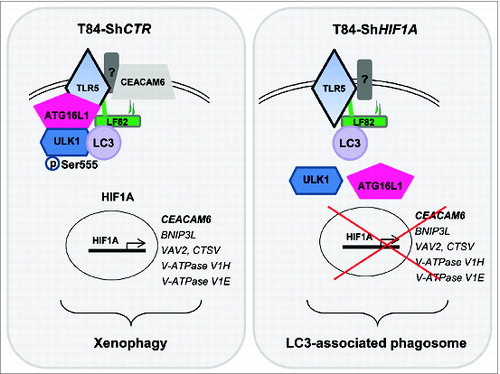
Figure 7. Postulated mechanism by which AIEC-LF82 bacteria induce xenophagy. Binding of LF82 type 1 pili to CEACAM6, a protein whose expression is transcriptionally regulated by HIF1A, enhances the activation of TLR5 by LF82 flagella. Activated receptors participate in the recruitment of ATG16L1 and ULK1 to a signaling hub, where ULK1 is phosphorylated on Ser555. Activated ULK1 initiates the autophagy machinery, which ultimately degrades intracellular LF82 bacteria. On the contrary, in HIF1A-depleted cells, the absence of CEACAM6 likely decreases the ability of TLR5 to be activated by LF82 and further to recruit ATG16L1 and ULK1 to the signaling hub. As a consequence, ULK1 is not phosphorylated, the autophagy process is not induced and bacteria remain within LC3-positive phagosomes.
Interestingly, in addition to the well-known CD susceptibility genes, namely ATG16L1, IRGM and NOD2, a genetic association with a single nucleotide polymorphism in ULK1 has recently been described in CD patients.Citation47 However, whether this mutation is linked to deficiency in autophagy remains to be elucidated. Importantly, expression of ATG16L1, IRGM and ULK are not dependent on HIF1A expression ( and S8), and therefore could not account for the AIEC-induced xenophagy defect observed in T84-ShHIF1A cells.
In conclusion, our study positions HIF1A as a pivotal element governing the complex relationship between host and AIEC. First, we demonstrated that HIF1A promotes gastrointestinal inflammatory disorders.Citation6 By inducing HIF1A expression levels, AIEC used the cellular machinery to control both proinflammatory and proangiogenenic responses, both events are linked to CD pathogenesis. In parallel, we demonstrated here that HIF1A enhances bacterial clearance through xenophagy. This effect, which requires HIF1 transcriptional activity on the CEACAM6 promoter,Citation33 benefits the host by finally overcoming AIEC-induced proinflammatory responses. Therefore, our data bring new insights on the potential development of future therapeutic intervention by combining both activation of autophagy and stabilization of HIF1A to fight IBD.
Materials and Methods
Cell culture
The human colon carcinoma cell line T84 was supplied by ATCC (ATCC, CCL-248). T84-ShCTR and ShHIF1A cells were previously characterized.Citation5,6 The Sylamer analysis shows that ShRNA has no multitargeted genes (data not shown). Cells were cultured at 37°C in controlled atmosphere (5% CO2 and 95% air) with Dulbecco's Modified Eagle's Minimal Essential/F12 (DMEM/F12; Life Technologies, 31331-028) Medium supplemented with 5% heat-inactivated fetal calf serum without antibiotics. Prior to infection, cells were starved overnight in DMEM/F12 containing Insulin-Transferin-Selenium (ITS, 100 μg/ml; Invitrogen, 51300-044) then washed twice with phosphate-buffered saline (DPBS; Life Technologies, 14190-094)) and incubated 30 min in 1 ml of fresh DMEM/F12 + ITS.
Lentiviral infection
T84 cells were transduced in polybrene (8 μg/ml) with lentiviral particles containing shRNA-ATG5 and shRNA-SQSTM1 (Sigma-Aldrich, TRCN0000151963 and TRCN0000007237, respectively) at a multiplicity of infection of 3 according to the manufacturer's protocol. Clones were maintained in puromycin (10 μg/ml; Invitrogen, ant-pr-1), which was removed 2 d before the experiment to get rid of the effect on bacterial infection.
Bacterial strains
The AIEC strain LF82 was isolated from a chronic ileal lesion of a patient with Crohn disease.Citation18 Bacteria were grown overnight at 37°C on LB-agar plates and expanded in LB medium at 37°C without shaking. Prior to experiments, bacteria were diluted 1 to 10 in fresh LB medium and culture 2 h at 37°C. Bacteria in growing exponential phase were then washed twice in PBS, resuspended in fresh PBS and quantified by OD measurement (1.0 OD600 = 2 × 10⁹ CFU/ml).
Survival assay
3 × 10⁵ cells were plated in 12-well plates d 0 in growing medium. At d one, cells were incubated overnight in DMEM/F12. At d 2 prior to the infection, cells were rinsed once in PBS and incubated for 2 h with 1ml of DMEM/F12 medium. Cells were then infected with AIEC LF82 strain at a multiplicity of infection (MOI) of 10. The bacterial survival within epithelial cells was measured as protection against gentamicin, as described in.Citation31 Briefly, for each condition, cells were plated in triplicate in order to calculate the ratio of intracellular bacteria over a 1-h and 4-h period and bacterial replication was expressed as the mean percentage of bacteria recovered at 4 h postinfection relative to the number of bacteria recovered after 1 h of gentamicin treatment, defined as 100%. All infections were performed in duplicate, and each experiment was repeated at least 3 times.
Western blotting
8 × 10⁵ cells were plated in 12-well plates at d 0 in growing medium. At d one, cells were incubated overnight in DMEM/F12 containing ITS. At d 2 prior to the infection, cells were rinsed once in PBS and incubated for 2 h with 1ml of DMEM/F12 ITS medium. Cells were then treated as indicated in the figure legend, washed twice with ice-cold PBS and lysed in SDS sample buffer. Protein extracts were resolved by SDS-PAGE and transferred onto a polyvinylidene difluoride membrane (Immobilon-P; Millipore, IPVH00010). Prior to incubation with antibodies, membranes were blocked for 30 min in 5% nonfat milk diluted in Tris-buffered saline (TBS; 50mM Tris, pH7.4, 100 mM NaCl). Membranes were incubated overnight in the same buffer containing the indicated antibody (see elsewhere), washed in TBS supplemented with 0.1% Triton X-100 3 times. Membranes were then incubated with the secondary anti-rabbit or anti-mouse HRP-conjugated antibody (Santa Cruz Biotechnology, sc-2077 and sc-2005 respectively). Bound antibodies were revealed using an ECL system (Millipore, WB LUC 0500). When signals were quantified we used dye light secondary antibodies (anti-rabbit IRDye-800 or anti-mouse IRDye-680; Cell Signaling Technology, 5151S and 5470S respectively) and signal was acquired using an infrared imaging system (LI-COR ScienceTec, Les Ulis, France) as described by the manufacturer. Each experiment was repeated at least 3 times.
Analysis of autophagy
We used immunoblotting, transmission electron microscopy (TEM), and confocal microscopy to study the consequences of AIEC infection on autophagy in T84 cells. First, we studied the autophagic flux. For that purpose, control or infected cells were incubated with specific lysosomal protease inhibitors (pepstatin A and E64d, 10 μg/mL; Sigma Aldrich, P4265 and E3132, respectively) in the presence or absence of AIEC and the levels of the autophagosome-associated LC3-II protein (Nanotools, 0231-100 clone 5F10; diluted 1/1000, which preferentially recognizes LC3-II) were analyzed by immunoblotting. Then, we used TEM, confocal microscopy, and immunoblotting to study the consequences of AIEC infection on autophagy in T84 cells. The formation of autophagic vesicles was analyzed at the ultra-structural level using a Jeol EXII transmission electron microscope (Croissy sur seine, France). T84 cells were infected for the indicated time and fixed with ice-cold 3% glutaraldehyde in 0.1 M Na cacodylate, pH 7.4 for 2 h. Cells were fixed in 4% buffered formalin (Micron, F/F0047), then processed, oriented on edge, embedded in paraffin (Sakura, 4511), cut into sequential 4-micron sections, and stained by hematoxylin eosin (VWR, 95057-858 and Micron F/T0363 respectively) and Giemsa (VWR, 1.09204.1022) for the microscopic evaluation of AIEC infection. To confirm the activation of autophagy we studied the formation of autolysosomes by indirect immunofluorescence staining and confocal microscopy. In particular, the subcellular distribution of LC3-II (1/500; mouse, clone 5F10, Nanotools, 0231-100), LAMP1 (1/500; goat, Santa Cruz Biotechnology, SC8098) and EEA1 (1/500; rabbit, Abcam, Ab2009) were analyzed.
Nutrient stress-induced autophagy was studied on cells incubated in HBSS (Life technologies, 14025-050) for the indicated times and levels of LC3-II were analyzed by immunoblot experiments. To assess mitophagy, cells were incubated with MitoTracker Red, a specific marker of mitochondria (MitoTracker Red FM, 1:20,000; Life Technologies, M22425) for 20 min and images from lived cells were acquired using EVOS fl microscope (AMG).
LC3-associated phagocytosis was studied by protein gel blot analysis using anti phospho-ULK1 (Ser555) (AMPK site, Cell Signaling Technology, 5869), anti phospho-ULK1 (Ser757) (MTORC1 site, Cell Signaling Technology, 6888), anti ULK1 (Cell Signaling Technology, 8054S), anti ATG16L1 (Cell Signaling Technology, 8089S) and anti ACTB (Sigma-Aldrich, A3853) antibodies.
Immunofluorescence
2 × 10⁴ T84 cells were seeded on glass coverslips and grown to 20% confluency and cells were processed as for western blotting experiments. After the indicated infection time, cells were washed 3 times with PBS, fixed with 3% paraformaldehyde, blocked with PBS containing 3% bovine serum albumin (Sigma Aldrich, A7030), and incubated with specific antibodies as indicated in the analysis of autophagy section. Secondary anti-mouse Alexa-488 and secondary anti-rabbit Alexa-633 conjugated antibodies were used (Invitrogen, A21202 and A21071 respectively. Coverslips were mounted in Prolong Gold antifade reagent (Molecular probes, P36935) with the nuclei-staining dye DAPI (Life Technologies, P36935) and visualized with a Zeiss Axiophot confocal fluorescence microscope (Marly le Roy, France). For quantification, 30 to 50 GFP-LF82 bacteria, on 3 different images, were counted and assayed for their colocalization with LC3-II, LAMP1, EEA1, ATG16L1 and ULK1. Each experiment was repeated at least 2 times.
RNA extraction and relative and absolute real-time quantitative PCR
Confluent cells seeded in 6-well plates were treated as indicated in the figure legend, lysed in TRI Reagent (Sigma Aldrich, T9424) and total RNA was prepared according to the manufacturer's protocol. One microgram of total RNA was reversed transcribed in a 20-μl reaction according to the manufacturer's instruction (high capacity DNA RT kit; Applied, 4368813). Real-time amplification (q-PCR) was performed on a Step One real-time PCR system (Applied Biosystems) using cDNA and specific primers as indicated by the supplier (Applied Biosystems, Power Sybr Green PCR mix, 4385612). For quantification we used the 2[–DDC(T)] method.Citation48 According to this method, the C(T) values for the expression of each transcript in each sample were normalized to the C(T) values of the control mRNA of the same sample. The values of T84-ShCTR cell samples were then set to 1 and the fold increase was calculated.
Pangenomic microarrays
The integrity of total RNAs was evaluated using an Agilent 2100 Bioanalyzer (Agilent Technologies, Santa Clara, CA, USA,). Low Input Quick Amp Labeling Kit, one-color (Agilent Technologies, 5190-2305) was used to prepare Cy3-labeled target cRNA according to the manufacturer's instructions. Labeled cRNAs were hybridized with a SurePrint G3 Human GE 8 × 60K Microarrays (Agilent Technologies). Two biological replicate hybridizations were performed. Array images were captured using a DNA Microarray Scanner (Agilent Technologies, Massy, France), and data were analyzed using Feature Extraction Software (Agilent Technologies) to obtain background-corrected signal intensities. The statistical analysis of the microarray data has been performed in R [1], using the limma [2] package. We applied a between-array normalization using the quantile method. Differentially expressed genes between conditions were selected based on the moderated t statistic and a Benjamini-Hochberg correction of the P value for multipe tests supplied by the limma [2] package.
Statistical analysis
Statistical analysis was performed using the Student unpaired t test. P values less than 0.05 were considered statistically significant.
Disclosure of Potential Conflicts of Interest
No potential conflicts of interest were disclosed.
Supplementary Material
Supplemental data for this article can be accessed on the publisher's website.
Supplemental_Figures_and_Text.zip
Download Zip (327.4 KB)Acknowledgments
The authors would like to thank Sophie Pagnotta (CMA, UFR Sciences) and Mireille Mari (LPCE, Nice) for their expertise in transmission electron microscopy. Franck Lafont, Mireille Cormont, Arnaud Jacquel, and Sandrine Lacas-Gervais are acknowledged for helpful discussions, and Maude Le Gall and Dana Goldoni for critical reading of the manuscript. We acknowledge the IRCAN's PICMI core facilities.
Funding
This work was supported by grants from Institut National de la Santé et de la Recherche Médicale, the Association pour la Recherche contre le Cancer (ARC Grants no SL220110603478) the Cancéropole PACA, the Centre National de la Recherche Scientifique, and the French Government (National Research Agency), through the Investments for the Future LABEX SIGNALIFE: program reference #ANR-11-LABX-0028-01. SM was a fellow of Infectiopole Sud foundation.
References
- Maxwell PH, Wiesener MS, Chang GW, Clifford SC, Vaux EC, Cockman ME, Wykoff CC, Pugh CW, Maher ER, Ratcliffe PJ. The tumour suppressor protein VHL targets hypoxia-inducible factors for oxygen-dependent proteolysis. Nature 1999; 399:271-5; PMID:10353251; http://dx.doi.org/10.1038/20459
- Semenza GL. Oxygen sensing, homeostasis, and disease. N Engl J Med 2011; 365:537-47; PMID:21830968; http://dx.doi.org/10.1056/NEJMra1011165
- Richard DE, Berra E, Pouyssegur J. Nonhypoxic pathway mediates the induction of hypoxia-inducible factor 1alpha in vascular smooth muscle cells. J Biol Chem 2000; 275:26765-71; PMID:10837481
- Frede S, Berchner-Pfannschmidt U, Fandrey J. Regulation of hypoxia-inducible factors during inflammation. Methods Enzymol 2007; 435:405-19; PMID:17998066
- Cane G, Ginouves A, Marchetti S, Busca R, Pouyssegur J, Berra E, Hofman P, Vouret-Craviari V. HIF-1alpha mediates the induction of IL-8 and VEGF expression on infection with Afa/Dr diffusely adhering E. coli and promotes EMT-like behaviour. Cell Microbiol 2010; 12:640-53; PMID:20039880; http://dx.doi.org/10.1111/j.1462-5822.2009.01422.x
- Mimouna S, Goncalves D, Barnich N, Darfeuille-Michaud A, Hofman P, Vouret-Craviari V. Crohn disease-associated Escherichia coli promote gastrointestinal inflammatory disorders by activation of HIF-dependent responses. Gut Microbes 2011; 2:335-46; PMID: 22157238; http://www.ncbi.nlm.nih.gov.gate2.inist.fr/pubmed/22157238
- Mizushima N, Levine B, Cuervo AM, Klionsky DJ. Autophagy fights disease through cellular self-digestion. Nature 2008; 451:1069-75; PMID:18305538; http://dx.doi.org/10.1038/nature06639
- Levine B, Deretic V. Unveiling the roles of autophagy in innate and adaptive immunity. Nat Rev Immunol 2007; 7:767-77; PMID:17767194; http://dx.doi.org/10.1038/nri2161
- Klionsky DJ, Abdalla FC, Abeliovich H, Abraham RT, Acevedo-Arozena A, Adeli K, Agholme L, Agnello M, Agostinis P, Aguirre-Ghiso JA, et al. Guidelines for the use and interpretation of assays for monitoring autophagy. Autophagy 2012; 8:445-544; PMID:22966490; http://dx.doi.org/10.4161/auto.19496
- Bellot G, Garcia-Medina R, Gounon P, Chiche J, Roux D, Pouyssegur J, Mazure NM. Hypoxia-induced autophagy is mediated through hypoxia-inducible factor induction of BNIP3 and BNIP3L via their BH3 domains. Mol Cell Biol 2009; 29:2570-81; PMID:19273585; http://dx.doi.org/10.1128/MCB.00166-09
- Levine B. Eating oneself and uninvited guests: autophagy-related pathways in cellular defense. Cell 2005; 120:159-62; PMID:15680321
- Pujol C, Klein KA, Romanov GA, Palmer LE, Cirota C, Zhao Z, et al. Yersinia pestis can reside in autophagosomes and avoid xenophagy in murine macrophages by preventing vacuole acidification. Infect Immun 2009; 77:2251-61; PMID:19289509; http://dx.doi.org/10.1128/IAI.00068-09
- Chargui A, Cesaro A, Mimouna S, Fareh M, Brest P, Naquet P, et al. Subversion of autophagy in adherent invasive escherichia coli-infected neutrophils induces inflammation and cell death. PLoS One 2012; 7:e51727; PMID:23272151
- Lapaquette P, Bringer MA, Darfeuille-Michaud A. Defects in autophagy favour adherent-invasive Escherichia coli persistence within macrophages leading to increased pro-inflammatory response. Cell Microbiol 2012; 14:791-807; PMID:22309232
- Brest P, Lapaquette P, Souidi M, Lebrigand K, Cesaro A, Vouret-Craviari V, Mari B, Barbry P, Mosnier JF, Hébuterne X, et al. A synonymous variant in IRGM alters a binding site for miR-196 and causes deregulation of IRGM-dependent xenophagy in Crohn's disease. Nat Genet 2011; 43:242-5; PMID:21278745; http://dx.doi.org/10.1038/ng.762
- Lapaquette P, Glasser AL, Huett A, Xavier RJ, Darfeuille-Michaud A. Crohn's disease-associated adherent-invasive E. coli are selectively favoured by impaired autophagy to replicate intracellularly. Cell Microbiol 2010; 12:99-113; PMID:19747213; http://dx.doi.org/10.1111/j.1462-5822.2009.01381.x
- Baumgart M, Dogan B, Rishniw M, Weitzman G, Bosworth B, Yantiss R, Orsi RH, Wiedmann M, McDonough P, Kim SG, et al. Culture independent analysis of ileal mucosa reveals a selective increase in invasive Escherichia coli of novel phylogeny relative to depletion of Clostridiales in Crohn's disease involving the ileum. ISME J 2007; 1:403-18; PMID:18043660; http://dx.doi.org/10.1038/ismej.2007.52
- Darfeuille-Michaud A, Neut C, Barnich N, Lederman E, Di Martino P, Desreumaux P, Gambiez L, Joly B, Cortot A, Colombel JF. Presence of adherent Escherichia coli strains in ileal mucosa of patients with Crohn's disease. Gastroenterology 1998; 115:1405-13; PMID:9834268; http://dx.doi.org/10.1016/S0016-5085(98)70019-8
- Barnich N, Boudeau J, Claret L, Darfeuille-Michaud A. Regulatory and functional co-operation of flagella and type 1 pili in adhesive and invasive abilities of AIEC strain LF82 isolated from a patient with Crohn's disease. Mol Microbiol 2003; 48:781-94; PMID:12694621; http://dx.doi.org/10.1046/j.1365-2958.2003.03468.x
- Barnich N, Carvalho FA, Glasser AL, Darcha C, Jantscheff P, Allez M, Peeters H, Bommelaer G, Desreumaux P, Colombel JF, et al. CEACAM6 acts as a receptor for adherent-invasive E. coli, supporting ileal mucosa colonization in Crohn disease. J Clin Invest 2007; 117:1566-74; PMID:17525800; http://dx.doi.org/10.1172/JCI30504
- Rolhion N, Carvalho FA, Darfeuille-Michaud A. OmpC and the sigma(E) regulatory pathway are involved in adhesion and invasion of the Crohn's disease-associated Escherichia coli strain LF82. Mol Microbiol 2007; 63:1684-700; PMID:17367388; http://dx.doi.org/10.1111/j.1365-2958.2007.05638.x
- Brest P, Corcelle EA, Cesaro A, Chargui A, Belaid A, Klionsky DJ, Vouret-Craviari V, Hebuterne X, Hofman P, Mograbi B. Autophagy and Crohn's disease: at the crossroads of infection, inflammation, immunity, and cancer. Curr Mol Med 2010; 10:486-502; PMID:20540703; http://dx.doi.org/10.2174/156652410791608252
- Kuballa P, Huett A, Rioux JD, Daly MJ, Xavier RJ. Impaired autophagy of an intracellular pathogen induced by a Crohn's disease associated ATG16L1 variant. PLoS One 2008; 3:e3391; PMID:18852889; http://dx.doi.org/10.1371/journal.pone.0003391
- Mazure NM, Brahimi-Horn MC, Pouyssegur J. Hypoxic mitochondria: accomplices in resistance. Bull Cancer 2011; 98:40-6; PMID:21609892
- Zhang H, Bosch-Marce M, Shimoda LA, Tan YS, Baek JH, Wesley JB, Gonzalez FJ, Semenza GL. Mitochondrial autophagy is an HIF-1-dependent adaptive metabolic response to hypoxia. J Biol Chem 2008; 283:10892-903; PMID:18281291; http://dx.doi.org/10.1074/jbc.M800102200
- Russell RC, Tian Y, Yuan H, Park HW, Chang YY, Kim J, Kim H, Neufeld TP, Dillin A, Guan KL. ULK1 induces autophagy by phosphorylating Beclin-1 and activating VPS34 lipid kinase. Nat Cell Biol 2013; 15:741-50; PMID:23685627; http://dx.doi.org/10.1038/ncb2757
- Egan D, Kim J, Shaw RJ, Guan KL. The autophagy initiating kinase ULK1 is regulated via opposing phosphorylation by AMPK and mTOR. Autophagy 2011; 7:643-4; PMID:21460621; http://dx.doi.org/10.4161/auto.7.6.15123
- Egan DF, Shackelford DB, Mihaylova MM, Gelino S, Kohnz RA, Mair W, Vasquez DS, Joshi A, Gwinn DM, Taylor R, et al. Phosphorylation of ULK1 (hATG1) by AMP-activated protein kinase connects energy sensing to mitophagy. Science 2011; 331:456-61; PMID:21205641; http://dx.doi.org/10.1126/science.1196371
- Kim J, Kundu M, Viollet B, Guan KL. AMPK and mTOR regulate autophagy through direct phosphorylation of Ulk1. Nat Cell Biol 2011; 13:132-41; PMID:21258367; http://dx.doi.org/10.1038/ncb2152
- Into T, Inomata M, Takayama E, Takigawa T. Autophagy in regulation of Toll-like receptor signaling. Cell Signal 2012; 24:1150-62; PMID:22333395; http://dx.doi.org/10.1016/j.cellsig.2012.01.020
- Boudeau J, Barnich N, Darfeuille-Michaud A. Type 1 pili-mediated adherence of Escherichia coli strain LF82 isolated from Crohn's disease is involved in bacterial invasion of intestinal epithelial cells. Mol Microbiol 2001; 39:1272-84; PMID:11251843; http://dx.doi.org/10.1111/j.1365-2958.2001.02315.x
- Miao EA, Andersen-Nissen E, Warren SE, Aderem A. TLR5 and Ipaf: dual sensors of bacterial flagellin in the innate immune system. Semin Immunopathol 2007; 29:275-88; PMID:17690885; http://dx.doi.org/10.1007/s00281-007-0078-z
- Denizot J, Desrichard A, Agus A, Uhrhammer N, Dreux N, Vouret-Craviari V, Hofman P, Darfeuille-Michaud A, Barnich N. Diet-induced Hypoxia responsive element demethylation increases CEACAM6 expression, favoring Crohn's disease associated E. coli colonization. Gut 2014; 0:1-10; PMID:24898815; http://www.ncbi.nlm.nih.gov.gate2.inist.fr/pubmed/24898815
- Joossens M, Huys G, Cnockaert M, De Preter V, Verbeke K, Rutgeerts P, Vandamme P, Vermeire S. Dysbiosis of the faecal microbiota in patients with Crohn's disease and their unaffected relatives. Gut 2011; 60:631-7; PMID:21209126; http://dx.doi.org/10.1136/gut.2010.223263
- Huang J, Brumell JH. Bacteria-autophagy interplay: a battle for survival. Nat Rev Microbiol 2014; 12:101-14; PMID:24384599; http://dx.doi.org/10.1038/nrmicro3160
- Ambrose NS, Johnson M, Burdon DW, Keighley MR. Incidence of pathogenic bacteria from mesenteric lymph nodes and ileal serosa during Crohn's disease surgery. Br J Surg 1984; 71:623-5; PMID:6743986; http://dx.doi.org/10.1002/bjs.1800710821
- Cartun RW, Van Kruiningen HJ, Pedersen CA, Berman MM. An immunocytochemical search for infectious agents in Crohn's disease. Mod Pathol 1993; 6:212-9; PMID:8483893
- Liu Y, van Kruiningen HJ, West AB, Cartun RW, Cortot A, Colombel JF. Immunocytochemical evidence of Listeria, Escherichia coli, and Streptococcus antigens in Crohn's disease. Gastroenterology 1995; 108:1396-404; PMID:7729631; http://dx.doi.org/10.1016/0016-5085(95)90687-8
- Chassaing B, Rolhion N, de Vallee A, Salim SY, Prorok-Hamon M, Neut C, Campbell BJ, Söderholm JD, Hugot JP, Colombel JF, et al. Crohn disease–associated adherent-invasive E. coli bacteria target mouse and human Peyer's patches via long polar fimbriae. J Clin Invest 2011; 121:966-75; PMID:21339647; http://dx.doi.org/10.1172/JCI44632
- Bringer MA, Glasser AL, Tung CH, Meresse S, Darfeuille-Michaud A. The Crohn's disease-associated adherent-invasive Escherichia coli strain LF82 replicates in mature phagolysosomes within J774 macrophages. Cell Microbiol 2006; 8:471-84; PMID:16469058; http://dx.doi.org/10.1111/j.1462-5822.2005.00639.x
- Sanjuan MA, Dillon CP, Tait SW, Moshiach S, Dorsey F, Connell S, Komatsu M, Tanaka K, Cleveland JL, Withoff S, et al. Toll-like receptor signalling in macrophages links the autophagy pathway to phagocytosis. Nature 2007; 450:1253-7; PMID:18097414; http://dx.doi.org/10.1038/nature06421
- Bustelo XR. Regulatory and signaling properties of the Vav family. Mol Cell Biol 2000; 20:1461-77; PMID:10669724; http://dx.doi.org/10.1128/MCB.20.5.1461-1477.2000
- Fonovic M, Turk B. Cysteine cathepsins and their potential in clinical therapy and biomarker discovery. Proteomics Clin Appl 2014; PMID:24470315
- Mindell JA. Lysosomal acidification mechanisms. Annu Rev Physiol 2012; 74:69-86; PMID:22335796; http://dx.doi.org/10.1146/annurev-physiol-012110-142317
- Hara T, Takamura A, Kishi C, Iemura S, Natsume T, Guan JL, Mizushima N. FIP200, a ULK-interacting protein, is required for autophagosome formation in mammalian cells. J Cell Biol 2008; 181:497-510; PMID:18443221; http://dx.doi.org/10.1083/jcb.200712064
- Saitoh T, Fujita N, Jang MH, Uematsu S, Yang BG, Satoh T, Omori H, Noda T, Yamamoto N, Komatsu M, et al. Loss of the autophagy protein Atg16L1 enhances endotoxin-induced IL-1beta production. Nature 2008; 456:264-8; PMID:18849965; http://dx.doi.org/10.1038/nature07383
- Henckaerts L, Cleynen I, Brinar M, John JM, Van Steen K, Rutgeerts P, Vermeire S. Genetic variation in the autophagy gene ULK1 and risk of Crohn's disease. Inflamm Bowel Dis 2011; 17:1392-7; PMID:21560199; http://dx.doi.org/10.1002/ibd.21486
- Livak KJ, Schmittgen TD. Analysis of relative gene expression data using real-time quantitative PCR and the 2(-Delta Delta C(T)) Method. Methods 2001; 25:402-8; http://dx.doi.org/10.1006/meth.2001.1262