
Abstract
The 18-kDa TSPO (translocator protein) localizes on the outer mitochondrial membrane (OMM) and participates in cholesterol transport. Here, we report that TSPO inhibits mitochondrial autophagy downstream of the PINK1-PARK2 pathway, preventing essential ubiquitination of proteins. TSPO abolishes mitochondrial relocation of SQSTM1/p62 (sequestosome 1), and consequently that of the autophagic marker LC3 (microtubule-associated protein 1 light chain 3), thus leading to an accumulation of dysfunctional mitochondria, altering the appearance of the network. Independent of cholesterol regulation, the modulation of mitophagy by TSPO is instead dependent on VDAC1 (voltage-dependent anion channel 1), to which TSPO binds, reducing mitochondrial coupling and promoting an overproduction of reactive oxygen species (ROS) that counteracts PARK2-mediated ubiquitination of proteins. These data identify TSPO as a novel element in the regulation of mitochondrial quality control by autophagy, and demonstrate the importance for cell homeostasis of its expression ratio with VDAC1.
Abbreviations:
- Δψm, mitochondrial membrane potential
- ATP5B, ATP synthase, H+ transporting, mitochondrial F1 complex, β subunit
- DAPI, 4’, 6-diamidino-2-phenylindole
- DHE, dihydroethidium
- DNM1L, dynamin 1-like
- FCCP, carbonyl cyanide-4-(trifluoromethoxy)phenylhydrazone
- GAPDH, glyceraldehyde-3-phosphate dehydrogenase
- GSH, glutathione
- MAP1LC3/LC3, microtubule-associated protein 1 light chain 3
- MCB, monochlorobimane
- MEFs, mouse embryonic fibroblasts
- MβCD, methyl-β-cyclodextrin
- MnTBAP, manganese [III] tetrakis (4-benzoic acid) porphyrin
- mtRFP, mitochondrially targeted red fluorescent protein
- nsc, nonsilencing control
- NRF1, nuclear respiratory factor 1
- OMM, outer mitochondrial membrane
- PBS, phosphate-buffered saline
- PINK1, PTEN-induced putative kinase 1
- PRKCE, protein kinase C, epsilon
- RM, recording medium
- ROS, reactive oxygen species
- RT, room temperature
- siRNA, small interfering ribonucleic acid
- SQSTM1, sequestosome 1
- TFAM, transcription factor A, mitochondrial
- TMRM, tetramethylrhodamine methyl ester
- TSPO, translocator protein
- VDAC1, voltage-dependent anion channel 1
- YFP, yellow fluorescent protein
Introduction
Discovered in 1977, TSPO (translocator protein) was first characterized as a high affinity benzodiazepine binding site in peripheral tissues.Citation1 It was initially named the peripheral benzodiazepine receptor (PBR) although it is anatomically and pharmacologically different from the central benzodiazepine receptor (CBR).Citation2 TSPO is evolutionarily conserved and ubiquitously expressed throughout the body, with elevated expression in steroidogenic endocrine tissues.Citation3-5 This reflects the prominent role it plays in facilitating the transport of the steroid hormone precursor cholesterol to the inner mitochondrial membrane.Citation6-8 Its ubiquitous expression suggests pleiotropic functionality, and indeed many additional roles have been assigned to TSPO. It is a suggested component of the mitochondrial permeability transition pore (mPTP)Citation9 although supporting evidence for this is still missing.Citation10 A role for TSPO in the execution of apoptosis has long been proposed and its natural and synthetic ligands i) endozepine,Citation11,12 ii) PK11195Citation13-16 and iii) Ro-54864Citation17 are widely exploited as chemotherapy co-adjuvants. Other functions linked to TSPO include: i) the regulation of mitochondrial ATP production,Citation18,19 ii) the generation of reactive oxygen species,Citation20,21 and iii) the modulation of Ca2+ signaling.Citation22,23 Notably, its precise role in cell physiology has received relatively little attention, leaving its contribution to mitochondrial function largely ill-defined. On the contrary, robust evidence exists for describing a role for TSPO in cell pathology: i) TSPO is detected at greater levels in a number of cancersCitation24-26 in which its expression correlates with disease progression and malignant behavior.Citation27 ii) TSPO expression is augmented in activated microglia and serves as an in vivo imaging biomarker of acute and chronic neuroinflammation.Citation28,2929 iii) Interestingly, TSPO expression is also increased in Parkinson disease patients,Citation30,31 in which defective mitochondrial autophagy is acknowledged as the underlying feature, thus suggesting a potential involvement of TSPO in mitochondrial quality control.
The current mechanistic model of mitophagy requires full-length PINK1 (PTEN-induced kinase 1) to selectively accumulate on the outer membranes of depolarized mitochondria, where it initiates the recruitment of the cytosolic E3 ubiquitin ligase, PARK2.Citation32-35 PARK2 ubiquitinates outer mitochondrial membrane proteins and recruits SQSTM1.Citation36,37 Within this model, the role of proteins constitutively present in the OMM is unclear and the involvement of the most abundant component, VDAC1, still controversial.Citation38 It has been suggested that VDAC1 interacts with PARK2 and is involved in its recruitment and function during mitochondrial autophagy;Citation38,39 however, opposing evidence exists which indicates VDAC1 is dispensable in the process.Citation36 By being in close proximity with VDAC1 or interacting with this as proposed previously,Citation40-42 TSPO may be an added element in the platform of molecules on which the efficiency of PARK2-mediated mitophagy relies. We initially tested this pharmacologically by employing a synthetic ligand, PK 11195, which proved, however, to be nonspecific and involved pathways unrelated to TSPO.Citation43,44 We therefore exploited TSPO molecularly by manipulating its expression to test its effect on the PINK1-PARK2 axis.Citation45 This work shows that TSPO expression when increased compared to that of VDAC1 limits the efficiency of mitochondrial autophagy by increasing the accumulation of ROS, which leads to a decreased efficiency of ubiquitin-dependent mitochondrial protein degradation.
Results
We initially carried out an immunofluorescence analysis in various mammalian cell lines to confirm the subcellular colocalization of TSPO and VDAC1 in mouse embryonic fibroblasts (MEFs) () and canine mammary gland epithelia (CF35) (Fig. S1A). In both MEFs and CF35, TSPO exhibited a mitochondrial pattern, visualized by discrete colocalization with VDAC1 consistent with previous studies.Citation41,46
Figure 1. TSPO regulates the autophagy response in FCCP-treated cells. (A) Confocal immunofluorescence microscopy shows that TSPO (green) colocalizes with VDAC1 (red) on mitochondria in MEFs. DAPI (blue) is representative of cell nuclei. (B) Western blot to demonstrate modulation of TSPO (18 kDa) in MEF cells relative to VDAC1 (32 kDa). (C) Graph shows band density analysis (n = 3; P < 0.001). (D) Real time quantitative RT-PCR analysis for estimation of Tspo mRNA levels in CF35. (E) Western blot analysis of MEFs treated with bafilomycin A1 (BAF, 100 nM), to inhibit autophagic flux, for 4 h in the presence and absence of FCCP (20 μM). (F) Graph shows LC3-II:GAPDH ratio band density analysis (n = 3; P < 0.01).
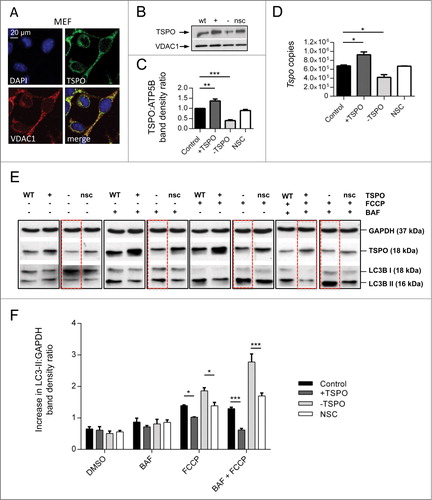
Consequently, we sought to alter the ratio of TSPO:VDAC1 expression by transiently knocking down TSPO with siRNA (-TSPO) or overexpressing with cDNA (+TSPO). Cells transfected with an empty vector (C) or a nonsilencing siRNA (NSC) were used as controls. Changes in TSPO expression were confirmed via immunoblotting analysis () and achieved in both MEFs (relative to control +TSPO: 1.24± 0.01 -TSPO: 0.33 ± 0.01 NSC 0.96 ± 0.03; ) and CF35 (relative to control +TSPO: 1.37 ± 0.10 -TSPO 0.40 ± 0.04 NSC 0.90 ± 0.04; Fig. S1B, C). Modulation of TSPO was further confirmed by real-time qRT-PCR studies in CF35 (control: 677842 ± 18286, +TSPO: 926736 ± 62430, -TSPO: 422042 ± 60823, NSC: 670350 ± 4350; ).
In MEFs we then assayed the level of LC3B-II activation, a lipidated form of LC3B that, localizing on phagophores and autophagosomes, indicates the degree of autophagic activation.47 During unstimulated conditions, TSPO modulation did not demonstrate profound differences in the level of LC3B-II when compared to control (representative blot depicted in with quantification reported in F; control: 0.65 ± 0.07 +TSPO: 0.61 ± 0.11 -TSPO 0.54 ± 0.08 NSC: 0.56 ± 0.05). After application of the mitochondrial protonophore FCCP (20 μM), which is commonly used to depolarize mitochondriaCitation35,48 and induce the autophagic sequestration of nonrespiring organelles, the density ratio of LC3B-II became significantly greater in -TSPO cells and markedly less in +TSPO cells as shown in (control: 1.39 ± 0.02 +TSPO: 1.02 ± 0.0009 -TSPO: 1.86 ± 0.10 NSC: 1.39 ± 0.011). This was due to the actual production of autophagosomes and not to autophagic flux, as the result remained unchanged in the presence of bafilomycin A149 () (bafilomycin A1, control: 0.87 ± 0.12, +TSPO: 0.72 ± 0.04, -TSPO: 0.81 ± 0.15, NSC: 0.86 ± 0.08; FCCP+bafilomycin A1, control: 1.30 ± 0.04, +TSPO: 0.62 ± 0.04, -TSPO: 2.78 ± 0.26, NSC: 1.70 ± 0.10; ). High-resolution confocal images of TSPO-modulated CF35 cells cotransfected with GFP-LC3 and the mitochondria-targeted red fluorescent protein (mtRFP) () allowed us to calculate the degree of colocalization between LC3 puncta and mitochondria (). At basal levels, a trend emerged in which -TSPO cells (0.23 ± 0.05) displayed a greater degree of colocalization than in control (0.17 ± 0.04) and in +TSPO cells (0.09 ± 0.02), and this was exaggerated in the presence of FCCP. The formation of mitochondria-containing autophagosomes in cells treated with FCCP was significantly higher in -TSPO cells (0.48 ± 0.05), relative to controls (0.35 ± 0.02) and reduced in +TSPO cells (0.19 ± 0.05). The same results were obtained in MEFs (control, basal: 0.19 ± 0.021, FCCP: 0.45 ± 0.060; +TSPO, basal: 0.17 ± 0.014, FCCP: 0.25 ± 0.023; -TSPO, basal: 0.24 ± 0.032, +FCCP: 0.62 ± 0.060; Fig. S1D and E). We also corroborated this by performing immunoblotting analysis of ATP5B levels50 (Fig. S1F) which are reduced in MEFs downregulated for TSPO and to a greater extent went treated with FCCP (Fig. S1G) (basal, control: 1.00 ± 0.01, +TSPO: 1.25 ± 0.04, -TSPO: 0.59 ± 0.01; FCCP, control: 0.69 ± 0.05; +TSPO: 0.80 ± 0.03, -TSPO: 0.25 ± 0.01). We also inspected whether TSPO expression influenced macroautophagy and therefore challenged control (mock-transfected), +TSPO and -TSPO MEFs with rapamycin,51 and monitored the degree of LC3 activation without and with cotreatment with bafilomycin A151 Notably, the expression level of TSPO did not affect macroautophagy induction nor the maturation of autophagosomes,51 arguing for an effect on the mitochondrial type of autophagy (mitophagy) rather than on the general, non-targeted type (Fig. S2A).
Figure 2. TSPO limits mitochondrial autophagy and SQSTM1 recruitment. (A) Representative images of TSPO-modulated CF35 cells before and after treatment with FCCP (20 μM) for 30 min. Scale bar = 50 μm. A magnification of the merged images is shown in areas demarcated by the white box. Scale bar = 5 μm. (B) Quantification of the degree of mtRFP:GFP-LC3 colocaliztion in CF35 cells (n > 10 cells; P < 0.01). (C) MEFs transfected with mtRFP (red) and treated with FCCP (20 μM) were immunolabeled against SQSTM1 (grayscale). Nuclei were stained with DAPI. White arrows show areas in both control and -TSPO cells where mitochondria have formed aggregates that colocalize with SQSTM1. (D) Quantification of SQSTM1 localization on mitochondria (n > 20 cells; P < 0.01). (E) Evaluation of the mitochondrial aggregation coefficient (determined by the ratio between the mtRFP signal intensity and the total mitochondrial area) (n > 20 cells; P < 0.001).
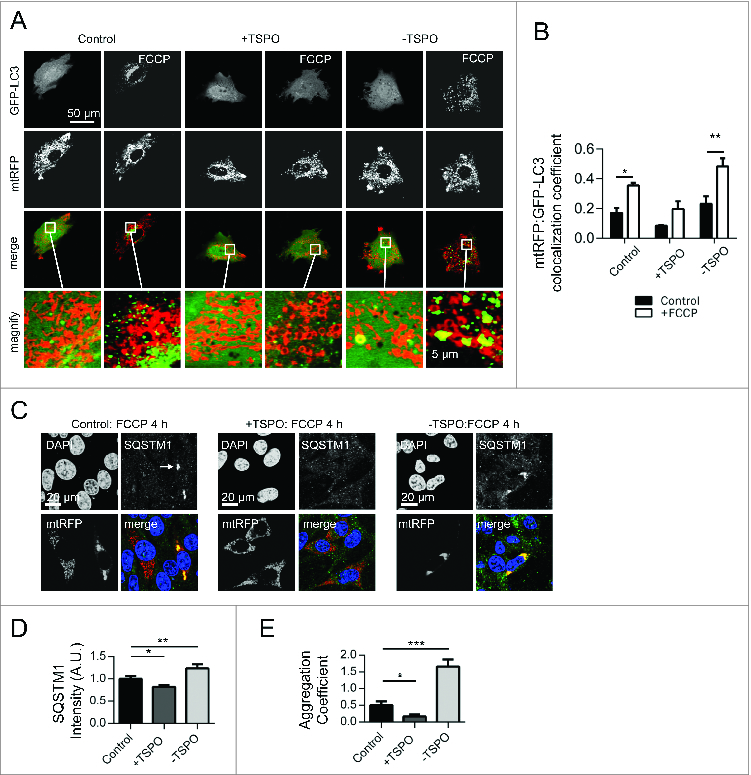
Consequently, we checked the mitochondrial recruitment of SQSTM1 that, binding directly to LC3, facilitates the degradation of ubiquitinated protein aggregates by autophagy.52 MEFs, transfected with mtRFP, were treated for 4 h with FCCP, immunolabelled for SQSTM1 and assayed for the degree of colocalization (). What emerged from this analysis was that mitochondrial recruitment of SQSTM1 was reduced in +TSPO cells (0.82 ± 0.04), contrary to control (1.00 ± 0.05) and -TSPO cells (1.24 ± 0.08) (). This, quite notably, was accompanied by differences in the aggregation of mitochondria, as determined by the analysis of mtRFP distribution over the cellular surface. In +TSPO cells, the aggregation coefficient was only 0.16 ± 0.06 compared to values of 0.50 ± 0.11 and 1.58 ± 0.20 for control and -TSPO cells, respectively ().
Having demonstrated the differences in SQSTM1 relocation to mitochondria according to TSPO expression we next explored the translocation of the E3 ubiquitin ligase PARK2, which is pivotal for the recruitment of SQSTM1 by polyubiquitinating OMM proteins.Citation53 The translocation of PARK2 was assessed by transfecting cells modulated for the TSPO-VDAC1 ratio with PARK2-YFP and by immunostaining for ATP5B to distinguish mitochondria with and without translocated PARK2 (). At basal conditions, PARK2-YFP was uniformly distributed throughout all conditions and induction of mitophagy with FCCP triggered a redistribution of PARK2-YFP, which was not altered by the modulation of TSPO expression (; control: 0.69 ± 0.04, +TSPO: 0.65 ± 0.04, -TSPO: 0.56 ± 0.05, NSC: 0.54 ± 0.07). This was confirmed further by scrutinizing the levels of the endogenous PARK2 via western blot analysis (Fig. S2B).
Figure 3. TSPO leaves unaltered the PINK1-PARK2 signaling pathway. (A) Confocal microscopy depicts MEFs transfected with PARK2-YFP (green) and immunolabeled against ATP5B of the mitochondrial ATPase (red). DAPI was used to stain nuclei (blue). Scale bars = 20 μm. White lines show areas selected for fluorescence intensity profiles. (B) Quantification of PARK2 translocation on mitochondria in cells treated with FCCP (n > 20 cells). (C) Representative traces of the effects of FCCP on ΔΨm in TSPO-modulated MEFs. (D) Western blot analysis of the accumulation of PINK1 long isoform (66 kDa) after FCCP treatment in TSPO-modulated MEFs with relative quantification in (E) (n = 3).
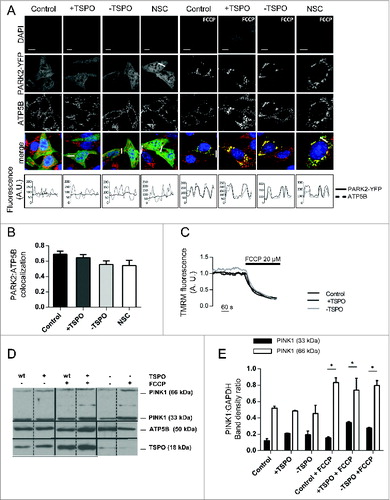
These findings indicated that, regardless of TSPO expression, PARK2 translocates to mitochondriaCitation36 while SQSTM1 signaling is modified. To better assess the behavior of mitochondria under distinct TSPO expression conditions, we checked whether mitochondrial depolarization was impaired and therefore monitored the rate of the mitochondrial membrane potential (ΔΨm) dissipation with TMRM following FCCP (1 μM) addition, which was unmodified in its rate despite the TSPO expression ratio (). In parallel, we monitored the accumulation of PINK1 in mitochondria () and observed no differences, thus indicating a downstream mechanism through which TSPO can influence the removal of depolarized mitochondria flagged by PINK1Citation32,33 (; DMSO PINK1 33 kDa, control: 0.12 ± 0.03 +TSPO: 0.21 ± 0.003 -TSPO: 0.19 ± 0.05; FCCP PINK1 33 kDa, control: 0.16 ± 0.01 +TSPO: 0.34 ± 0.01 -TSPO: 0.28 ± 0.01; DMSO PINK1 66 kDa, control: 0.52 ± 0.02 +TSPO: 0.49 ± 0.008 -TSPO: 0.45 ± 0.10; FCCP PINK1 66 kDa, control: 0.83 ± 0.06 +TSPO: 0.74 ± 0.15 -TSPO: 0.80 ± 0.06).
Once associated with mitochondria, PARK2 promotes ubiquitination of OMM proteins, which is a fundamental step for organelle clearance by autophagy. We explored this by cotransfecting cells with mtRFP and, after exposure to 20 μM FCCP, immunostaining these with anti-ubiquitin antibody (Fig. S2C). The results indicate that none of the +TSPO cells were classed as having mitochondrial ubiquitination; conversely, substantially more ubiquitination was detected in -TSPO cells (53.45 ± 3.69), relative to control (25.37 ± 3.20) (Fig. S2D). This was confirmed via protein gel blot analysis of isolated cross-linked mitochondrial proteins immunolabeled for ubiquitin in which FCCP triggered an increase in polyubiquitination in nonsilencing control (nsc) conditions, that was significantly elevated in -TSPO cells, particularly at heavier band densities (). In +TSPO samples, ubiquitination was notably reduced after treatment with FCCP () when compared to controls (WT). Band density analysis of polyubiquitin (), post FCCP treatment, revealed a decrease in the ratio of ubiquitin to the loading control (ATP5B) in +TSPO (0.30 ± 0.0001) and increased in -TSPO cells (0.87 ± 0.017), relative to the 2 controls (C: 0.71 ± 0.018, NSC 0.64 ± 0.097). To rule out that this observed de-ubiquitination is a consequence of alternative protein degradation pathways we tested the expression levels of MFN1 (mitofusin 1) and MFN2 (mitofusin 2). These prototypical components of the mitochondrial outer membrane are targeted for degradation in a proteasome- and PSMD2 (proteasome [prosome, macropain] 26S subunit, non-ATPase, 2)-dependent manner, which are required for PARK2-mediated mitophagy.Citation37,54 We found that the expression patterns of both MFN1 and MFN2 were not affected by TSPO expression (Fig. S3B) showing that PMSD2 and proteasome activity remains intact.
Figure 4. Mitochondrial protein ubiquitination is affected by TSPO. (A) Immunoblot of mitochondria isolated from MEFs and transfected with Tspo siRNA (-) or a nonsilencing control (nsc) to show changes in polyubiquitination before and after FCCP treatment (4 h). (B) As in (A) but with MEFs transfected with Tspo cDNA (+) or an empty vector (WT). (C) Band density analysis showing the relative increase in mitochondrial polyubiquitin following FCCP treatment (n = 3; P < 0.01). (D) Western blot to demonstrate reduced expression of TSPO in PRKCE−/− MEF cells relative to GAPDH. (E) Graph shows mean TSPO band density analysis relative to GAPDH loading control (n = 3; P < 0.001). (F) Western blot highlighting mitochondrial ubiquitination in WT and PRKCE−/− MEF cells before and after treatment with 20 μM FCCP. (G) The graph shows total ubiquitin band density analysis relative to ATP5B loading control (n = 3; P < 0.05).
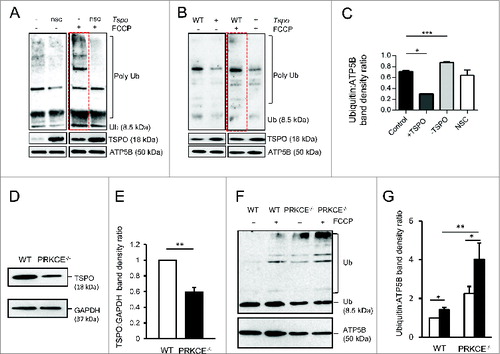
We also recapitulated the deficiency in ubiquitination in PRKCE (protein kinase C, epsilon) knockout MEFs. Tspo gene expression is driven by this kinase,Citation55 leading to a reduction in endogenous TSPO expression. Immunoblotting analysis of lysates from PRKCE−/− cells indeed indicated a reduction (0.59 ± 0.06) in TSPO compared to WT control cells (). This associates with significantly more ubiquitinated mitochondrial fractions (2.24 ± 0.37) when compared to WT control cells (1.00 ± 0.00) at resting conditions. Equally, in FCCP-treated conditions considerably more mitochondrial ubiquitination was observed in PRKCE−/− cells (4.01 ± 083) compared to WT (1.42 ± 0.12) ().
As TSPO is known for its role in cholesterol transport, we wanted to explore whether this property of TSPO was contributing to the effect on ubiquitination described. We generated a mutant of the protein by deleting the cholesterol recognition/interaction amino acid consensus (CRAC) domain from TSPO (TSPOΔ150–158) (). To confirm loss of function, mitochondrial cholesterol accumulation was measured via Amplex Red analysis (; control: 31706 ± 293.5, +TSPO: 37107 ± 1478, +TSPOΔ150–158: 29308 ± 403.5, -TSPO: 27533 ± 334.8, NSC: 32127 ± 395). MEFs were therefore transfected with the TSPOΔ150–158 construct and monitored for the ubiquitination of mitochondrial proteins using ubiquitin-GFP (Ub-GFP; ). This approach showed that ubiquitination is largely reduced by the overexpression of TSPO, as expected, while unchanged by the mutated isoform (∼ 4 times relative to control, see ; control: 0.052 ± 0.01, +TSPO: 0.015± 0.002, TSPOΔ150–158 0.008 ± 0.003,).
Figure 5. Antioxidants restore ubiquitination deficiency in TSPO overexpressing mitochondria. (A) Struc-tural comparison of wild type TSPO and the TSPO CRAC domain deletion mutant. TSPO transmembrane doma-ins are indicated in black. (B) Evaluation of mitochondrial cholesterol capacity following modulation of WT TSPO and insertion of the mutated isoform. (C) Control MEFs and overexpressing WT TSPO or TSPOΔ pretreated (2 h) with vehicle DMSO, MnTBAP (300 μM) or methyl-β-cyclodextrin (300 μM) were exposed to FCCP (20 μM) for 6 h. All cells were transfected with Ub-GFP and immunostained against ATP5B to distinguish mitochondria. (D) The graph shows quantification of ATP5B-Ub-GFP colocalization coefficient; (n> 10 cells; P < 0.001). (E) Representative images showing mtRFP:GFP-LC3 colocalization in MEF cells overexpressing TSPO after a 4 h expo-sure to the vehicle, DMSO or FCCP, with and without a 2-h pre-treatment with MnTBAP. (F) Confocal microscopy depicts MEFs transfected with PARK2-YFP (green) and ATP5B (red) and overexpressing either TSPO or TSPOΔ150–158 after a 2-h exposure to the vehicle DMSO or FCCP. (G) and (H) report graphs with quantification of mtRFP, GFP-LC3 and PARK2-ATP5B quantifications (n> 10 cells; P < 0.001).
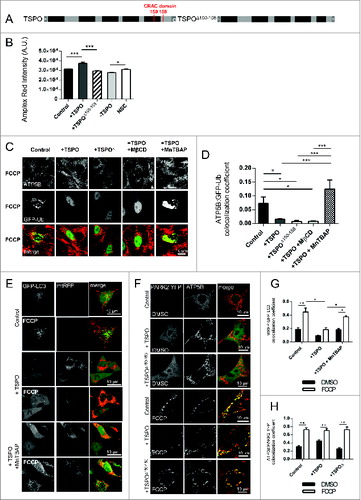
We confirmed this further by applying methyl-β-cyclodextrin (MβCD), a lipid microdomain-disrupting agent that induces mitochondrial cholesterol depletion (0.008 ± 0.002; ).Citation56 However, knowing that an imbalance in the cellular redox state associates with a limitation of PARK2-mediated ubiquitinationCitation57 and hypothesizing that TSPO may influence this pathway as its upregulation is linked to increased ROS production,Citation21 we investigated whether an antioxidant treatment could counteract the effects on ubiquitination in TSPO-overexpressing cells. And, by using the antioxidant SOD mimicking agent, MnTBAB,Citation44 the efficient ubiquitination of mitochondrial proteins was restored in TSPO-overexpressing cells (0.125 ± 0.034) compared to untreated +TSPO cells (0.015 ± 0.002) (). Notably, MnTBAP treatment was also accompanied by a visible increase in the targeting of mitochondria by autophagosomes following membrane depolarization by FCCP (DMSO, control: 0.19 ± 0.02, +TSPO: 0.09 ± 0.007, +TSPO+MnTBAP: 0.18 ± 0.03; FCCP, control: 0.45 ± 0.06, +TSPO: 0.18 ± 0.03, +TSPO+MnTBAP: 0.37 ± 0.017; with quantification in panel G). Furthermore, expression of TSPOΔ150–158 did not modify the translocation of PARK2 (DMSO – control: 0.31 ± 0.03, +TSPO: 0.26 ± 0.03, +TSPOΔ150–158: 0.45 ± 0.03; FCCP – control: 0.73 ± 0.05, +TSPO: 0.73 ± 0.07, +TSPOΔ150–158: 0.70 ± 0.05) ( with quantification in panel H) consistent with observations made for the WT protein.
The cytosolic rate of ROS production was measured using the fluorescent probe dihydroethidium (DHE), which is sensitive to O2− (superoxide) and is oxidized to the red fluorescent molecule ethidium. Citation44 The basal rate of DHE oxidation was elevated in +TSPO cells (4.70 ± 0.34) but was almost undetectable in -TSPO cells (0.42 ± 0.05) compared to controls (1.45 ± 0.09) (). Additionally, TSPOΔ150–158 increased cytosolic ROS to a level comparable with overexpression of the WT protein (Fig. S3A). The levels of reduced, biologically active glutathione (GSH), quantified with the fluorescent dye monochlorobimane (MCB), further confirmed this observation. In contrast to ROS, GSH was significantly higher in -TSPO cells (87.5 ± 6.38) compared to control (60.64 ± 6.54) (). Reduction in ROS metabolism, as seen in -TSPO cells, was thus coupled with a high ratio of reduced GSH, indicative of a balanced redox system. Interestingly, an increase, although not statistically significant, in MCB intensity was recorded in +TSPO cells (74.0 ± 4.39) that could imply an adaptive response to compensate for high basal production of mitochondrial ROS.Citation58
Figure 6 (See previous page). TSPO deregulates mitochondrial respiration as well as network morphology and size. (A) Reactive oxygen species generation was calculated by recording the rate of uptake of the O2− sensitive dye dihydroethidium (DHE). Left panel depicts representative traces collected in CF35 cells while (B) summarizes mean uptake rate (n > 10 cells; P < 0.001). (C) Mean traces representing accumulation of monochlorobimane-glutathione (GSH) fluorescent conjugate (n = 5 cells; P < 0.05). (D) Representative traces as recorded by a luminometer in CF35 cells transfected with mitochondria-targeted luciferase, and perfused with luciferin (20 μM) and ATP (100 μm). (E) Mean maximum luminescence is summarized (n = 3 cell populations; P < 0.05;). (F) Real-time quantitative RT-PCR analysis of mRNA expression of genes encoding mitochondrial biogenesis transcription factors in CF35 cells, Tfam (transcription factor A, mitochondrial) and Nrf1 (nuclear respiratory factor 1) (n> 4; p> 0.05). (G) Representative Z-stack maximum projection confocal images highlighting mitochondrial density in relation to the whole cell (CF35). Mitochondria are depicted by transfection with mt-GFP (green) while the whole cell is visualized by loading cells with SNARF-1 (red) for 30 min. (H) Quantification of mitochondrial volume, calculated as a proportion of the whole cell volume as analyzed by Volocity software (n > 20 cells; P < 0.01). (I) Western blot analysis of DNM1L levels in the mitochondrial and cytosolic fractions of MEFs modulated for TSPO before and after treatment with FCCP (4 h). Membranes were also probed with ATP5B and GAPDH as loading controls and TSPO to confirm TSPO modulation.
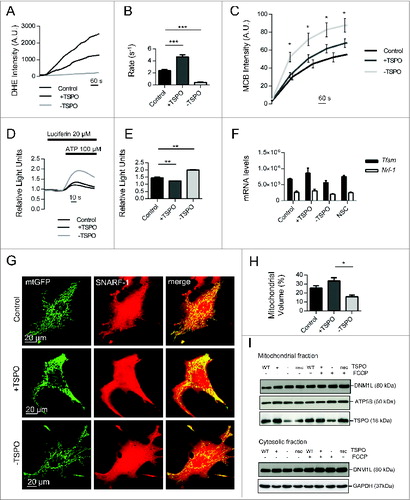
Our analysis of mitochondrial physiology under conditions of altered TSPO expression was furthered by testing the Ca2+-dependent production of ATPCitation59 using the mitochondria targeted isoform of the ATP reporter luciferase (mt-Luc) in +/−TSPO cells. The number of luminescent counts, which is proportional to ATP production,Citation59 was assayed after challenging cells with an inositol triphosphate-generating stimulus (100 μM ATP; ). This produced a rise in mitochondrial ATP that was greater in -TSPO cells (2.00 ± 0.02) compared to control (1.45 ± 0.09) and to those overexpressing TSPO (1.24 ± 0.0002) ().
To establish whether these physiological differences could be assigned to an increase/decrease in mitochondrial numbers, we monitored the expression of genes controlling mitochondrial biogenesis, namely TFAM (transcription factor A, mitochondrial) and NRF1 (nuclear respiratory factor 1).Citation60 These remained unaffected despite modulated TSPO level (control, TFAM: 673250 ± 20, NRF1: 261750 ± 41; +TSPO: TFAM 858550 ± 157, NRF1 305750 ± 547; -TSPO: TFAM 561700 ± 63600, NRF1 207250 ± 515; NSC: TFAM 754500 ± 36800, NRF1 246150 ± 185; ).
If deregulation of mitochondrial physiology were a consequence of impaired mitophagy, the mitochondrial morphology would be affected and the network would appear disorganized with uncontrolled accumulation of organelles. We monitored this using high-resolution confocal analysis of cells modulated for TSPO co-expressing the mitochondrially targeted GFP (mtGFP) (). The proportion of network volume was calculated relative to cytosolic volume, determined by staining with the cytosolic-based fluorescent dye SNARF-1. The percentage of mitochondria was greater in +TSPO cells and significantly reduced in -TSPO cells (control: 27.21%± 2.45, +TSPO: 34.11%± 2.70, -TSPO: 14.84%± 1.50 P < 0.01; n > 20; ). Individual mitochondria also appeared more connected in -TSPO cells compared to the more disorganized network evident in +TSPO cells ().
We therefore monitored the mitochondrial accumulation of the GTPase DNM1L (dynamin 1-like) among the 3 conditions of TSPO expression before and after treatment with the mitophagy-triggering stimulus FCCP. DNM1L controls the final steps of mitochondrial fission by tailoring the shape and dimensions of the network in concert with the profusion proteins.Citation61 DNM1L accumulation in mitochondrial fractions was unaltered in the cohorts of cells, indicating a TSPO-driven mechanism independent from the standard pathways of mitochondrial dynamics regulation ().
Transmission electron microscopy studies permitted analysis of the mitochondrial ultrastructure. In MEFs overexpressing TSPO, we were able to quantify the number of mitochondria in the perinuclear regions of the cell and found a significant increase (22 ± 0.73) compared to control (11 ± 0.79) (). As shown in , remodeling of cristae architecture was also apparent in cells overexpressing TSPO (+TSPO). The number of cristae per mitochondrion was quantified and plotted in (control: 10 ± 0.60; +TSPO: 4 ± 0.33). TSPO overexpression is therefore responsible for a tangible degeneration of mitochondrial structure and ultrastructure. Since this is independent from the anabolic pathways of mitochondrial biogenesis, it is therefore an efficient readout of the defective catabolic mechanisms for selection and removal of deficient mitochondria via autophagy. Elucidating the molecular mechanisms by which TSPO achieves this was our next goal of investigation.
Figure 7. The mitochondrial ultrastructure is undermined by TSPO. (A) Representative electron micrographs of the perinuclear region in MEFs in control (left panel) and +TSPO conditions (right panel). (B) Graph to show numbers of mitochondria in the perinuclear region in control and +TSPO MEFs, (n = 27 cells; P < 0.001). (C) Representative electron micrographs of individual mitochondria in MEFs in control (left panel) and +TSPO conditions (right panel). (D) Graph to show the average number of cristae per mitochondrion in control and +TSPO MEFs, (n = 18 cells; P < 0.001).
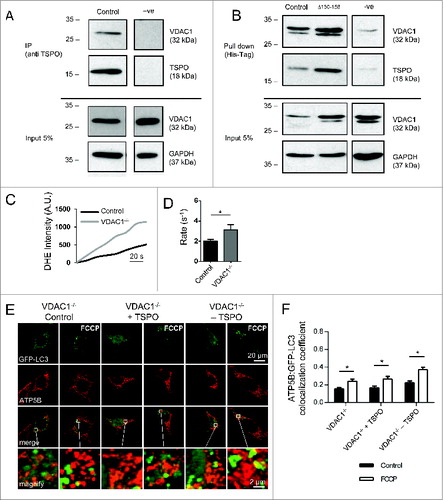
In testing candidate mechanisms downstream of TSPO, co-immunoprecipitation studies were employed to determine whether a physical interaction occurs between TSPO and VDAC1. In WT MEF cells endogenous VDAC1 co-immunoprecipitated with TSPO (). To assess the role of the CRAC domain in TSPO-VDAC interaction, polyhistidine tag affinity isolation experiments were performed in WT MEF cells ectopically expressing either His-TSPO or His-TSPOΔ150–158. VDAC1 copurified with TSPO in both conditions, indicating the CRAC domain is not required for TSPO-VDAC1 interaction (). To further investigate the molecular partnering between VDAC1 and TSPO and the importance of the TSPO:VDAC ratio in mitophagy, LC3/mitochondria colocalization experiments were repeated in VDAC1−/− MEFs (). Citation62 Although mitophagy could be triggered in VDAC1−/− cells, the response to FCCP was impaired (0.24 ± 0.022; ) compared to WT cells (0.45 ± 0.060; Fig. S1D, E). This reduced mitophagic response corresponded, as predicted, to an increased accumulation of ROS in VDAC1−/− cells (3.94 ± 0.54) (), compared to WT control cells (2.72 ± 0.24). Although transient siRNA-mediated knockdown of TSPO in VDAC1−/− cells partially increased the mitophagic response (0.37 ± 0.026) to FCCP () a substantial rescue of the phenotype was not achieved. This molecular partnering at the basis of TSPO-dependent regulation of mitophagy was inspected further by re-inserting VDAC1 in VDAC1−/− cells (Fig. S3C, D) and testing the rate of mitochondrial clearance via western blot analysis of MT-CO1 (mitochondrially encoded cytochrome c oxidase I) without and with FCCP treatment. The transient knockin of VDAC1 yielded a restoration of the inhibitory effect on mitophagy attributed to TSPO as shown by the amount of MT-CO1 before and after FCCP treatment (Fig. S3E).
Figure 8. The indispensable role of VDAC1 in the mitophagy inhibition by TSPO. (A) Cell lysates from WT MEFs were immunoprecipitated with anti-TSPO antibodies and associated VDAC1 was detected with anti-VDAC1 antibodies by western blotting; VDAC1 co-immunoprecipitates with TSPO. Five% of the lysate used for the immunoprecipitations was loaded for the input and probed with anti-VDAC1 (illustrating VDAC1 input) and anti-GAPDH (illustrating total protein input). (B) Lysates from WT MEFs expressing His-Tagged TSPO were used in affinity isolation reactions. Isolated TSPO and VDAC1 were detected with anti-TSPO and anti-VDAC1 antibodies by protein gel blotting. TSPO with the CRAC deletion is still able to interact with VDAC1. Five% of the lysate used for the affinity isolation reaction was loaded for the input and probed with anti-VDAC1 (illustrating VDAC input) and anti-GAPDH (illustrating total protein input). ROS generation was calculated by recording the rate of uptake of the O2−-sensitive dye dihydroethidium (DHE). (C) Depicts representative traces collected in MEFs while (D) summarizes mean uptake rate (P < 0.05; n > 10 cells). (E) Representative images of TSPO-modulated VDAC1−/- MEFs before and after treatment with FCCP (20 μM) for 4 h. A magnification of the merged images is shown in areas demarcated by the white box. (F) Quantification of the degree of mtRFP:GFP-LC3 colocalization in VDAC1−/− MEFs (n> 15 cells; P < 0.05).
Discussion
Here we provide evidence that the 18-kDa protein TSPO interacts with VDAC1 contributing to the efficiency of mitochondrial quality control ( and ) regulating both mitochondrial structure and function ( and ), an effect which goes beyond its regulation of cholesterol transport ().
Using co-immunoprecipitation and histidine (His)-tagged affinity isolation assays, we demonstrate interactivity between TSPO and VDAC1 thus confirming previous resultsCitation40-42,Citation63,64 and highlighting the relevance of the ratio of expression between these 2 proteins for mitochondrial homeostasis (-.
VDACCitation65,66 is fundamental for mitochondrial physiologyCitation67,68 impinging on various key aspects such as ATP synthesis,Citation69,70 and ROS production.Citation20,21 We here demonstrate that when the ratio of TSPO to VDAC1 increases, mitochondrial production of ATP is limited and ROS levels are increased (), evidence that is consistent with previous publications.Citation10,20,21
By influencing the cellular redox system, TSPO blocks the ubiquitination of mitochondrial proteins, essential for effective recruitment of the autophagosomal machinery via SQSTM1.Citation52 Cells largely devoid of TSPO show indeed an upregulation of mitochondrial ubiquitination with the same being observed in PRKCE−/− MEFs () in which TSPO expression is downregulated.Citation55
TSPO appears therefore to act downstream of the mitophagy cascade, by impeding the transfer of poly-ubiquitin chains but leaving both dissipation of the ΔΨm and the accumulation/relocation of PINK1 and PARK2 on mitochondria unaltered (, and ).Citation71 Since PARK2 is fully able to translocate efficiently despite the expression of TSPO (), we propose the modulation of ROS to be the prominent mechanism by which TSPO inhibits ubiquitination, although we could not exclude parallel effects on alternative signaling pathways already linked to ubiquitination efficiency (e.g., Ca2+).Citation72 Accumulation of oxidative stress promotes S-nitrosylation,Citation73 which in turn regulates the activation of PARK2.Citation74,75
VDACs have been reported to function as docking sites for PARK2Citation38 or as a substrate for PARK2-mediated ubiquitinationCitation39 but have been shown to be dispensable for mitophagy.Citation36 Our data could therefore assist in elucidating the ill-defined aspects of the contribution of VDAC1 in mitophagyCitation36,38,39 as the existing controversy may be principally due to, thus far, unconsidered variables such as the differences in the VDAC1-TSPO expression ratio which may naturally occur among different cell types. TSPO, VDAC1 and PARK2 could therefore represent a molecular platform for the tuning of autophagosome-mediated removal of mitochondria whose homeostatic expression ratio is essential to avoid functional and structural corruption of mitochondria.
A larger mitochondrial network is thus observed with TSPO overexpression that is not matched by: i) either upregulation of mitochondrial biogenesis, or ii) alterations in expression of pro-fission proteins () but it is instead accompanied by a paucity of mitochondrial cristae that appear sparse and malformed within the individual mitochondrion (). Upregulation of mitochondrial mass is an immediate consequence of limited mitophagy (a mismatch already seen in previous workCitation76), and likewise the respiratory inefficiency and the increased oxidative stress recorded in TSPO-overexpressing cells. Nonetheless, the increased production of ROS, to which we link the inhibition of PARK2-mediated ubiquitination, will in turn sustain the constant re-expression of TSPO, driven by the ROS-sensitive PRKCE,Citation55 thus outlining a retrograde-like signaling pathwayCitation77 in preventing mitochondrial quality control. In line with this, FCCP-treated cells seem to present an accumulation of TSPO, which could be a direct consequence of an increase in ROS, triggered by the acute and irreversible uncoupling of mitochondria mediated by the protonophore.
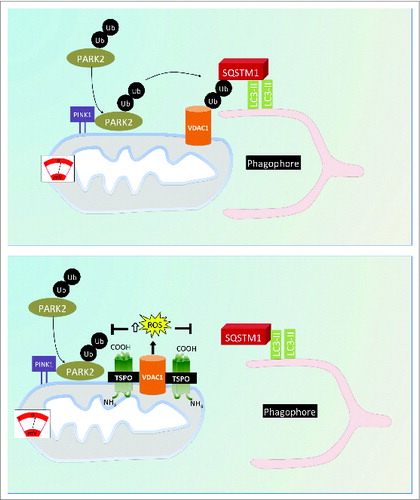
In the final model, depicted in , we propose that TSPO, via VDAC1, inhibits mitophagy by limiting the PARK2-dependent ubiquitination of mitochondria for a concomitant accumulation of ROS. This highlights further the pivotal role of the molecules composing the OMM in the regulation of mitochondrial quality as flagged by the most recent advances in the field.Citation78,79
Figure 9. Proposed model for the regulation of cell mitophagy by the TSPO:VDAC1 expression ratio. Working model for the regulation of mitophagy by TSPO and VDAC1. When TSPO expression is low relative to VDAC1, ROS production is reduced, which facilitates PARK2-mediated mitochondrial ubiquitination and results in recruitment of the autophagosomal machinery. Increasing the TSPO:VDAC1 ratio leads to elevated ROS, which inhibits PARK2-mediated ubiqutination, SQSTM1 recruitment and mitophagy.
Materials and Methods
Cell culture, transfections, and gene expression
MEFs and CF35 were maintained at 37°C under humidified conditions, 5% CO2 and grown in Dulbecco's modified Eagle medium (Life Technologies, 11995065) supplemented with 10% fetal bovine serum (Life Technologies, 10082147), 100 U/mL penicillin, and 100 mg/mL streptomycin (Life Technologies, 15140122). Cells plated on glass coverslips/10-cm dishes at a 30–50% confluence 1 d prior to transfection were transiently transfected using a standard Ca2+ phosphate method as described previously.Citation80 Cells were used in experiments 36–48 h post-transfection. To knock down TSPO expression species-dependent pre-designed siRNA was used (MEF target sequence: ACCATTGGGCCTGCTGGTCTA (Qiagen, UK), CF35 target sequence: TCCTGGTCGCTGAACCTTCCA (Ambion, UK), HeLa target sequence: CCCATCTTCTTTGGTG-CCCGA (Qiagen, UK). As a control for these studies a nonsilencing siRNA sequence (AllStars Negative Control, Qiagen, 1027281) was transfected. For overexpression studies, a pcDNA3.1 (−) construct containing the full murine Tspo cDNA ORF, a generous gift from Prof. V. Papadopoulos (McGill University)Citation81 was transfected; the empty vector was used as a control in this instance. Experiments, unless otherwise indicated, were performed in Dulbecco's modified Eagle medium supplemented with 10% fetal bovine serum or in the following saline solution (recording solution, RM): 125 mM NaCl (S5886), 5 mM KCl (P5405), 1 mM NaH2PO4 (S5011), 20 mM HEPES (H3784), 5.5 mM glucose (G7021), 5 mM NaHCO3 (S5761), and 1 mM CaCl2 (C7902), (all from Sigma-Aldrich, UK) pH 7.4.
Immunofluorescence
Cells were fixed in ice-cold acetone for 10 min at −20°C, followed by 3 × 5 min washes in phosphate-buffered saline (PBS) (Sigma-Aldrich, P4417). Where necessary, an antigen retrieval step was carried out by boiling cells in citrate buffer pH 6.0 (Sigma-Aldrich, C9999) for 15 min, and allowing the sample to cool to room temperature (RT). This was also followed by 3 × 5 min washes. Alternatively, cells were fixed in 4% paraformaldehyde (15 min, RT) (Sigma-Aldrich, P6148) and permeabilized in 0.5% Triton-X (15 min, RT; Sigma-Aldrich, T9284). Blocking was carried out for 1 h at RT in 10% goat serum (Life Technologies,16210064) and 3% bovine serum albumin (Sigma-Aldrich, A2153) in PBS (Sigma-Aldrich, P4417). Primary antibody incubations were conducted overnight for 16 h at 4 ˚C in blocking solution as described. After a further wash step, secondary antibodies were incubated for 1 h in blocking solution, before a final wash step. Cells were then mounted on slides with DAPI mounting medium (Abcam, ab104139). Cells were stained with the following primary antibodies: rabbit anti-TSPO (a generous gift from Prof. Papadopoulos) 1:500; mouse anti-VDAC (Abcam, ab14743) 1:500; anti-ATP5B (Abcam, ab14730) 1:1000; anti-SQSTM1 (Santa Cruz Biotechnologies, sc-25575) 1:500; anti-ubiquitin (Santa Cruz Biotechnology, sc-271289) 1:50, and the following secondary antibodies: anti-mouse Alexa 555 (Life Technologies, A21422) 1:1000; anti-rabbit Alexa 488 (Life Technologies, A11008) 1:1000 and anti-MT-CO1 (AbCam ab 14705) 1:1000.
ROS and GSH quantitative imaging
Dihydroethidium is sensitive to O2− (superoxide) and may be oxidized to the red fluorescent molecule ethidium. Once oxidized, ethidium binds to DNA, which results in the amplification of the red signal, within the nucleus. The rate at which the signal increases in intensity is dependent on cytosolic levels of O2−, thereby enabling the quantification of ROS levels within the cell. Cells were transferred to the Zeiss LSM 510 confocal microscope and 5 μM DHE (Life Technologies, D11347), diluted in RM, was added and the increase in fluorescence intensity was measured through continuous recording for at least 10 min. For GSH measurements, cells were incubated with 2 μM monochlorobimane (Life Technologies, M-1381MP) in RM: z-stacks were then acquired at regular intervals to follow the time course of loading over 30 min periods or until a steady state was reached. Maximum intensity projections were used to obtain values for MCB intensity at each time point.
Mitochondrial ATP measurements
A luciferin-luciferase assay was used to measure basal and real-time Ca2+-induced ATP production. CF35 cells were transfected with mitochondrially-targeted luciferase, which catalyzes the ATP-dependent oxidation of luciferin, resulting in light emission. Cells were first perfused with RM supplemented with 20 μM luciferin (Life Technologies, L2912) and alterations in bioluminescence were recorded using a custom-built luminometer (Cairn Research, Faversham, Kent, UK). When the trace stabilized, cells were immediately perfused with RM supplemented with 20 μM luciferin and 100 μM ATP (Sigma-Aldrich, A7699). Application of extracellular ATP triggers real-time Ca2+-induced mitochondrial ATP production.
RNA isolation, cDNA synthesis and quantitative real time PCR
Total RNA was extracted from the cultured cells using Tri-Reagent (Sigma-Aldrich, T9424) and purified using an RNeasy Mini Kit (Qiagen, 74104). Spectrophotometry was used to quantify and check the purity (260/280nm ratio) of the total RNA (Nanodrop, LabTech, East Sussex, UK). One microgram of total RNA was used to synthesize cDNA in a 20-μL reaction volume as described using the QuantiTect Reverse Transcription kit (Qiagen, 204141). Gene transcripts were amplified by RT-PCR using the specific primers: TSPO, GGTCTGGAAAGAGC-TGGG, GGCCCAACCCATTTGT-CG; NRF1, ATGTGTTTGAGTCTAATC, AGATACAGAGGACAAT-AG; TFAM AAGCCTCTGACTTCA-TAC, GCCCTATAAGCATCTT-CA.
Quantitative real-time PCR reactions were performed in the Chromo 4 light cycler (Bio-Rad, Hemel Hempstead, UK). The absolute quantification method was used whereby the level of gene expression was expressed as copy numbers. A standard curve was generated using known amounts of the DNA PCR product of the gene. A volume of 2 μL of the cDNA product from the reverse transcription reaction was used in a total volume of 20 μL SYBR green detection (Qiagen, 204141). The SYBR green PCR reaction mix consisted of a final concentration of 2.5 mM MgCl2, 0.1 μM of each primer, with the reaction consisting of the following: an initial 15 min denaturation step at 95 ˚C followed by denaturation at 94 ˚C for 15 sec, annealing at 55 ˚C for 25 sec and extension at 72 ˚C for 15 sec repeated for 40 cycles. The DNA standards and samples were run in the same 96-well PCR plate and the average of each duplicate value was used for subsequent statistical analyses. All PCR products were checked for specificity and purity from a melting curve profile performed by the lightcycler software at the end of each run.
Mitochondrial volume and quantification of mitophagy
CF35 cells were transfected with mt-GFP to visualize mitochondria. 36–48 h post-transfection, cells were loaded for 30 min at 37 ˚C with carboxy-snarf-1-a.m. (SNARF-1, 10 μM; Life Technologies, C1271), a red dye that stains the cytosol. Z-stacks were acquired using the Leica SP5 confocal microscope (x63 objective). Analysis was performed using Volocity software to determine the volume of the cell (SNARF-1) and of mitochondria (mt-GFP). CF35 and MEF cells, cotransfected with GFP-LC3, which is expressed on autophagosomes, and mtRFP, to visualize mitochondria, were harvested 36–48 h post-transfection and transferred to a Leica SP5 confocal microscope (x63 objective). Images were acquired of individual transfected cells at high magnification before and after application of FCCP (Sigma-Aldrich, C2920). Colocalization coefficients were calculated as a modified version of the binary intersection coefficient using ImageJ software (NIH). Images were first thresholded so that residual homogenous GFP signal was not considered, leaving only the bright green fluorescent puncta, indicative of autophagosomes. Background was also removed from mitochondrial channels. The images were then made binary in ImageJ, and objects were identified, enabling the area of each to be determined. Using the merged image, GFP-LC3 objects that fully or partially overlapped mitochondria were identified empirically. The final coefficient was calculated by dividing the summed area of these objects by the total mitochondrial area. Mitochondrial aggregation coefficients were calculated by the mean intensity of mtRFP signal/total area of mitochondria from sum z-projections of cells, with the same number of slices for each image. The intensity of the cumulative mtRFP signal will be higher within a smaller mitochondrial area indicating greater aggregation. Since transfection yields individual cells with unequal levels of overexpression or knockdown of the gene of interest, controlled sampling was carried out in order to select cells for imaging. Cells were selected that had levels of cotransfected reporter fluorescence that could be detected using the same settings on the microscope, therefore all falling into a small mean intensity range.
ΔΨm measurements
Cells cotransfected with YFP were loaded with 75 nM tetramethyl rhodamine methyl ester (TMRM; Sigma-Aldrich, T5428) and 10 μM verapamil HCl (Sigma-Aldrich, V4629; which is required to inhibit TMRM export from the cell via the multidrug transporterCitation82) in HEPES-buffered salt solution (156 mM NaCl, 3 mM KCl, 2 mM MgSO4 [Sigma, M2643], 2 mM CaCl2, 10 mM glucose; 10 mM HEPES [Sigma-Aldrich, H4034]). TMRM accumulates in mitochondria, and its signal intensity is a function of membrane potential.Citation83 Cells were allowed to equilibrate the dye for at least 30 min at room temperature before they were transferred to a Zeiss LSM 510 confocal microscope (40X objective) for imaging. Fields of transfected cells were selected before time series imaging. After several min of continuous recording at basal conditions, 20 μM FCCP was added to induce depolarization. Settings were kept constant between experiments. Mitochondrial regions of interest were demarcated and the corresponding TMRM fluorescence intensities calculated.
Protein extraction, mitochondrial isolation, and cross-linking
Cells grown on 10-cm plates were harvested, dissolved in 1 mL of lysis buffer (50 mM Tris [Sigma-Aldrich, T6066] pH 8.0, 150 mM NaCl, 1% Triton-X [Sigma-Aldrich, T9284], protease inhibitor [Roche, 04693132001]) and left on ice for 20 min. Cell debris was removed by centrifugation at 17,000 g for 20 min, leaving the whole cell lysate. For mitochondrial isolation, 500 μL fractionation buffer (250 mM sucrose, 20 mM HEPES, pH 7.4, 10 mM KCl, 1.5 mM MgCl2 [Sigma-Aldrich, M4880], 1 mM EDTA [Sigma-Aldrich, E6758], 1 mM EGTA [Sigma-Aldrich, E3889], protease inhibitor) was added to MEF cells growing on 10-cm plates. Plates were scraped immediately and the cell suspension was then passed through a 26-gauge needle 12 times before centrifuging at 700 g for 5 min. The resulting supernatant fraction was subjected to a further centrifugation at 10000 g to obtain the mitochondrial pellet, which was resuspended in lysis buffer. Cross-linking was performed by treating cells with 1 mM dithiobis[succinimidyl propionate (Thermo Scientific, 22586), 10 mM N-ethylmaleimide (Thermo Scientific, 23030) in PBS for 1 h on ice; this was then inactivated with 10 mM glycine (Sigma-Aldrich, G8898), 10 mM N-ethylmaleimide in PBS for 5 min.
Gel electrophoresis and immunoblotting analyses
Sample proteins were quantified using a bicinchoninic acid protein assay kit (Thermo Scientific, 23227). Equal amounts of protein (25 μg for whole cell lysates/cytosolic fractions; 10 μg for mitochondrial fractions) were resolved on any kD TGX™ (Bio-Rad, Hemel Hempstead, UK), 10 or 12% polyacrylamide gels and transferred to nitrocellulose membranes. The membranes were blocked in 2% nonfat dry milk in TBST (50 mM Tris, 150 mM NaCl, 0.05% Tween 20 [Sigma-Aldrich, P2287], pH 7.5) for 1 h then incubated with the appropriate diluted primary antibody at 4˚C overnight: anti-TSPO (Abcam ab109497) 1:10000; anti-ATP5B (Abcam, ab14730) 1:10000; anti-GAPDH:Hrp conjugated 1:5000 (Abcam ab9482); anti-ubiquitin (Abcam ab7254) 1:1000. Membranes were washed in TBST (3 × 15 min at RT) and then incubated with the corresponding peroxidise-conjugated secondary antibodies for 1 h at RT. After further washing in TBST, blots were developed using an ECL Plus protein gel blotting detection kit (Amersham, RPN2133). Immunoreactive bands were analyzed by performing densitometry with ImageJ software.
Immunoprecipitation
Wild-type MEFs were incubated with 20 μM FCCP or an equivalent DMSO vehicle control for 4 h at 37°C with 5% CO2. Cells were washed once in PBS then lysed by 60 passes through a 25-gauge needle in lysis buffer (20 mM Tris, 100 mM NaCl, pH 7.5) at 4°C. Unbroken cells and nuclei were removed by centrifugation at 2600 g for 5 min. Supernatant fractions were immunoprecipitated using a dynabead co-immunoprecipitation kit (Invitrogen, 14321D) following the manufacturer's instructions. Briefly, for each reaction 5 μg of anti-TSPO antibody was coupled to 1.5 mg of dynabeads using the provided coupling solutions overnight at 37°C. For negative control conditions beads were subjected to the same procedure in the absence of anti-TSPO. Supernatant fractions were mixed with the antibody-coupled beads and incubated for 1 h at 4°C with end-over-end mixing. Complexes were eluted by boiling the washed beads in SDS-PAGE loading buffer. Proteins were resolved on 12% SDS-PAGE gels, transferred onto nitrocellulose membranes, and detected with anti-VDAC (Abcam ab14743), anti-TSPO (Abcam ab109497) and anti-GAPDH (Abcam ab9482) antibodies.
His-Tag affinity isolation
Wild-type MEFs were transfected with polyhistidine-tagged TSPO, polyhistidine-tagged TSPOΔ150–158, or YFP as the negative control. After 48 h cells were washed once in PBS then lysed by 60 passes through a 25 gauge needle in lysis/wash buffer (20 mM Tris, 100 mM NaCl, 30 mM imidazole [Sigma-Aldrich, I5513], 5 mM MgCl2, 130 μM CaCl2, pH 7.5) at 4°C. Unbroken cells and nuclei were removed by centrifugation at 2600 g for 5 min. Supernatant fractions were subsequently treated with 50 units of DNAse 1 (Promega, M6101) for 30 min at 37°C. The affinity isolation reaction was performed using Dynabeads® His-Tag Isolation & Pulldown kit (Life Technologies, 10103D) following the manufacturer's protocol. Briefly, supernatant fractions were mixed with 1 mg of beads and incubated for 30 min at 4°C with end-over-end mixing. Beads were washed 4 times with lysis/wash buffer; complexes were eluted by boiling the washed beads in SDS-PAGE loading buffer. Proteins were resolved on 12% SDS-PAGE gels, transferred onto nitrocellulose membranes, and detected with anti-VDAC (Abcam ab14743), anti-TSPO (Abcam ab109497) and anti-GAPDH (Abcam ab9482) antibodies.
EM analysis
Transfected MEFs grown on melinex plastic-film (Agar Scientific, AGL4103) were identified by fluorescence microscopy and their localization marked on the plastic. Cells were fixed with phosphate-buffered 2.5% glutaraldehyde with 0.1 M sodium phosphate for 1 h. Cells were then treated with 1% osmium tetroxide in hydrogen peroxide for 1 h, dehydrated with acetone, and embedded with epon (Agar Scientific, R1045). Electron micrographs were taken with a 2 JEOL 1010 transmission electron microscope. Acquired images were analyzed using ImageJ and "Lucida" (Kinetic Imaging) to characterize precise mitochondrial size distributions and to threshold and binarize the images, allowing quantification of the volume of a mitochondrion occupied by cristae as the proportion of total pixels occupied by a mitochondrion that were below the threshold. The software was also used to define the number of cristae per mitochondrion and per 1 mm2.
Statistical analysis
Data are presented as mean ± standard error of the mean. One-way or 2-way analysis of variance (ANOVA) were used in multiple group comparisons with Tukey's post hoc test to compare 2 data sets within the group and a p value less than 0.05 was considered significant. All analyses were performed in GraphPad Prism 6.0.
Disclosure of Potential Conflicts of Interest
No potential conflicts of interest were disclosed.
Supplemental Material
Supplemental data for this article can be accessed on the publisher's website.
Campanella_supplemental_figures.ppt
Download MS Power Point (7.5 MB)Acknowledgments
We are grateful to Prof. Vassilios Papadopoulos (McGill University) for the generous gift of TSPO antibody and stimulating discussion. We thank Bigboy Simbi (RVC) for his technical assistance with the qRT-PCR and Dr. Derek Hausenloy (UCL) for providing us the MFN1 and MFN2 antibodies. We would like also to thank Prof. Francesco Cecconi (University of Rome) for wise guidance during revision and Dr. Rachel Lawrence (RVC) for critical view on EM data outline. A heartfelt thank you goes to Mark Turmaine of the main Biosciences EM Facility at UCL for kind and punctual assistance in these experiments. The Bloomsbury Colleges PhD Studentships- supported JG, at the time of the experiments.
Funding
The research activities led by MC are supported by the BBSRC New Investigator Award Grant (BB/I013695/1) –which has DE employed as PDRA-, Central Research Fund of the University of London, Local Funds of the Royal Veterinary College, the LAM Research Grant on Brain Tumors.
References
- Braestrup C. Specific benzodiazepine receptors in rat brain characterized by high-affinity [3h]diazepam binding. Proc Natl Acad Sd USA 1977; 74:3805-9; http://dx.doi.org/10.1073/pnas.74.9.3805
- Casellas P, Galiegue S, Basile AS. Peripheral benzodiazepine receptors and mitochondrial function. Neurochem Int 2002; 40:475-86; PMID:11850104; http://dx.doi.org/10.1016/S0197-0186(01)00118-8
- Papadopoulos V, Amri H, Boujrad N, Cascio C, Culty M, Garnier M, Hardwick M, Li H, Vidic B, Brown AS, et al. Peripheral benzodiazepine receptor in cholesterol transport and steroidogenesis. Steroids 1997; 62:21-8; PMID:9029710; http://dx.doi.org/10.1016/S0039-128X(96)00154-7
- De Souza EB, Anholt RR, Murphy KM, Snyder SH, Kuhar MJ. Peripheral-type benzodiazepine receptors in endocrine organs: autoradiographic localization in rat pituitary, adrenal, and testis. Endocrinology 1985; 116:567-73; PMID:2981667; http://dx.doi.org/10.1210/endo-116-2-567
- Anholt R. The peripheral-type benzodiazepine receptor - localization to the mitochondrial outer membrane. J Biol Chem 1986; 261:576-83; PMID:3001071
- Krueger KE, Papadopoulos V. Peripheral-type benzodiazepine receptors mediate translocation of cholesterol from outer to inner mitochondrial membranes in adrenocortical cells. J Biol Chem 1990; 265:15015-22; PMID:2168398
- Li H, Papadopoulos V. Peripheral-type benzodiazepine receptor function in cholesterol transport. Identification of a putative cholesterol recognition/interaction amino acid sequence and consensus pattern. Endocrinology 1998; 139:4991-7; PMID:9832438
- Hauet T, Yao ZX, Bose HS, Wall CT, Han Z, Li W, Hales DB, Miller WL, Culty M, Papadopoulos V. Peripheral-type benzodiazepine receptor-mediated action of steroidogenic acute regulatory protein on cholesterol entry into leydig cell mitochondria. Mol Endocrinol 2005; 19:540-54; PMID:15498831; http://dx.doi.org/10.1210/me.2004-0307
- Sileikyte J, Petronilli V, Zulian A, Dabbeni-Sala F, Tognon G, Nikolov P, Bernardi P, Ricchelli F. Regulation of the inner membrane mitochondrial permeability transition by the outer membrane translocator protein (peripheral benzodiazepine receptor). J Biol Chem 2010; PMID:21062740
- Gatliff J, Campanella M. The 18 kda translocator protein (tspo): A new perspective in mitochondrial biology. Curr Mol Med 2012; 12:356-68; PMID:22364127
- Guidotti A, Forchetti CM, Corda MG, Konkel D, Bennett CD, Costa E. Isolation, characterization, and purification to homogeneity of an endogenous polypeptide with agonistic action on benzodiazepine receptors. Proc Natl Acad Sci U S A 1983; 80:3531-5; PMID:6304714; http://dx.doi.org/10.1073/pnas.80.11.3531
- Patterson SD, Spahr CS, Daugas E, Susin SA, Irinopoulou T, Koehler C, Kroemer G. Mass spectrometric identification of proteins released from mitochondria undergoing permeability transition. Cell Death Differ 2000; 7:137-144; PMID:10713728; http://dx.doi.org/10.1038/sj.cdd.4400640
- Walter RB, Pirga JL, Cronk MR, Mayer S, Appelbaum FR, Banker DE. Pk11195, a peripheral benzodiazepine receptor (pbr) ligand, broadly blocks drug efflux to chemosensitize leukemia and myeloma cells by a pbr-independent, direct transporter-modulating mechanism. Blood 2005; 106:3584-93; PMID:16051742; http://dx.doi.org/10.1182/blood-2005-02-0711
- Mukhopadhyay S, Guillory B, Mukherjee S, Das SK. Antiproliferative effect of peripheral benzodiazepine receptor antagonist pk11195 in rat mammary tumor cells. Mol Cell Biochem 2010; 340:203-13; PMID:20204676; http://dx.doi.org/10.1007/s11010-010-0419-4
- Santidrian AF, Cosialls AM, Coll-Mulet L, Iglesias-Serret D, de Frias M, Gonzalez-Girones DM, Campas C, Domingo A, Pons G, Gil J. The potential anticancer agent pk11195 induces apoptosis irrespective of p53 and atm status in chronic lymphocytic leukemia cells. Haematologica 2007; 92:1631-8; PMID:18055986; http://dx.doi.org/10.3324/haematol.11194
- Hirsch T, Decaudin D, Susin SA, Marchetti P, Larochette N, Resche-Rigon M, Kroemer G. Pk11195, a ligand of the mitochondrial benzodiazepine receptor, facilitates the induction of apoptosis and reverses bcl-2-mediated cytoprotection. Exp Cell Res 1998; 241:426-34; PMID:9637784; http://dx.doi.org/10.1006/excr.1998.4084
- Decaudin D, Castedo M, Nemati F, Beurdeley-Thomas A, De Pinieux G, Caron A, Pouillart P, Wijdenes J, Rouillard D, Kroemer G, et al. Peripheral benzodiazepine receptor ligands reverse apoptosis resistance of cancer cells in vitro and in vivo. Cancer Res 2002; 62:1388-93; PMID:11888910
- Hirsch JD, Beyer CF, Malkowitz L, Beer B, Blume AJ. Mitochondrial benzodiazepine receptors mediate inhibition of mitochondrial respiratory control. Mol Pharmacol 1989; 35:157-63; PMID:2464128
- Larcher JC, Vayssiere JL, Le Marquer FJ, Cordeau LR, Keane PE, Bachy A, Gros F, Croizat BP. Effects of peripheral benzodiazepines upon the o2 consumption of neuroblastoma cells. Eur J Pharmacol 1989; 161:197-202; PMID:2542045; http://dx.doi.org/10.1016/0014-2999(89)90843-1
- Zeno S, Zaaroor M, Leschiner S, Veenman L, Gavish M. Cocl(2) induces apoptosis via the 18 kda translocator protein in u118mg human glioblastoma cells. Biochemistry 2009; 48:4652-61; PMID:19358520; http://dx.doi.org/10.1021/bi900064t
- Veenman L, Shandalov Y, Gavish M. Vdac activation by the 18 kda translocator protein (tspo), implications for apoptosis. J Bioenerg Biomembr 2008; 40:199-205; PMID:18670869; http://dx.doi.org/10.1007/s10863-008-9142-1
- Tamse CT, Lu, X, Mortel EG, Cabrales E, Feng W, Schaefer S. The peripheral benzodiazepine receptor modulates ca2+ transport through the vdac in rat heart mitochondria. J Clin Basic Cardiol 2008; 11:24-9.
- Papadopoulos V. Peripheral-type benzodiazepine/diazepam binding inhibitor receptor: biological role in steroidogenic cell function. Endocr Rev 1993; 14:222-40; PMID:8391980
- Miettinen H, Kononen J, Haapasalo H, Helen P, Sallinen P, Harjuntausta T, Helin H, Alho H. Expression of peripheral-type benzodiazepine receptor and diazepam binding inhibitor in human astrocytomas: relationship to cell proliferation. Cancer Res 1995; 55:2691-5; PMID:7780986
- Maaser K, Grabowski P, Oezdem Y, Krahn A, Heine B, Stein H, Buhr H, Zeitz M, Scherubl H. Up-regulation of the peripheral benzodiazepine receptor during human colorectal carcinogenesis and tumor spread. Clin Cancer Res 2005; 11:1751-6; PMID:15755996; http://dx.doi.org/10.1158/1078-0432.CCR-04-1955
- Beinlich A, Strohmeier R, Kaufmann M, Kuhl H. Relation of cell proliferation to expression of peripheral benzodiazepine receptors in human breast cancer cell lines. Biochem Pharmacol 2000; 60:397-402; PMID:10856435; http://dx.doi.org/10.1016/S0006-2952(00)00325-7
- Batarseh A, Papadopoulos V. Regulation of translocator protein 18 kda (tspo) expression in health and disease states. Mol Cell Endocrinol 2010; 327:1-12; PMID:20600583; http://dx.doi.org/10.1016/j.mce.2010.06.013
- Ouchi Y, Yagi S, Yokokura M, Sakamoto M. Neuroinflammation in the living brain of parkinson's disease. Parkinsonism Relat Disord 2009; 15 Suppl 3:S200-204; http://dx.doi.org/10.1016/S1353-8020(09)70814-4
- Van Camp N, Boisgard R, Kuhnast B, Theze B, Viel T, Gregoire MC, Chauveau F, Boutin H, Katsifis A, Dolle F, et al. In vivo imaging of neuroinflammation: a comparative study between [(18)f]pbr111, [ (11)c]clinme and [ (11)c]pk11195 in an acute rodent model. Eur J Nucl Med Mol Imaging 2010; 37:962-72; PMID:20069292; http://dx.doi.org/10.1007/s00259-009-1353-0
- Gerhard A, Pavese N, Hotton G, Turkheimer F, Es M, Hammers A, Eggert K, Oertel W, Banati RB, Brooks DJ. In vivo imaging of microglial activation with [11c](r)-pk11195 pet in idiopathic parkinson's disease. Neurobiol Dis 2006; 21:404-12; PMID:16182554; http://dx.doi.org/10.1016/j.nbd.2005.08.002
- Ouchi Y, Yoshikawa E, Sekine Y, Futatsubashi M, Kanno T, Ogusu T, Torizuka T. Microglial activation and dopamine terminal loss in early parkinson's disease. Ann Neurol 2005; 57:168-75; PMID:15668962; http://dx.doi.org/10.1002/ana.20338
- Matsuda N, Sato S, Shiba K, Okatsu K, Saisho K, Gautier CA, Sou YS, Saiki S, Kawajiri S, Sato F, et al. Pink1 stabilized by mitochondrial depolarization recruits parkin to damaged mitochondria and activates latent parkin for mitophagy. J Cell Biol 2010; 189:211-21; PMID:20404107; http://dx.doi.org/10.1083/jcb.200910140
- Vives-Bauza C, Zhou C, Huang Y, Cui M, de Vries RL, Kim J, May J, Tocilescu MA, Liu W, Ko HS, et al. Pink1-dependent recruitment of parkin to mitochondria in mitophagy. Proc Natl Acad Sci U S A 2010; 107:378-83; PMID:19966284; http://dx.doi.org/10.1073/pnas.0911187107
- Narendra DP, Jin SM, Tanaka A, Suen DF, Gautier CA, Shen J, Cookson MR, Youle RJ. Pink1 is selectively stabilized on impaired mitochondria to activate parkin. PLoS Biol 2010; 8:e1000298; PMID:20126261; http://dx.doi.org/10.1371/journal.pbio.1000298
- Narendra D, Tanaka A, Suen DF, Youle RJ. Parkin is recruited selectively to impaired mitochondria and promotes their autophagy. J Cell Biol 2008; 183:795-803; PMID:19029340; http://dx.doi.org/10.1083/jcb.200809125
- Narendra D, Kane LA, Hauser DN, Fearnley IM, Youle RJ. P62/sqstm1 is required for parkin-induced mitochondrial clustering but not mitophagy; vdac1 is dispensable for both. Autophagy 2010; 6:1090-106; PMID:20890124; http://dx.doi.org/10.4161/auto.6.8.13426
- Chan NC, Salazar AM, Pham AH, Sweredoski MJ, Kolawa NJ, Graham RL, Hess S, Chan DC. Broad activation of the ubiquitin-proteasome system by parkin is critical for mitophagy. Hum Mol Genet 2011; 20:1726-37; PMID:21296869; http://dx.doi.org/10.1093/hmg/ddr048
- Sun Y, Vashisht AA, Tchieu J, Wohlschlegel JA, Dreier L. Vdacs recruit parkin to defective mitochondria to promote mitochondrial autophagy. J Biol Chem. 2012 287(48):40652-60. doi: 10.1074/jbc.M112.419721
- Geisler S, Holmstrom KM, Skujat D, Fiesel FC, Rothfuss OC, Kahle PJ, Springer W. Pink1/parkin-mediated mitophagy is dependent on vdac1 and p62/sqstm1. Nat Cell Biol 2010; 12:119-31; PMID:20098416; http://dx.doi.org/10.1038/ncb2012
- Garnier M, Dimchev AB, Boujrad N, Price JM, Musto NA, Papadopoulos V. In vitro reconstitution of a functional peripheral-type benzodiazepine receptor from mouse leydig tumor cells. Mol Pharmacol 1994; 45:201-11; PMID:8114671
- McEnery MW, Snowman AM, Trifiletti RR, Snyder SH. Isolation of the mitochondrial benzodiazepine receptor: association with the voltage-dependent anion channel and the adenine nucleotide carrier. Proc Natl Acad Sci U S A 1992; 89:3170-4; PMID:1373486; http://dx.doi.org/10.1073/pnas.89.8.3170
- Szabo I, De Pinto V, Zoratti M. The mitochondrial permeability transition pore may comprise vdac molecules. Ii. The electrophysiological properties of vdac are compatible with those of the mitochondrial megachannel. FEBS Lett 1993; 330:206-10; PMID:7689984; http://dx.doi.org/10.1016/0014-5793(93)80274-X
- Seneviratne MS, Faccenda D, De Biase V, Campanella M. Pk11195 inhibits mitophagy targeting the f1fo-atpsynthase in bcl-2 knock-down cells. Curr Mol Med 2012; 12:476-82; PMID:22348615
- Campanella M, Seraphim A, Abeti R, Casswell E, Echave P, Duchen MR. If1, the endogenous regulator of the f(1)f(o)-atpsynthase, defines mitochondrial volume fraction in hela cells by regulating autophagy. Biochim Biophys Acta 2009; 1787:393-401; PMID:19269273; http://dx.doi.org/10.1016/j.bbabio.2009.02.023
- Narendra DP, Youle RJ. Targeting mitochondrial dysfunction: role for pink1 and parkin in mitochondrial quality control. Antioxid Redox Signal 2011; 14:1929-38; PMID:21194381; http://dx.doi.org/10.1089/ars.2010.3799
- Ostuni MA, Issop L, Peranzi G, Walker F, Fasseu M, Elbim C, Papadopoulos V, Lacapere JJ. Overexpression of translocator protein in inflammatory bowel disease: Potential diagnostic and treatment value. Inflamm Bowel Dis 2010; 16:1476-87; PMID:20222126; http://dx.doi.org/10.1002/ibd.21250
- Kabeya Y, Mizushima N, Ueno T, Yamamoto A, Kirisako T, Noda T, Kominami E, Ohsumi Y, Yoshimori T. Lc3, a mammalian homologue of yeast apg8p, is localized in autophagosome membranes after processing. EMBO J 2000; 19:5720-8; PMID:11060023; http://dx.doi.org/10.1093/emboj/19.21.5720
- Johnson LV, Walsh ML, Bockus BJ, Chen LB. Monitoring of relative mitochondrial membrane potential in living cells by fluorescence microscopy. J Cell Biol 1981; 88:526-35; PMID:6783667; http://dx.doi.org/10.1083/jcb.88.3.526
- Yamamoto A, Tagawa Y, Yoshimori T, Moriyama Y, Masaki R, Tashiro Y. Bafilomycin a1 prevents maturation of autophagic vacuoles by inhibiting fusion between autophagosomes and lysosomes in rat hepatoma cell line, h-4-ii-e cells. Cell Struct Funct 1998; 23:33-42; PMID:9639028; http://dx.doi.org/10.1247/csf.23.33
- Faccenda D, Campanella M. Molecular regulation of the mitochondrial f(1)f(o)-atpsynthase: Physiological and pathological significance of the inhibitory factor 1 (if(1)). Int J Cell Biol 2012; 2012:367934; PMID:22966230; http://dx.doi.org/10.1155/2012/367934
- Klionsky DJ, Abdalla FC, Abeliovich H, Abraham RT, Acevedo-Arozena A, Adeli K, Agholme L, Agnello M, Agostinis P, Aguirre-Ghiso JA, et al. Guidelines for the use and interpretation of assays for monitoring autophagy. Autophagy 2012; 8:445-544; PMID:22966490; http://dx.doi.org/10.4161/auto.19496
- Pankiv S, Clausen TH, Lamark T, Brech A, Bruun JA, Outzen H, Overvatn A, Bjorkoy G, Johansen T. P62/sqstm1 binds directly to atg8/lc3 to facilitate degradation of ubiquitinated protein aggregates by autophagy. J Biol Chem 2007; 282:24131-45; PMID:17580304; http://dx.doi.org/10.1074/jbc.M702824200
- Okatsu K, Saisho K, Shimanuki M, Nakada K, Shitara H, Sou YS, Kimura M, Sato S, Hattori N, Komatsu M, et al. P62/sqstm1 cooperates with parkin for perinuclear clustering of depolarized mitochondria. Genes Cells 2010; 15:887-900; PMID:20604804
- Tanaka A, Cleland MM, Xu S, Narendra DP, Suen DF, Karbowski M, Youle RJ. Proteasome and p97 mediate mitophagy and degradation of mitofusins induced by parkin. J Cell Biol 2010; 191:1367-80; PMID:21173115; http://dx.doi.org/10.1083/jcb.201007013
- Batarseh A, Giatzakis C, Papadopoulos V. Phorbol-12-myristate 13-acetate acting through protein kinase cepsilon induces translocator protein (18-kda) tspo gene expression. Biochemistry 2008; 47:12886-99; PMID:18975922; http://dx.doi.org/10.1021/bi8012643
- Ziolkowski W, Szkatula M, Nurczyk A, Wakabayashi T, Kaczor JJ, Olek RA, Knap N, Antosiewicz J, Wieckowski MR, Wozniak M. Methyl-β-cyclodextrin induces mitochondrial cholesterol depletion and alters the mitochondrial structure and bioenergetics. FEBS Lett 2010; 584:4606-10; PMID:20965172; http://dx.doi.org/10.1016/j.febslet.2010.10.023
- Yao D, Gu Z, Nakamura T, Shi ZQ, Ma Y, Gaston B, Palmer LA, Rockenstein EM, Zhang Z, Masliah E, et al. Nitrosative stress linked to sporadic parkinson's disease: S-nitrosylation of parkin regulates its e3 ubiquitin ligase activity. Proc Natl Acad Sci U S A 2004; 101:10810-14; PMID:15252205; http://dx.doi.org/10.1073/pnas.0404161101
- Recktenwald CV, Kellner R, Lichtenfels R, Seliger B. Altered detoxification status and increased resistance to oxidative stress by k-ras transformation. Cancer Res 2008; 68:10086-93; PMID:19074874; http://dx.doi.org/10.1158/0008-5472.CAN-08-0360
- Jouaville LS, Pinton P, Bastianutto C, Rutter GA, Rizzuto R. Regulation of mitochondrial atp synthesis by calcium: Evidence for a long-term metabolic priming. Proc Natl Acad Sci U S A 1999; 96:13807-12; PMID:10570154; http://dx.doi.org/10.1073/pnas.96.24.13807
- Wu Z, Puigserver P, Andersson U, Zhang C, Adelmant G, Mootha V, Troy A, Cinti S, Lowell B, Scarpulla RC, et al. Mechanisms controlling mitochondrial biogenesis and respiration through the thermogenic coactivator pgc-1. Cell 1999; 98:115-24; PMID:10412986; http://dx.doi.org/10.1016/S0092-8674(00)80611-X
- Youle RJ, van der Bliek AM. Mitochondrial fission, fusion, and stress. Science 2012; 337:1062-5; PMID:22936770; http://dx.doi.org/10.1126/science.1219855
- Wu S, Sampson MJ, Decker WK, Craigen WJ. Each mammalian mitochondrial outer membrane porin protein is dispensable: effects on cellular respiration. Biochim Biophys Acta 1999; 1452:68-78; PMID:10525161; http://dx.doi.org/10.1016/S0167-4889(99)00120-2
- Papadopoulos V, Boujrad N, Ikonomovic MD, Ferrara P, Vidic B. Topography of the leydig cell mitochondrial peripheral-type benzodiazepine receptor. Mol Cell Endocrinol 1994; 104:R5-9; PMID:7821699; http://dx.doi.org/10.1016/0303-7207(94)90061-2
- Snyder SH, Verma A, Trifiletti RR. The peripheral-type benzodiazepine receptor: A protein of mitochondrial outer membranes utilizing porphyrins as endogenous ligands. FASEB J 1987; 1:282-8; PMID:2820823
- Lemasters JJ, Holmuhamedov E. Voltage-dependent anion channel (vdac) as mitochondrial governator–thinking outside the box. Biochim Biophys Acta 2006; 1762:181-90; PMID:16307870; http://dx.doi.org/10.1016/j.bbadis.2005.10.006
- Colombini M. Vdac: the channel at the interface between mitochondria and the cytosol. Mol Cell Biochem 2004; 256–257:107-15; http://dx.doi.org/10.1023/B:MCBI.0000009862.17396.8d
- Gincel D, Zaid H, Shoshan-Barmatz V. Calcium binding and translocation by the voltage-dependent anion channel: a possible regulatory mechanism in mitochondrial function. Biochem J 2001; 358:147-55; PMID:11485562; http://dx.doi.org/10.1042/0264-6021:3580147
- Rapizzi E, Pinton P, Szabadkai G, Wieckowski MR, Vandecasteele G, Baird G, Tuft RA, Fogarty KE, Rizzuto R. Recombinant expression of the voltage-dependent anion channel enhances the transfer of ca2+ microdomains to mitochondria. J Cell Biol 2002; 159:613-24; PMID:12438411; http://dx.doi.org/10.1083/jcb.200205091
- Rostovtseva T, Colombini M. Vdac channels mediate and gate the flow of atp: Implications for the regulation of mitochondrial function. Biophys J 1997; 72:1954-62; PMID:9129800; http://dx.doi.org/10.1016/S0006-3495(97)78841-6
- Hodge T, Colombini M. Regulation of metabolite flux through voltage-gating of vdac channels. J Membr Biol 1997; 157:271-9; PMID:9178614; http://dx.doi.org/10.1007/s002329900235
- Youle RJ, Narendra DP. Mechanisms of mitophagy. Nat Rev Mol Cell Biol 2011; 12:9-14; PMID:21179058; http://dx.doi.org/10.1038/nrm3028
- Chen H, Polo S, Di Fiore PP, De Camilli PV. Rapid ca2+-dependent decrease of protein ubiquitination at synapses. Proc Natl Acad Sci U S A 2003; 100:14908-13; PMID:14657369; http://dx.doi.org/10.1073/pnas.2136625100
- Meng F, Yao D, Shi Y, Kabakoff J, Wu W, Reicher J, Ma Y, Moosmann B, Masliah E, Lipton SA, et al. Oxidation of the cysteine-rich regions of parkin perturbs its e3 ligase activity and contributes to protein aggregation. Mol Neurodegener 2011; 6:34; PMID:21595948; http://dx.doi.org/10.1186/1750-1326-6-34
- Ozawa K, Komatsubara AT, Nishimura Y, Sawada T, Kawafune H, Tsumoto H, Tsuji Y, Zhao J, Kyotani Y, Tanaka T, et al. S-nitrosylation regulates mitochondrial quality control via activation of parkin. Sci Rep 2013; 3:2202; PMID:23857542
- Chung KK, Thomas B, Li X, Pletnikova O, Troncoso JC, Marsh L, Dawson VL, Dawson TM. S-nitrosylation of parkin regulates ubiquitination and compromises parkin's protective function. Science 2004; 304:1328-31; PMID:15105460; http://dx.doi.org/10.1126/science.1093891
- Gomes LC, Di Benedetto G, Scorrano L. During autophagy mitochondria elongate, are spared from degradation and sustain cell viability. Nat Cell Biol 2011; 13:589-98; PMID:21478857; http://dx.doi.org/10.1038/ncb2220
- Wallace DC. Mitochondria and cancer. Nat Rev Cancer 2012; 12:685-98; PMID:23001348; http://dx.doi.org/10.1038/nrc3365
- Chen Y, Dorn GW, 2nd. Pink1-phosphorylated mitofusin 2 is a parkin receptor for culling damaged mitochondria. Science 2013; 340:471-5; PMID:23620051; http://dx.doi.org/10.1126/science.1231031
- Sarraf SA, Raman M, Guarani-Pereira V, Sowa ME, Huttlin EL, Gygi SP, Harper JW. Landscape of the parkin-dependent ubiquitylome in response to mitochondrial depolarization. Nature 2013; 496:372-6; PMID:23503661; http://dx.doi.org/10.1038/nature12043
- Morelli A, Chiozzi P, Chiesa A, Ferrari D, Sanz JM, Falzoni S, Pinton P, Rizzuto R, Olson MF, Di Virgilio F. Extracellular atp causes rock i-dependent bleb formation in p2x7-transfected hek293 cells. Mol Biol Cell 2003; 14:2655-64; PMID:12857854; http://dx.doi.org/10.1091/mbc.02-04-0061
- Liu J, Rone MB, Papadopoulos V. Protein-protein interactions mediate mitochondrial cholesterol transport and steroid biosynthesis. J Biol Chem 2006; 281:38879-93; PMID:17050526; http://dx.doi.org/10.1074/jbc.M608820200
- McKenzie M, Liolitsa D, Akinshina N, Campanella M, Sisodiya S, Hargreaves I, Nirmalananthan N, Sweeney MG, Abou-Sleiman PM, Wood NW, et al. Mitochondrial nd5 gene variation associated with encephalomyopathy and mitochondrial atp consumption. J Biol Chem 2007; 282:36845-52; PMID:17940288; http://dx.doi.org/10.1074/jbc.M704158200
- Scaduto RC, Jr., Grotyohann LW. Measurement of mitochondrial membrane potential using fluorescent rhodamine derivatives. Biophys J 1999; 76:469-477; PMID:9876159; http://dx.doi.org/10.1016/S0006-3495(99)77214-0